project-47e66764
 Harendra Singh Yadav
Prompt: NSE F&O Strategy Screener (Web Browser app) Use this prompt with a coding assistant (Claude Code, Cursor, etc.) or hand it to a developer to build the app. Objective Build a Windows desktop application that screens all F&O stocks, plus Nifty, Bank Nifty, and Sensex (index options — CE and PE) for the current trading day, and flags every instrument whose underlying price chart currently satisfies all three conditions of my strategy simultaneously: Close(0) crosses above Supertrend(10,3) — trend has just turned bullish. Close(0) crosses above Upper Bollinger Band(20,2) — breakout above the recent volatility range. RSI(14) > 60 — confirms bullish momentum. The screener runs on the underlying's price/candle data (stock or index), but the output should list the corresponding CE and PE option contracts for that underlying so I can act on them directly (nearest expiry, ATM ± a configurable number of strikes). Tech Stack Language: Python 3.11+ UI Framework: PyQt6 (or PySide6) for a native-feeling Windows desktop app — not a browser wrapper. Packaging: PyInstaller to produce a single .exe for Windows. Data/Indicators: pandas, numpy, ta or pandas-ta for Supertrend/BB/RSI (or hand-rolled formulas — see below for exact definitions). Scheduler: APScheduler or a simple QTimer loop for periodic re-scans during market hours (9:15 AM–3:30 PM IST). Persistence: SQLite (local file) to log every scan's flagged results with timestamps, for later review/backtesting. Data Source (needs a decision from me — ask if not specified) The app needs live/near-live OHLC candle data (I'd suggest 5-min or 15-min candles, configurable) for: All current F&O-eligible stocks (~180–200 names, list changes periodically — pull the official NSE F&O security list, don't hardcode). Nifty 50, Bank Nifty, Sensex index spot data. Option chain data (strikes, CE/PE symbols, LTP, OI) for Nifty, Bank Nifty, Sensex, and F&O stocks with options. Options for data source (pick one, each has different auth/cost implications): Broker API (Zerodha Kite Connect, Upstox, Fyers, Angel One SmartAPI, Dhan) — needs my API key/access token, most reliable for live intraday candles + option chain. NSE India's public endpoints (unofficial, rate-limited, can break without notice) — free but fragile, only good for EOD/option chain snapshots, not reliable for intraday candles. Paid data vendor (TrueData, Global Datafeeds, AlgoBulls) — most robust, has a subscription cost. Ask me which data source I have access to / want to use before writing the data-fetch layer — the rest of the app is source-agnostic if the data layer returns a standard OHLC DataFrame. Indicator Definitions (exact formulas to implement) Supertrend(10, 3): ATR period = 10, multiplier = 3. Basic Upper Band = (High+Low)/2 + multiplierATR Basic Lower Band = (High+Low)/2 - multiplierATR Final bands carry forward per standard Supertrend recursive rules (final upper/lower band only moves toward price, not away). Trend flips bullish when Close crosses above the final upper band (which then becomes the active Supertrend line). Bollinger Bands(20, 2): Middle Band = 20-period SMA of Close. Upper Band = Middle + 2 × (20-period rolling std dev of Close). "Crosses above" = previous close ≤ previous upper band, AND current close > current upper band. RSI(14): Standard Wilder's smoothing RSI, 14-period. Condition: current RSI value > 60. "Crosses above" logic for Supertrend and BB (must use previous vs. current candle, not just current-candle-above): crossed_up = (prev_close <= prev_reference_line) and (curr_close > curr_reference_line) Screening Logic For each underlying (all F&O stocks + Nifty + Bank Nifty + Sensex): Fetch/update latest candles for the selected timeframe. Compute Supertrend(10,3), Bollinger Bands(20,2), RSI(14). Check all 3 conditions on the most recently closed candle (avoid using an incomplete forming candle unless I explicitly enable a "live/unconfirmed candle" mode). If all 3 conditions are true → mark underlying as a "hit." For each hit, pull that underlying's current option chain, and list: ATM CE and PE symbols (and N strikes OTM/ITM either side — configurable, default ATM only). Nearest weekly/monthly expiry (configurable which). LTP, bid/ask spread, OI, IV if available from the data source. UI Requirements Main dashboard: a live-updating table of all "hits" — columns: Underlying, Timeframe, Last Close, Supertrend value, Upper BB value, RSI value, Trigger time, Suggested CE symbol + LTP, Suggested PE symbol + LTP. Filters: dropdown to scope to Stocks only / Indices only / All; timeframe selector (5m/15m/1h/1D); strike-offset selector for options. Status bar: last scan time, next scan countdown, market open/closed indicator, data source connection status. Detail view: click a row to open a candlestick chart (mplfinance or lightweight-charts embedded) showing price, Supertrend line, Bollinger Bands, and RSI subplot, with the trigger candle highlighted. Alerts: optional Windows toast notification + sound when a new hit appears during market hours. History tab: table of all past hits (from the SQLite log), filterable by date, exportable to CSV/Excel. Settings panel: API keys/tokens for chosen data source, scan interval, timeframe, strike offset, alert toggle — all persisted locally (encrypted if storing broker tokens). Non-Functional Requirements Must run scans only during NSE market hours by default (9:15 AM–3:30 PM IST), with a manual "scan now" override button for testing outside market hours using last available data. Should handle F&O stock list changes gracefully (re-fetch the official list periodically rather than hardcoding). Should degrade gracefully if the data source rate-limits or disconnects — show a clear status indicator, retry with backoff, don't crash. Log errors to a local file for debugging. No cloud dependency required beyond the chosen market-data source — app should work as a standalone local tool. Deliverables Full Python source code, organized as: data/ — data source adapters (interchangeable). indicators/ — Supertrend, Bollinger Bands, RSI calculations (unit-testable, pure functions). screener/ — scan orchestration logic. ui/ — PyQt6 views. storage/ — SQLite models for scan history. requirements.txt and a build script (build.bat or PyInstaller .spec file) to produce a distributable .exe. A short README covering: how to configure the data source API keys, how to run in dev mode, how to build the .exe, and known limitations of the chosen data source. I want to make sure I build the right thing for you. One important note up front: this environment builds web applications (they run in the browser and are hosted on Puter), not native Windows Python/PyQt6 .exe desktop apps. I can build you a fully-featured web-based version of this exact F&O strategy screener — same strategy logic (Supertrend/BB/RSI), same hit table, charts, history, alerts, and settings — but as a polished web app rather than a packaged .exe. Before I start, I need one or two quick decisions: Got it — building with: A native Windows .exe isn't possible here, but I can build the same screener as a polished web app. Is that okay? Yes, build the web version Which market-data source should the screener use for candles + option chain? Zerodha Kite Connect Default candle timeframe for scans? 5-minute


Comments (0)
Sign in to leave a comment
System Requirements
Project-47e66764 System Requirements Document
1. Introduction
This document outlines the system requirements for Project-47e66764, a web-based NSE F&O Strategy Screener application. The application is designed to screen F&O stocks and indices such as Nifty, Bank Nifty, and Sensex for specific trading strategies.
2. System Overview
Project-47e66764 aims to provide a web-based application that screens financial instruments based on specific trading strategies. The application will analyze underlying price charts and flag instruments that meet predefined conditions. It will operate during NSE market hours and provide real-time updates and alerts to users.
3. Functional Requirements
- As a User, I should be able to view a live-updating table of all "hits" with relevant data such as Underlying, Timeframe, Last Close, Supertrend value, Upper BB value, RSI value, Trigger time, Suggested CE symbol + LTP, and Suggested PE symbol + LTP.
- As a User, I should be able to filter the dashboard by Stocks only, Indices only, or All.
- As a User, I should be able to select the timeframe for analysis (5m/15m/1h/1D).
- As a User, I should be able to select the strike-offset for options.
- As a User, I should be able to view a status bar indicating the last scan time, next scan countdown, market open/closed status, and data source connection status.
- As a User, I should be able to click a row to open a detailed candlestick chart showing price, Supertrend line, Bollinger Bands, and RSI subplot with the trigger candle highlighted.
- As a User, I should receive optional Windows toast notifications and sound alerts when a new hit appears during market hours.
- As a User, I should be able to view a history tab of all past hits, filterable by date and exportable to CSV/Excel.
- As a User, I should be able to configure settings such as API keys/tokens, scan interval, timeframe, strike offset, and alert toggle.
- As a User, I should be able to manually override scans outside market hours using the last available data.
- As a User, I should be able to view error logs for debugging purposes.
4. User Personas
- Trader: A user who actively trades in the stock market and uses the screener to identify potential trading opportunities based on specific strategies.
- Analyst: A user who analyzes market trends and uses the screener to gather data for reports and presentations.
5. Core User Flows
- Trader logs in -> selects filters and timeframes -> views live-updating table -> receives alerts for new hits -> clicks on a hit for detailed analysis -> makes trading decisions.
- Analyst logs in -> selects filters and timeframes -> exports historical data -> analyzes data for trends and patterns -> prepares reports.
6. Visuals Colors and Theme
- primary: #1E3A8A (Deep Blue)
- primary_light: #3B82F6 (Light Blue)
- secondary: #F97316 (Orange)
- accent: #10B981 (Green)
- highlight: #F59E0B (Amber)
- bg: #F3F4F6 (Light Gray)
- surface: rgba(255, 255, 255, 0.9)
- text: #111827 (Dark Gray)
- text_muted: #6B7280 (Muted Gray)
- border: rgba(209, 213, 219, 0.5)
7. Signature Design Concept
The homepage of Project-47e66764 will feature an interactive financial dashboard with a dynamic, real-time updating table of trading hits. Users can hover over table rows to reveal detailed insights and click to expand interactive charts. The design will employ a parallax effect, where background elements move at different speeds to create a sense of depth. The charts will be animated using framer-motion for smooth transitions and interactions, providing a seamless user experience.
8. Interaction Model & Motion Direction
The landing page will utilize a "parallax" interaction model, creating a visually rich first impression with layered depth via scroll. Internal pages will maintain a "static" model for clarity and ease of data analysis.
9. Non-Functional Requirements
- The application must operate during NSE market hours (9:15 AM–3:30 PM IST) and handle F&O stock list changes gracefully.
- The application should degrade gracefully if the data source rate-limits or disconnects, with clear status indicators and retry mechanisms.
- Error logs should be maintained locally for debugging purposes.
10. Tech Stack
- Frontend: React for Web
- Backend: Python 3.11+, FastAPI
- Database: SQLite for local persistence
- Data Source: Zerodha Kite Connect for market data
- UI Framework: PyQt6 or PySide6
- Packaging: PyInstaller for distribution
- Scheduler: APScheduler or QTimer loop
11. Assumptions and Constraints
- The application will use Zerodha Kite Connect as the data source, requiring user-provided API keys.
- The default candle timeframe for scans is set to 5 minutes.
- The application is designed as a web-based tool and not as a native Windows desktop application.
12. Glossary
- F&O: Futures and Options
- NSE: National Stock Exchange of India
- CE: Call Option
- PE: Put Option
- LTP: Last Traded Price
- OI: Open Interest
- IV: Implied Volatility
- OHLC: Open, High, Low, Close (data format for candlestick charts)
- Supertrend: A trend-following indicator
- Bollinger Bands: A volatility indicator
- RSI: Relative Strength Index, a momentum indicator
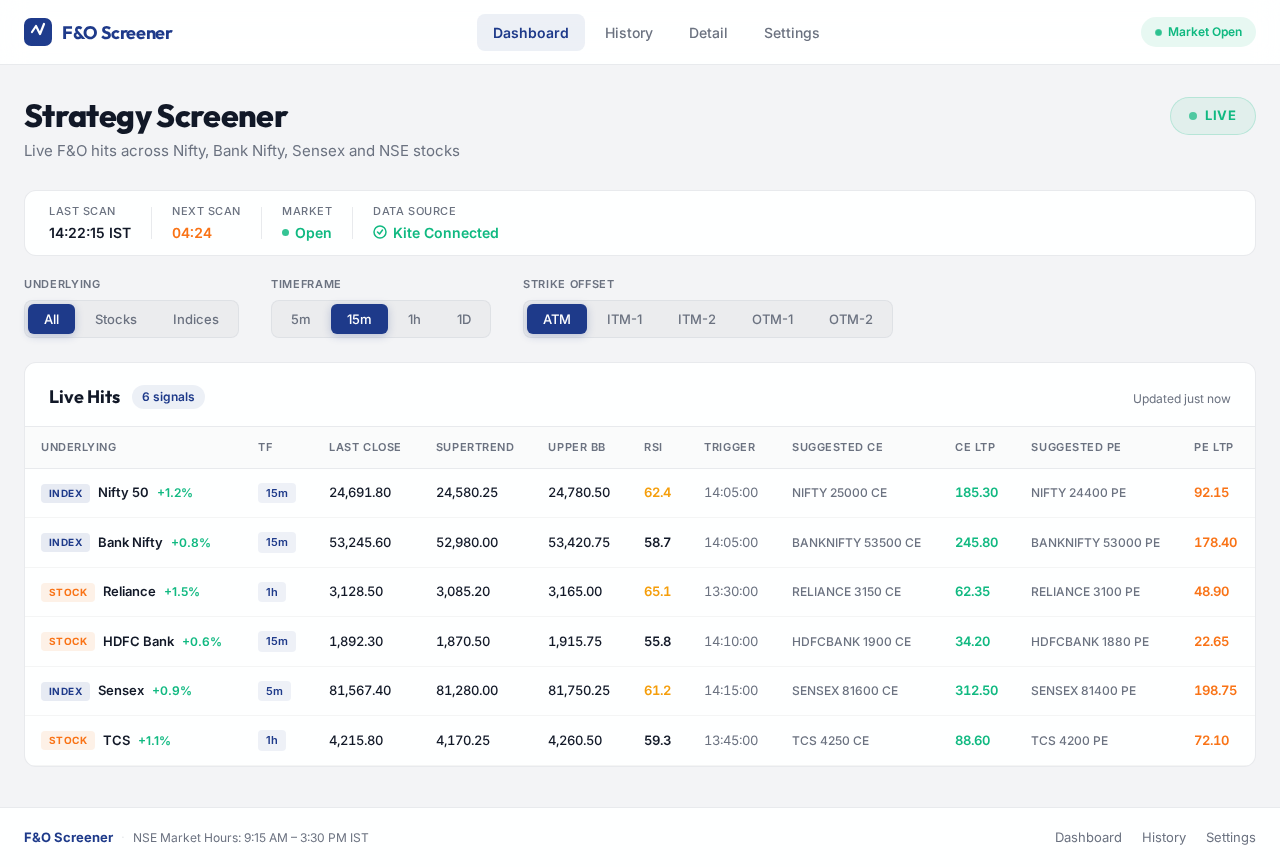
Strategy Screener
Live F&O hits across Nifty, Bank Nifty, Sensex and NSE stocks
Live Hits
6 signals| Underlying | TF | Last Close | Supertrend | Upper BB | RSI | Trigger | Suggested CE | CE LTP | Suggested PE | PE LTP |
|---|---|---|---|---|---|---|---|---|---|---|
| 15m | 24,691.80 | 24,580.25 | 24,780.50 | 62.4 | 14:05:00 | NIFTY 25000 CE | 185.30 | NIFTY 24400 PE | 92.15 | |
| 15m | 53,245.60 | 52,980.00 | 53,420.75 | 58.7 | 14:05:00 | BANKNIFTY 53500 CE | 245.80 | BANKNIFTY 53000 PE | 178.40 | |
| 1h | 3,128.50 | 3,085.20 | 3,165.00 | 65.1 | 13:30:00 | RELIANCE 3150 CE | 62.35 | RELIANCE 3100 PE | 48.90 | |
| 15m | 1,892.30 | 1,870.50 | 1,915.75 | 55.8 | 14:10:00 | HDFCBANK 1900 CE | 34.20 | HDFCBANK 1880 PE | 22.65 | |
| 5m | 81,567.40 | 81,280.00 | 81,750.25 | 61.2 | 14:15:00 | SENSEX 81600 CE | 312.50 | SENSEX 81400 PE | 198.75 | |
| 1h | 4,215.80 | 4,170.25 | 4,260.50 | 59.3 | 13:45:00 | TCS 4250 CE | 88.60 | TCS 4200 PE | 72.10 |
Strategy Screener
Live F&O hits across Nifty, Bank Nifty, Sensex and NSE stocks
Live Hits
6 signals| Underlying | TF | Last Close | Supertrend | Upper BB | RSI | Trigger | Suggested CE | CE LTP | Suggested PE | PE LTP |
|---|---|---|---|---|---|---|---|---|---|---|
| 15m | 24,691.80 | 24,580.25 | 24,780.50 | 62.4 | 14:05:00 | NIFTY 25000 CE | 185.30 | NIFTY 24400 PE | 92.15 | |
| 15m | 53,245.60 | 52,980.00 | 53,420.75 | 58.7 | 14:05:00 | BANKNIFTY 53500 CE | 245.80 | BANKNIFTY 53000 PE | 178.40 | |
| 1h | 3,128.50 | 3,085.20 | 3,165.00 | 65.1 | 13:30:00 | RELIANCE 3150 CE | 62.35 | RELIANCE 3100 PE | 48.90 | |
| 15m | 1,892.30 | 1,870.50 | 1,915.75 | 55.8 | 14:10:00 | HDFCBANK 1900 CE | 34.20 | HDFCBANK 1880 PE | 22.65 | |
| 5m | 81,567.40 | 81,280.00 | 81,750.25 | 61.2 | 14:15:00 | SENSEX 81600 CE | 312.50 | SENSEX 81400 PE | 198.75 | |
| 1h | 4,215.80 | 4,170.25 | 4,260.50 | 59.3 | 13:45:00 | TCS 4250 CE | 88.60 | TCS 4200 PE | 72.10 |
No comments yet. Be the first!