project-47e66764
 Harendra Singh Yadav
Prompt: NSE F&O Strategy Screener (Web Browser app) Use this prompt with a coding assistant (Claude Code, Cursor, etc.) or hand it to a developer to build the app. Objective Build a Windows desktop application that screens all F&O stocks, plus Nifty, Bank Nifty, and Sensex (index options — CE and PE) for the current trading day, and flags every instrument whose underlying price chart currently satisfies all three conditions of my strategy simultaneously: Close(0) crosses above Supertrend(10,3) — trend has just turned bullish. Close(0) crosses above Upper Bollinger Band(20,2) — breakout above the recent volatility range. RSI(14) > 60 — confirms bullish momentum. The screener runs on the underlying's price/candle data (stock or index), but the output should list the corresponding CE and PE option contracts for that underlying so I can act on them directly (nearest expiry, ATM ± a configurable number of strikes). Tech Stack Language: Python 3.11+ UI Framework: PyQt6 (or PySide6) for a native-feeling Windows desktop app — not a browser wrapper. Packaging: PyInstaller to produce a single .exe for Windows. Data/Indicators: pandas, numpy, ta or pandas-ta for Supertrend/BB/RSI (or hand-rolled formulas — see below for exact definitions). Scheduler: APScheduler or a simple QTimer loop for periodic re-scans during market hours (9:15 AM–3:30 PM IST). Persistence: SQLite (local file) to log every scan's flagged results with timestamps, for later review/backtesting. Data Source (needs a decision from me — ask if not specified) The app needs live/near-live OHLC candle data (I'd suggest 5-min or 15-min candles, configurable) for: All current F&O-eligible stocks (~180–200 names, list changes periodically — pull the official NSE F&O security list, don't hardcode). Nifty 50, Bank Nifty, Sensex index spot data. Option chain data (strikes, CE/PE symbols, LTP, OI) for Nifty, Bank Nifty, Sensex, and F&O stocks with options. Options for data source (pick one, each has different auth/cost implications): Broker API (Zerodha Kite Connect, Upstox, Fyers, Angel One SmartAPI, Dhan) — needs my API key/access token, most reliable for live intraday candles + option chain. NSE India's public endpoints (unofficial, rate-limited, can break without notice) — free but fragile, only good for EOD/option chain snapshots, not reliable for intraday candles. Paid data vendor (TrueData, Global Datafeeds, AlgoBulls) — most robust, has a subscription cost. Ask me which data source I have access to / want to use before writing the data-fetch layer — the rest of the app is source-agnostic if the data layer returns a standard OHLC DataFrame. Indicator Definitions (exact formulas to implement) Supertrend(10, 3): ATR period = 10, multiplier = 3. Basic Upper Band = (High+Low)/2 + multiplierATR Basic Lower Band = (High+Low)/2 - multiplierATR Final bands carry forward per standard Supertrend recursive rules (final upper/lower band only moves toward price, not away). Trend flips bullish when Close crosses above the final upper band (which then becomes the active Supertrend line). Bollinger Bands(20, 2): Middle Band = 20-period SMA of Close. Upper Band = Middle + 2 × (20-period rolling std dev of Close). "Crosses above" = previous close ≤ previous upper band, AND current close > current upper band. RSI(14): Standard Wilder's smoothing RSI, 14-period. Condition: current RSI value > 60. "Crosses above" logic for Supertrend and BB (must use previous vs. current candle, not just current-candle-above): crossed_up = (prev_close <= prev_reference_line) and (curr_close > curr_reference_line) Screening Logic For each underlying (all F&O stocks + Nifty + Bank Nifty + Sensex): Fetch/update latest candles for the selected timeframe. Compute Supertrend(10,3), Bollinger Bands(20,2), RSI(14). Check all 3 conditions on the most recently closed candle (avoid using an incomplete forming candle unless I explicitly enable a "live/unconfirmed candle" mode). If all 3 conditions are true → mark underlying as a "hit." For each hit, pull that underlying's current option chain, and list: ATM CE and PE symbols (and N strikes OTM/ITM either side — configurable, default ATM only). Nearest weekly/monthly expiry (configurable which). LTP, bid/ask spread, OI, IV if available from the data source. UI Requirements Main dashboard: a live-updating table of all "hits" — columns: Underlying, Timeframe, Last Close, Supertrend value, Upper BB value, RSI value, Trigger time, Suggested CE symbol + LTP, Suggested PE symbol + LTP. Filters: dropdown to scope to Stocks only / Indices only / All; timeframe selector (5m/15m/1h/1D); strike-offset selector for options. Status bar: last scan time, next scan countdown, market open/closed indicator, data source connection status. Detail view: click a row to open a candlestick chart (mplfinance or lightweight-charts embedded) showing price, Supertrend line, Bollinger Bands, and RSI subplot, with the trigger candle highlighted. Alerts: optional Windows toast notification + sound when a new hit appears during market hours. History tab: table of all past hits (from the SQLite log), filterable by date, exportable to CSV/Excel. Settings panel: API keys/tokens for chosen data source, scan interval, timeframe, strike offset, alert toggle — all persisted locally (encrypted if storing broker tokens). Non-Functional Requirements Must run scans only during NSE market hours by default (9:15 AM–3:30 PM IST), with a manual "scan now" override button for testing outside market hours using last available data. Should handle F&O stock list changes gracefully (re-fetch the official list periodically rather than hardcoding). Should degrade gracefully if the data source rate-limits or disconnects — show a clear status indicator, retry with backoff, don't crash. Log errors to a local file for debugging. No cloud dependency required beyond the chosen market-data source — app should work as a standalone local tool. Deliverables Full Python source code, organized as: data/ — data source adapters (interchangeable). indicators/ — Supertrend, Bollinger Bands, RSI calculations (unit-testable, pure functions). screener/ — scan orchestration logic. ui/ — PyQt6 views. storage/ — SQLite models for scan history. requirements.txt and a build script (build.bat or PyInstaller .spec file) to produce a distributable .exe. A short README covering: how to configure the data source API keys, how to run in dev mode, how to build the .exe, and known limitations of the chosen data source. I want to make sure I build the right thing for you. One important note up front: this environment builds web applications (they run in the browser and are hosted on Puter), not native Windows Python/PyQt6 .exe desktop apps. I can build you a fully-featured web-based version of this exact F&O strategy screener — same strategy logic (Supertrend/BB/RSI), same hit table, charts, history, alerts, and settings — but as a polished web app rather than a packaged .exe. Before I start, I need one or two quick decisions: Got it — building with: A native Windows .exe isn't possible here, but I can build the same screener as a polished web app. Is that okay? Yes, build the web version Which market-data source should the screener use for candles + option chain? Zerodha Kite Connect Default candle timeframe for scans? 5-minute


Comments (0)
Sign in to leave a comment
Architecture
No Services Diagrams Yet
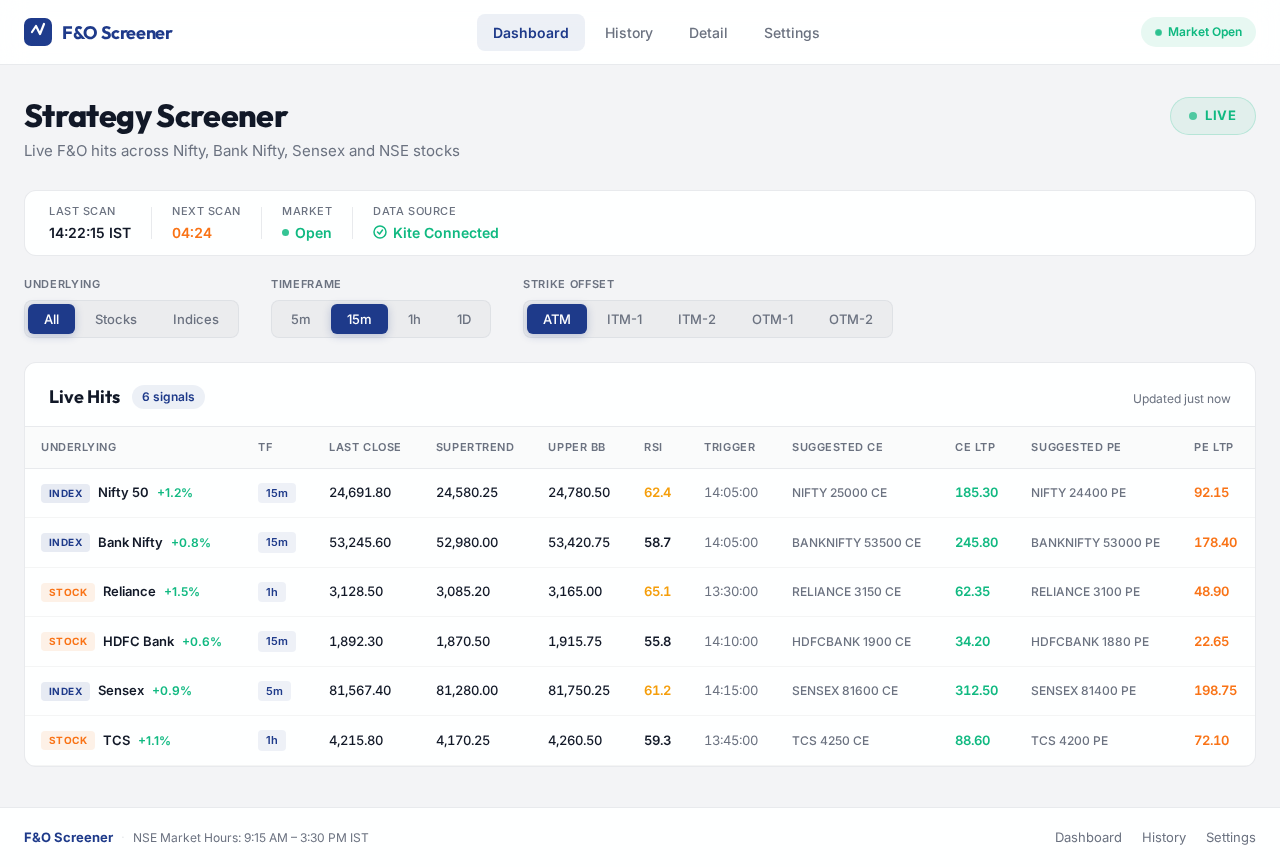
Strategy Screener
Live F&O hits across Nifty, Bank Nifty, Sensex and NSE stocks
Live Hits
6 signals| Underlying | TF | Last Close | Supertrend | Upper BB | RSI | Trigger | Suggested CE | CE LTP | Suggested PE | PE LTP |
|---|---|---|---|---|---|---|---|---|---|---|
| 15m | 24,691.80 | 24,580.25 | 24,780.50 | 62.4 | 14:05:00 | NIFTY 25000 CE | 185.30 | NIFTY 24400 PE | 92.15 | |
| 15m | 53,245.60 | 52,980.00 | 53,420.75 | 58.7 | 14:05:00 | BANKNIFTY 53500 CE | 245.80 | BANKNIFTY 53000 PE | 178.40 | |
| 1h | 3,128.50 | 3,085.20 | 3,165.00 | 65.1 | 13:30:00 | RELIANCE 3150 CE | 62.35 | RELIANCE 3100 PE | 48.90 | |
| 15m | 1,892.30 | 1,870.50 | 1,915.75 | 55.8 | 14:10:00 | HDFCBANK 1900 CE | 34.20 | HDFCBANK 1880 PE | 22.65 | |
| 5m | 81,567.40 | 81,280.00 | 81,750.25 | 61.2 | 14:15:00 | SENSEX 81600 CE | 312.50 | SENSEX 81400 PE | 198.75 | |
| 1h | 4,215.80 | 4,170.25 | 4,260.50 | 59.3 | 13:45:00 | TCS 4250 CE | 88.60 | TCS 4200 PE | 72.10 |
Strategy Screener
Live F&O hits across Nifty, Bank Nifty, Sensex and NSE stocks
Live Hits
6 signals| Underlying | TF | Last Close | Supertrend | Upper BB | RSI | Trigger | Suggested CE | CE LTP | Suggested PE | PE LTP |
|---|---|---|---|---|---|---|---|---|---|---|
| 15m | 24,691.80 | 24,580.25 | 24,780.50 | 62.4 | 14:05:00 | NIFTY 25000 CE | 185.30 | NIFTY 24400 PE | 92.15 | |
| 15m | 53,245.60 | 52,980.00 | 53,420.75 | 58.7 | 14:05:00 | BANKNIFTY 53500 CE | 245.80 | BANKNIFTY 53000 PE | 178.40 | |
| 1h | 3,128.50 | 3,085.20 | 3,165.00 | 65.1 | 13:30:00 | RELIANCE 3150 CE | 62.35 | RELIANCE 3100 PE | 48.90 | |
| 15m | 1,892.30 | 1,870.50 | 1,915.75 | 55.8 | 14:10:00 | HDFCBANK 1900 CE | 34.20 | HDFCBANK 1880 PE | 22.65 | |
| 5m | 81,567.40 | 81,280.00 | 81,750.25 | 61.2 | 14:15:00 | SENSEX 81600 CE | 312.50 | SENSEX 81400 PE | 198.75 | |
| 1h | 4,215.80 | 4,170.25 | 4,260.50 | 59.3 | 13:45:00 | TCS 4250 CE | 88.60 | TCS 4200 PE | 72.10 |
No comments yet. Be the first!