wise-monitoring
 Devops Ninegravity
You are a senior full-stack engineer specializing in Python backend systems and DevOps tooling. Build a production-ready monitoring system in Python using **FastAPI** that covers five core monitoring domains: 1. **Website/Uptime Monitoring** — HTTP checks, response time measurement, status code validation, and downtime detection. 2. **Database Storage Monitoring** — Track disk usage, collection/table sizes, document/row counts, and storage growth trends; alert when thresholds are exceeded. 3. **Database Outage Detection** — Probe database connectivity and query health; detect and report connection failures, timeouts, and replication issues. 4. **Server Monitoring & Utilization** — Collect CPU, memory, disk I/O, and network metrics via `psutil`; alert when utilization exceeds defined thresholds. ## Target Databases The system must support monitoring for all of the following databases: - **MongoDB** — use `motor` (async) for connectivity checks, storage metrics, collection sizes, document counts, and replica set health. - **PostgreSQL** — use `asyncpg` for connectivity checks, table sizes, row counts, and replication lag. - **MySQL / MariaDB** — use `aiomysql` for connectivity checks, table sizes, and query health. - **Redis** — use `aioredis` for connectivity checks, memory usage, key counts, and eviction metrics. Each database monitor must be implemented as a standalone module so new database types can be added without modifying existing monitors. ## Technical Stack & Requirements - **Framework:** FastAPI (Python) - **Persistence:** Store all check results, historical metrics, and alert logs in MongoDB — design schemas to support trend queries over time - **Scheduler:** Use `APScheduler` or `asyncio`-based polling for interval-driven checks; all checks must run asynchronously and never block each other - **Error isolation:** Failures in one monitor must never crash the system — implement per-monitor error handling, graceful retries, and structured logging - **Configuration:** Externalize all settings (URLs, connection strings, thresholds, polling intervals) into a `.env` file and `config.py` using `pydantic-settings` ## System Components Build the following as distinct, cleanly separated modules: - **`monitors/`** — Individual monitor implementations (`website`, `mongodb`, `postgresql`, `mysql`, `redis`, `server`) - **`scheduler/`** — Orchestrates all polling intervals and dispatches monitor runs - **`storage/`** — Data access layer for persisting and querying check results and metrics - **`alerting/`** — Threshold evaluation and notification dispatch (log-based + webhook stub) - **`api/`** — FastAPI routers exposing endpoints to: register monitors, retrieve current status, fetch historical metrics, and acknowledge alerts - **`dashboard/`** — A simple HTML/JS status dashboard served by FastAPI showing live monitor states ## Code Quality Standards - Production-level error handling and structured logging throughout (`loguru` or Python `logging`) - Clear docstrings and inline comments explaining each module's responsibility - Pydantic models for all request/response schemas and internal data structures - Basic unit tests for monitor logic using `pytest` and `pytest-asyncio` ## Deliverables Provide the complete project structure, all source files with full working code, a `requirements.txt`, a `.env.example` config file, and setup/run instructions. The system must be runnable locally with `uvicorn`, a running MongoDB instance, and optionally connected target databases.
Comments (0)
Sign in to leave a comment
Project Tasks19
Implement Theme Color System
As a Frontend Developer, I want to implement a centralized theme and color system from the mock-design pages so that all UI components share a consistent visual language across the application.
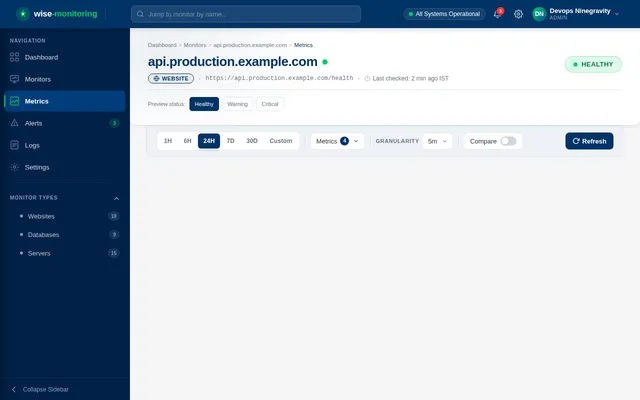
Build Metrics Page
As a DevOps professional, I want the Metrics page implemented from the existing JSX design so that I can inspect historical check results and filter data by custom time ranges.
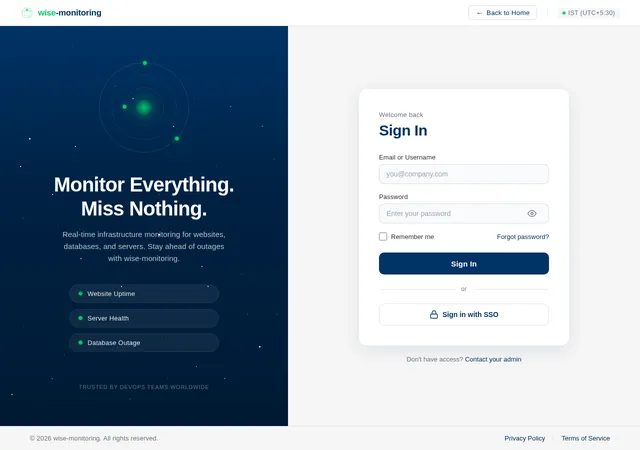
Build Login Page
As a DevOps professional, I want a Login page implemented from the existing JSX design so that I can securely authenticate and access the monitoring platform.
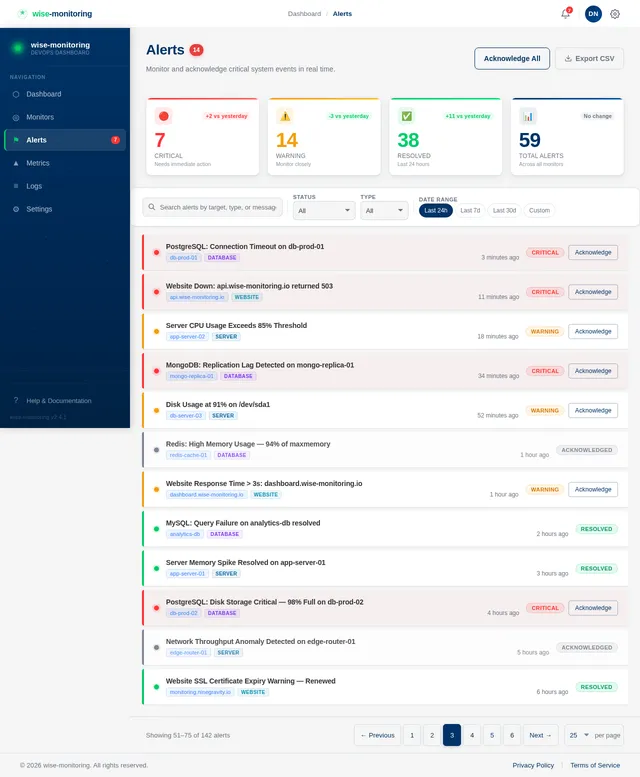
Build Alerts Page
As an admin, I want the Alerts page implemented from the existing JSX design so that I can view active alerts and acknowledge them directly from the UI.
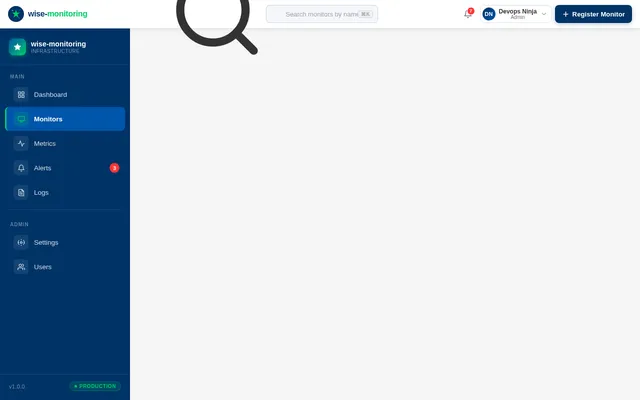
Build Monitors Page
As a DevOps professional, I want the Monitors page implemented from the existing JSX design so that I can register, view, and manage all website, database, and server monitors in one place.
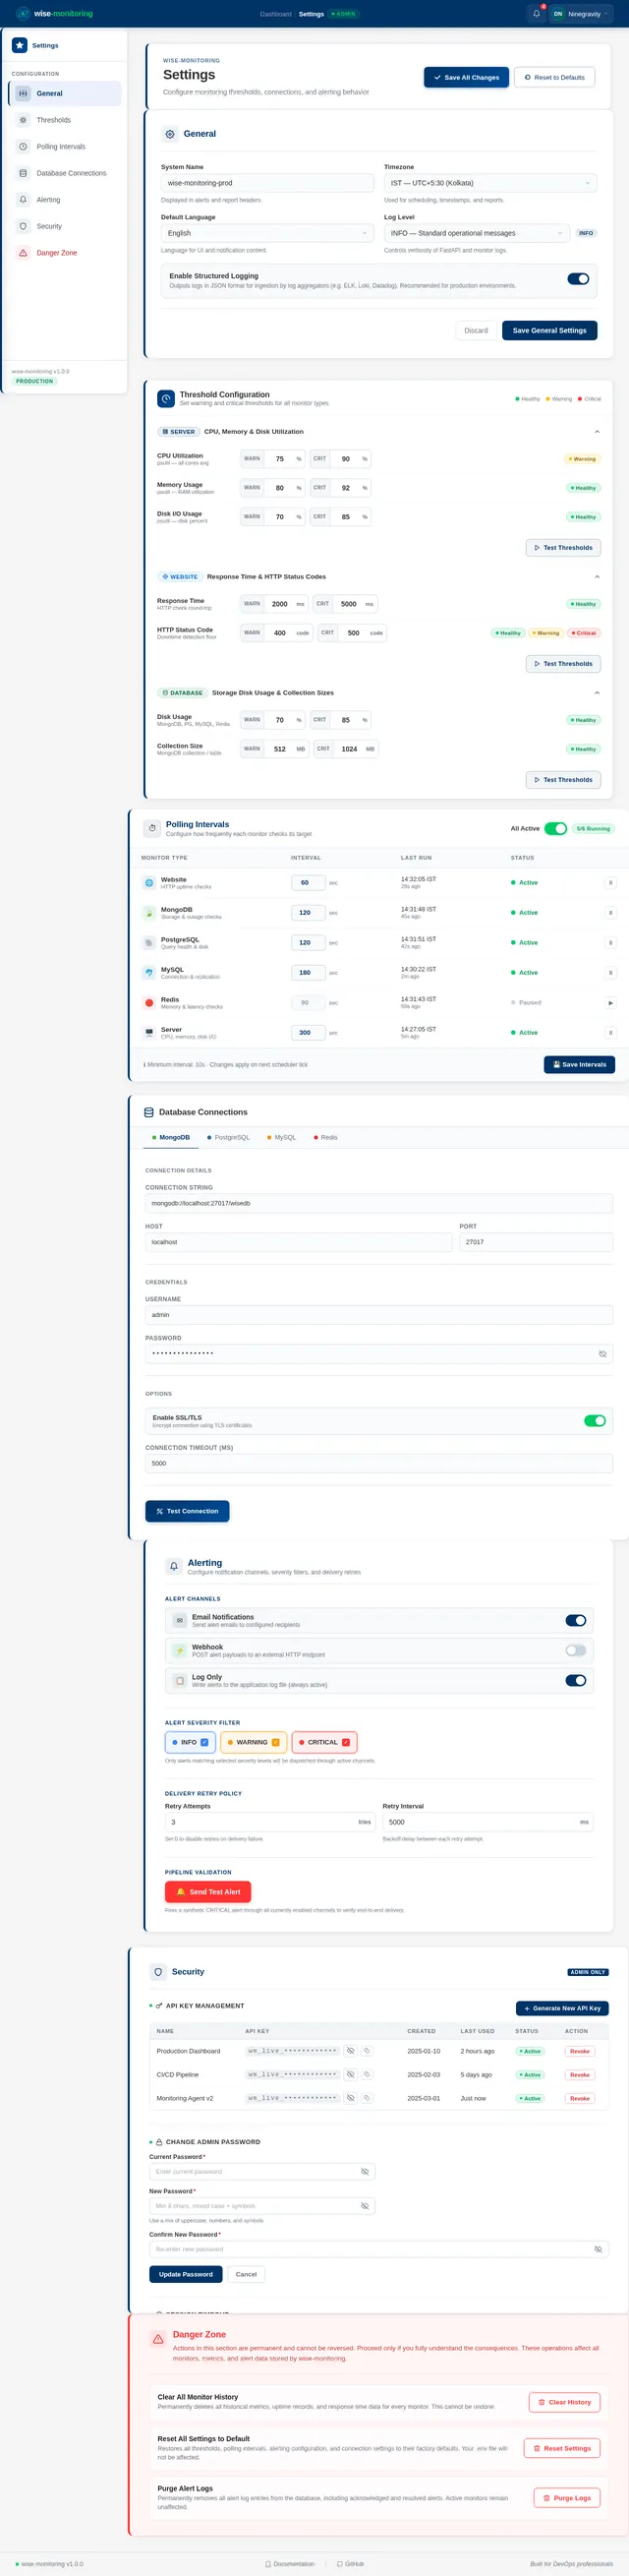
Build Settings Page
As an admin, I want the Settings page implemented from the existing JSX design so that I can configure thresholds, polling intervals, and database connection settings from the UI.
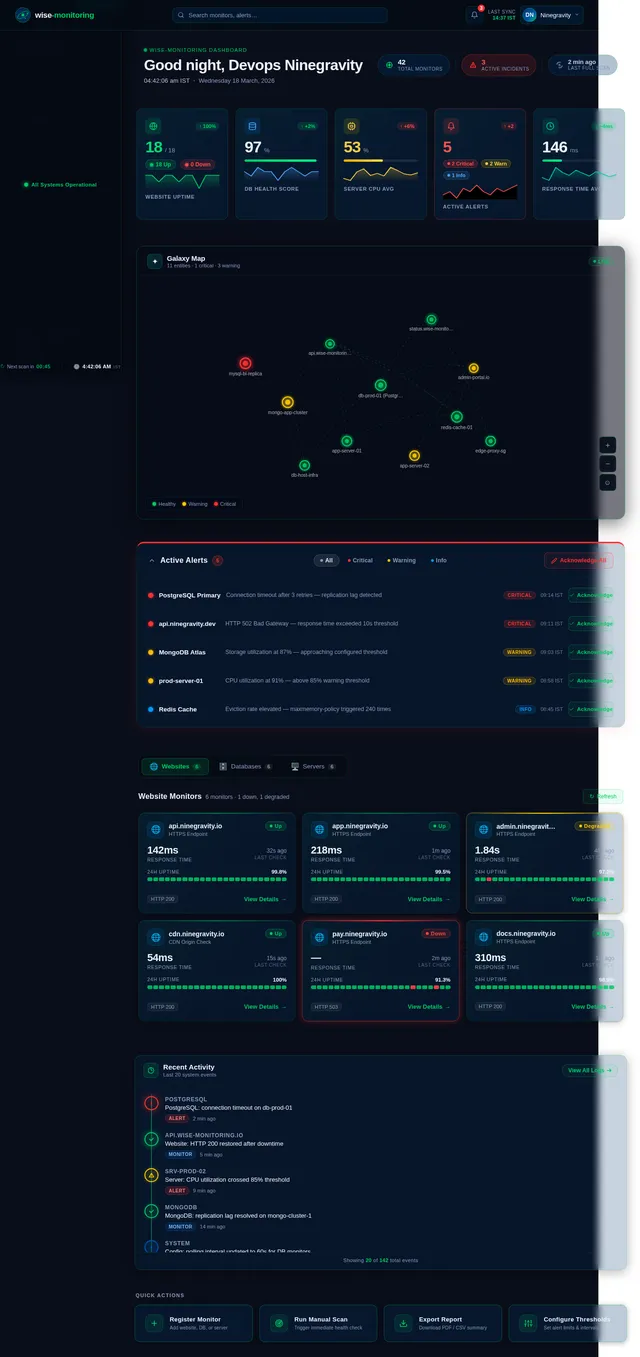
Build Dashboard Page
As a DevOps professional, I want the Dashboard page implemented with the Galaxy Map and Live Status views from the existing JSX design so that I can get an at-a-glance overview of all monitored systems, acknowledge alerts, and inspect individual monitors.
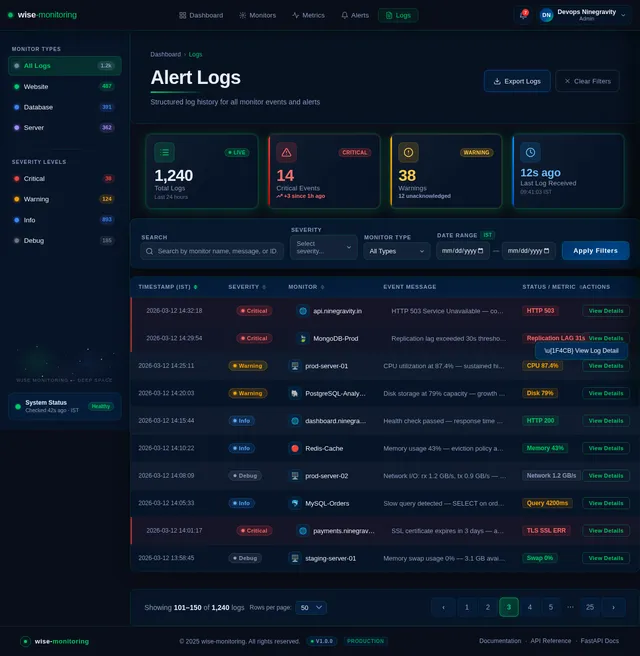
Build Logs Page
As an admin, I want the Logs page implemented from the existing JSX design so that I can review structured alert logs and filter them by severity, monitor, and time range for incident analysis.
Implement Monitors Registration API
As a Backend Developer, I want a Monitors Registration API so that the frontend can register, list, update, and delete website, database, and server monitor configurations stored in MongoDB.
Implement Settings Config API
As an admin, I want a Settings and Configuration API backed by pydantic-settings so that threshold values, polling intervals, and database connection settings configured in the Settings page are persisted and applied at runtime.
Implement Server Monitor Engine
As a Backend Developer, I want a Server Monitor Engine using psutil so that the system can asynchronously collect CPU, memory, disk I/O, and network utilization metrics from registered server targets.
Implement Website Monitor Engine
As a Backend Developer, I want a Website Monitor Engine so that the system can perform async HTTP/HTTPS checks, measure response time, validate status codes, and detect downtime for registered website monitors.
Implement Database Monitor Engine
As a Backend Developer, I want a Database Monitor Engine with standalone modules for MongoDB (motor), PostgreSQL (asyncpg), MySQL (aiomysql), and Redis (aioredis) so that the system can check connectivity, storage metrics, and query health for each database type.
Implement Scheduler Service
As a Backend Developer, I want an APScheduler-based Scheduler Service so that all website, database, and server monitor polling jobs run asynchronously at their configured intervals without blocking each other.
Implement Metrics Historical Data API
As a DevOps professional, I want a Metrics and Historical Data API so that all check results are stored as time-series records in MongoDB and can be queried with time-range and granularity filters to power the Metrics page charts.
Implement Real-Time Dashboard Updates
As a DevOps professional, I want real-time WebSocket or polling support integrated into the Dashboard so that the Galaxy Map and Live Status views reflect the latest monitor states without a manual page refresh.
Implement Alerts API
As an admin, I want an Alerts API so that the system evaluates metric thresholds, creates and persists alert records in MongoDB, and exposes CRUD plus an acknowledge endpoint consumed by the Alerts page.
Implement Logs API
As an admin, I want a Logs API so that structured alert and system logs are stored via loguru and can be retrieved with filtering by severity, monitor name, and time range to power the Logs page.
Implement Alerting Engine
As a Backend Developer, I want an Alerting Engine so that triggered threshold breaches dispatch notifications via webhook stubs and structured log outputs, ensuring admins are promptly notified of critical events.
No comments yet. Be the first!