wise-monitoring
 Devops Ninegravity
You are a senior full-stack engineer specializing in Python backend systems and DevOps tooling. Build a production-ready monitoring system in Python using **FastAPI** that covers five core monitoring domains: 1. **Website/Uptime Monitoring** — HTTP checks, response time measurement, status code validation, and downtime detection. 2. **Database Storage Monitoring** — Track disk usage, collection/table sizes, document/row counts, and storage growth trends; alert when thresholds are exceeded. 3. **Database Outage Detection** — Probe database connectivity and query health; detect and report connection failures, timeouts, and replication issues. 4. **Server Monitoring & Utilization** — Collect CPU, memory, disk I/O, and network metrics via `psutil`; alert when utilization exceeds defined thresholds. ## Target Databases The system must support monitoring for all of the following databases: - **MongoDB** — use `motor` (async) for connectivity checks, storage metrics, collection sizes, document counts, and replica set health. - **PostgreSQL** — use `asyncpg` for connectivity checks, table sizes, row counts, and replication lag. - **MySQL / MariaDB** — use `aiomysql` for connectivity checks, table sizes, and query health. - **Redis** — use `aioredis` for connectivity checks, memory usage, key counts, and eviction metrics. Each database monitor must be implemented as a standalone module so new database types can be added without modifying existing monitors. ## Technical Stack & Requirements - **Framework:** FastAPI (Python) - **Persistence:** Store all check results, historical metrics, and alert logs in MongoDB — design schemas to support trend queries over time - **Scheduler:** Use `APScheduler` or `asyncio`-based polling for interval-driven checks; all checks must run asynchronously and never block each other - **Error isolation:** Failures in one monitor must never crash the system — implement per-monitor error handling, graceful retries, and structured logging - **Configuration:** Externalize all settings (URLs, connection strings, thresholds, polling intervals) into a `.env` file and `config.py` using `pydantic-settings` ## System Components Build the following as distinct, cleanly separated modules: - **`monitors/`** — Individual monitor implementations (`website`, `mongodb`, `postgresql`, `mysql`, `redis`, `server`) - **`scheduler/`** — Orchestrates all polling intervals and dispatches monitor runs - **`storage/`** — Data access layer for persisting and querying check results and metrics - **`alerting/`** — Threshold evaluation and notification dispatch (log-based + webhook stub) - **`api/`** — FastAPI routers exposing endpoints to: register monitors, retrieve current status, fetch historical metrics, and acknowledge alerts - **`dashboard/`** — A simple HTML/JS status dashboard served by FastAPI showing live monitor states ## Code Quality Standards - Production-level error handling and structured logging throughout (`loguru` or Python `logging`) - Clear docstrings and inline comments explaining each module's responsibility - Pydantic models for all request/response schemas and internal data structures - Basic unit tests for monitor logic using `pytest` and `pytest-asyncio` ## Deliverables Provide the complete project structure, all source files with full working code, a `requirements.txt`, a `.env.example` config file, and setup/run instructions. The system must be runnable locally with `uvicorn`, a running MongoDB instance, and optionally connected target databases.

Comments (0)
Sign in to leave a comment
System Requirements
System Requirements Document (SRD)
Project Name: wise-monitoring
1. Introduction
The wise-monitoring system is a production-ready monitoring solution designed for DevOps professionals like Devops Ninegravity in India. It leverages Python and FastAPI to provide comprehensive monitoring across websites, databases, and servers. The system is tailored to meet the needs of modern infrastructure, ensuring uptime, detecting outages, and tracking resource utilization. With a modular design and extensible architecture, wise-monitoring is built to scale and adapt to evolving requirements.
2. System Overview
The wise-monitoring system is a Python-based monitoring tool that provides real-time insights into critical infrastructure components. It supports asynchronous operations for high performance and reliability, ensuring that failures in one module do not impact the overall system. The system is designed to monitor:
- Website/Uptime Monitoring — HTTP checks, response time measurement, status code validation, and downtime detection.
- Database Storage Monitoring — Disk usage, collection/table sizes, document/row counts, and storage growth trends.
- Database Outage Detection — Connectivity checks, query health, connection failures, timeouts, and replication issues.
- Server Monitoring & Utilization — CPU, memory, disk I/O, and network metrics collection via
psutil.
The system supports monitoring for MongoDB, PostgreSQL, MySQL/MariaDB, and Redis databases, with each monitor implemented as a standalone module for extensibility.
3. Functional Requirements
- As a User, I should be able to monitor website uptime, response times, and status codes.
- As a User, I should be able to track database storage metrics, including disk usage, table sizes, and row/document counts.
- As a User, I should be able to detect database outages, including connectivity issues, query failures, and replication problems.
- As a User, I should be able to monitor server utilization metrics such as CPU, memory, disk I/O, and network usage.
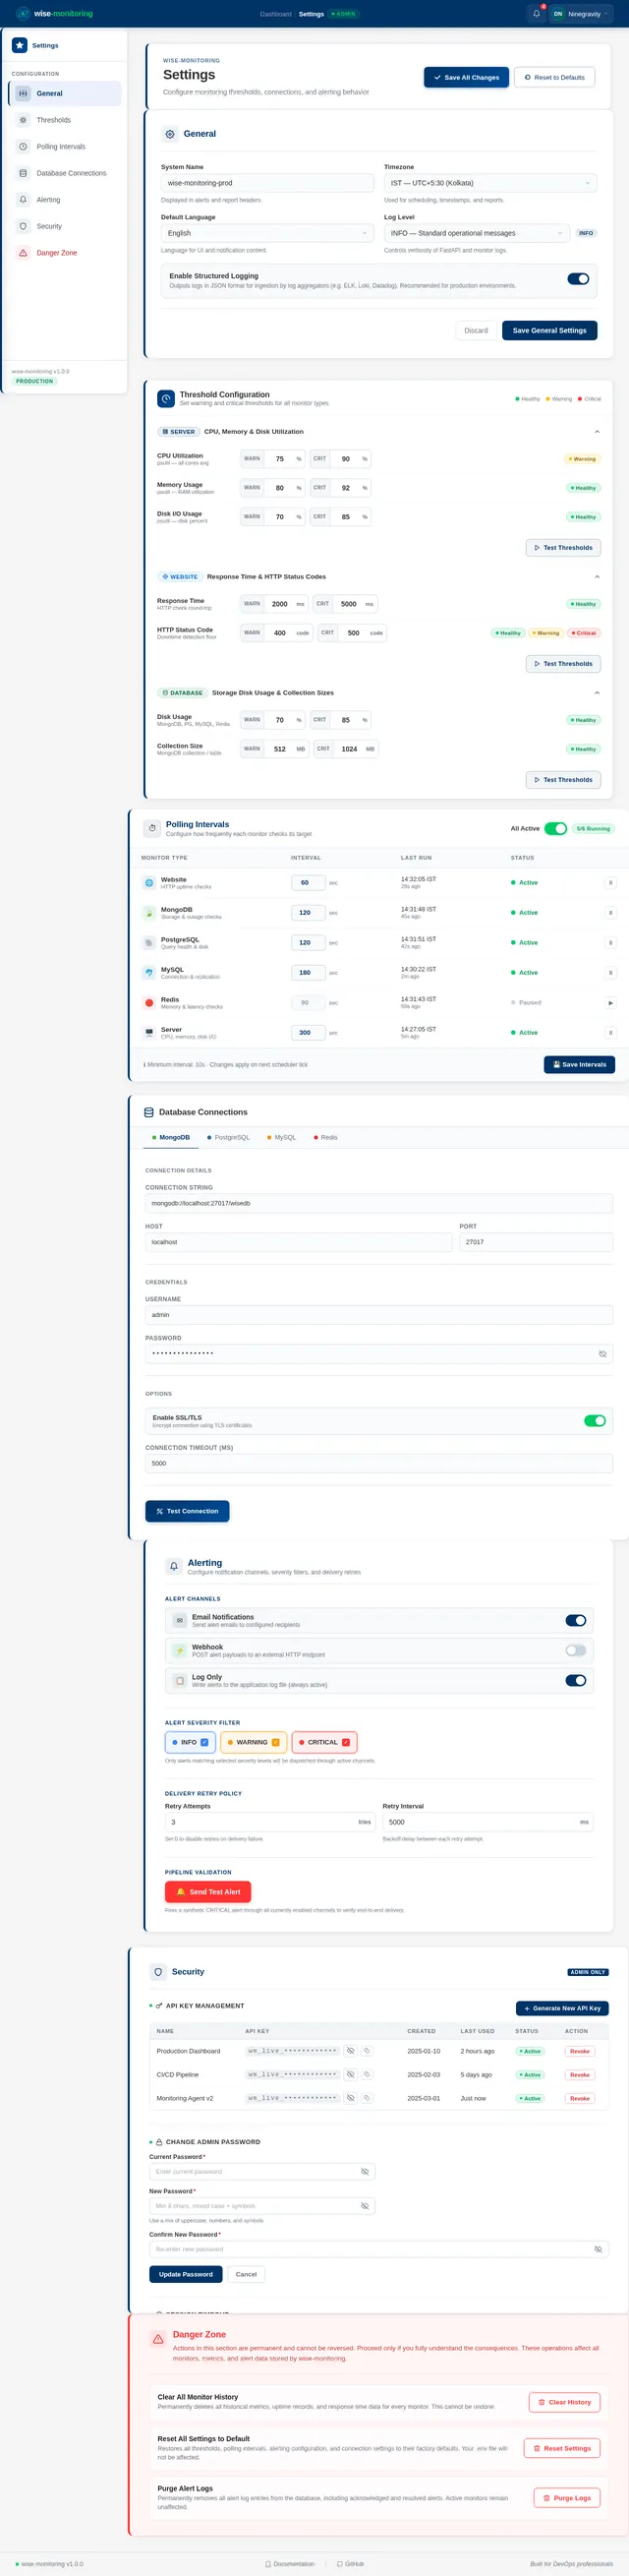
- As an Admin, I should be able to configure monitoring thresholds, polling intervals, and connection settings via a
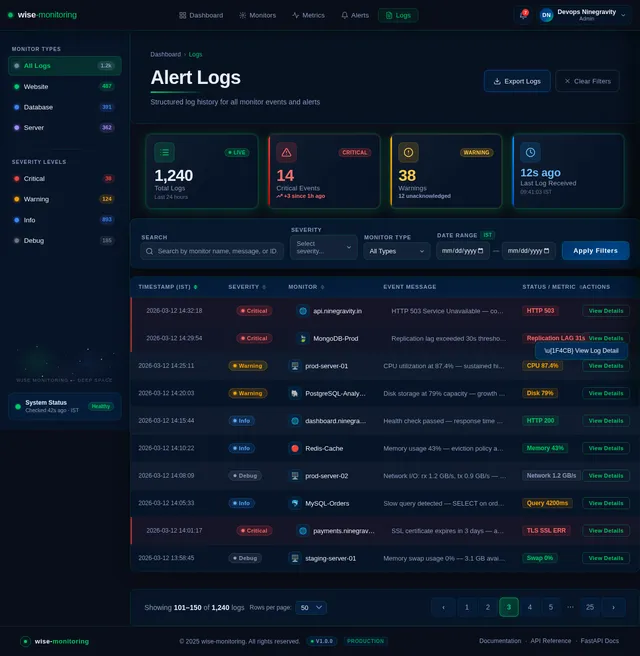
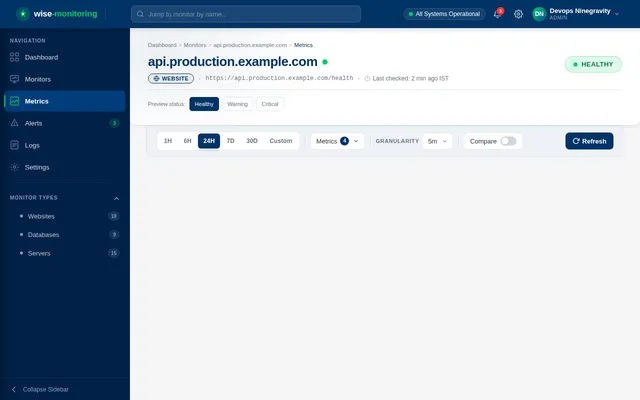
.envfile. - As an Admin, I should be able to view live monitor states and historical metrics via a dashboard.
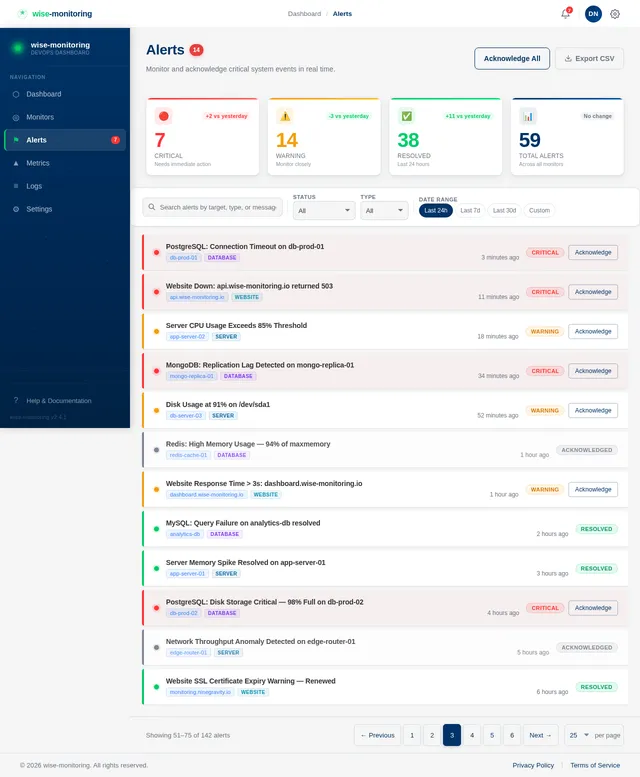
- As an Admin, I should be able to acknowledge alerts and retrieve logs via API endpoints.
4. User Personas
- Admin: Responsible for configuring monitoring thresholds, managing settings, and responding to alerts.
- User: Monitors infrastructure components and views live/historical metrics.
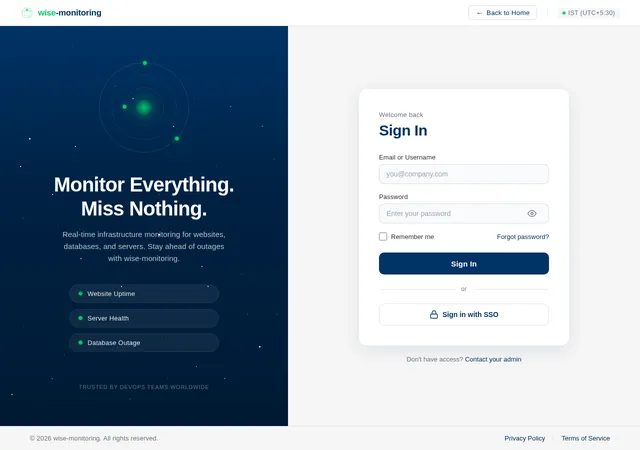
5. Visuals Colors and Theme
The wise-monitoring system will feature a clean and professional design with the following color scheme:
- Primary Color: Deep Blue (#003366) — Represents reliability and trust.
- Secondary Color: Bright Green (#00CC66) — Indicates active and healthy states.
- Alert Color: Bright Red (#FF3333) — Highlights critical issues and alerts.
- Background Color: Light Gray (#F5F5F5) — Provides a neutral backdrop for content.
- Text Color: Dark Gray (#333333) — Ensures readability.
The theme will emphasize clarity and usability, with intuitive navigation and responsive design for desktop and mobile devices.
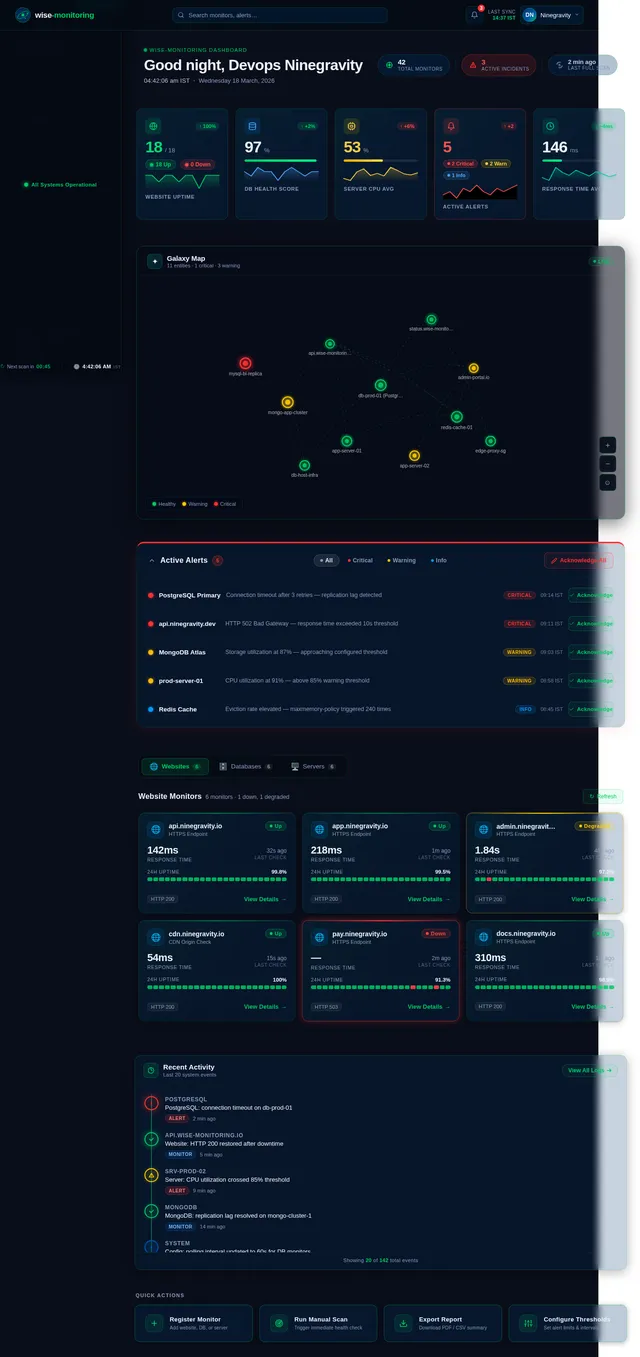
6. Signature Design Concept
Interactive Galaxy Dashboard
The homepage of wise-monitoring will feature an interactive galaxy map where each star represents a monitored entity (e.g., website, database, server). Users can hover over stars to view real-time metrics, click to expand detailed insights, and see connections between entities (e.g., database dependencies).
- Animations: Stars will pulse gently to indicate activity, and critical alerts will cause stars to flash red.
- Transitions: Smooth zooming and panning allow users to navigate the galaxy effortlessly.
- Color Shifts: Stars change color based on status (green for healthy, yellow for warning, red for critical).
- Micro-Interactions: Hovering over a star displays a tooltip with key metrics, and clicking opens a detailed view.
- Background: A dynamic, dark space-themed background with subtle twinkling stars adds depth and immersion.
This design will make the monitoring experience visually engaging and memorable, ensuring the system stands out in the competitive DevOps tooling space.
7. Non-Functional Requirements
- Performance: All monitoring checks must run asynchronously to ensure high throughput and minimal latency.
- Scalability: The system must support adding new database types without modifying existing monitors.
- Reliability: Failures in one monitor must not crash the system; implement error isolation and graceful retries.
- Security: Sensitive configuration data must be stored securely in a
.envfile and accessed viapydantic-settings. - Usability: The dashboard must be intuitive and responsive, providing clear insights into monitored entities.
8. Tech Stack
- Frontend: React for the dashboard (optional for future enhancements).
- Backend: Python with FastAPI.
- Database: MongoDB for persistence (using schemas for trend queries).
- Scheduler: APScheduler or asyncio-based polling for interval-driven checks.
- Monitoring Libraries:
motorfor MongoDB.asyncpgfor PostgreSQL.aiomysqlfor MySQL/MariaDB.aioredisfor Redis.psutilfor server metrics.
- Logging:
loguruor Pythonloggingfor structured logging. - Testing:
pytestandpytest-asynciofor unit tests. - Containerization: Docker and docker-compose for local orchestration.
- Server Orchestration: Kubernetes for deployment.
9. Assumptions and Constraints
- The system will be deployed in an Indian timezone (IST, UTC+5:30).
- MongoDB will be used for persistence, with schemas designed for trend queries.
- External settings will be managed via a
.envfile for flexibility. - The initial alerting module will include webhook stubs; integration with notification services may be added later.
- The dashboard will initially focus on live status and basic metrics; advanced visualizations may be added in future iterations.
10. Glossary
- FastAPI: A modern, fast web framework for building APIs with Python.
- APScheduler: A Python library for scheduling jobs.
- psutil: A Python library for retrieving information on system utilization.
- MongoDB: A NoSQL database used for storing monitoring data.
- Docker: A platform for containerization.
- Kubernetes: A system for automating deployment, scaling, and management of containerized applications.
This document provides a comprehensive blueprint for the wise-monitoring system, ensuring clarity and alignment with the user's requirements.
No comments yet. Be the first!