wild-dashboard
 Charles “Charlie” Touchet
I need to build a dashboard for anylitics and live monitoring of my system's and other types of devices connected to my accounts
Comments (0)
Sign in to leave a comment
System Requirements
System Requirements Document (SRD) for Wild-Dashboard
1. Introduction
The Wild-Dashboard project is a comprehensive platform designed to provide analytics and live monitoring for systems and various devices connected to user accounts. This document outlines the requirements for the development of the Wild-Dashboard, ensuring it meets the needs of its users effectively. The platform will cater to users in the United States, with locale-specific defaults such as US time zones, currency (USD), and measurement units.
This document serves as the foundation for the design, development, and deployment of the Wild-Dashboard, ensuring alignment with the vision and goals of Charles Touchet.
2. System Overview
The Wild-Dashboard will function as a centralized hub for users to monitor and analyze data from their systems and connected devices in real-time. The platform will provide intuitive visualizations, actionable insights, and seamless integration with various devices and accounts. The system will be accessible via web and mobile applications, ensuring users can stay informed and in control, regardless of their location.
Key features include:
- Real-time data monitoring and visualization.
- Advanced analytics for actionable insights.
- Device management and integration.
- User-friendly interface with customizable dashboards.
3. Functional Requirements
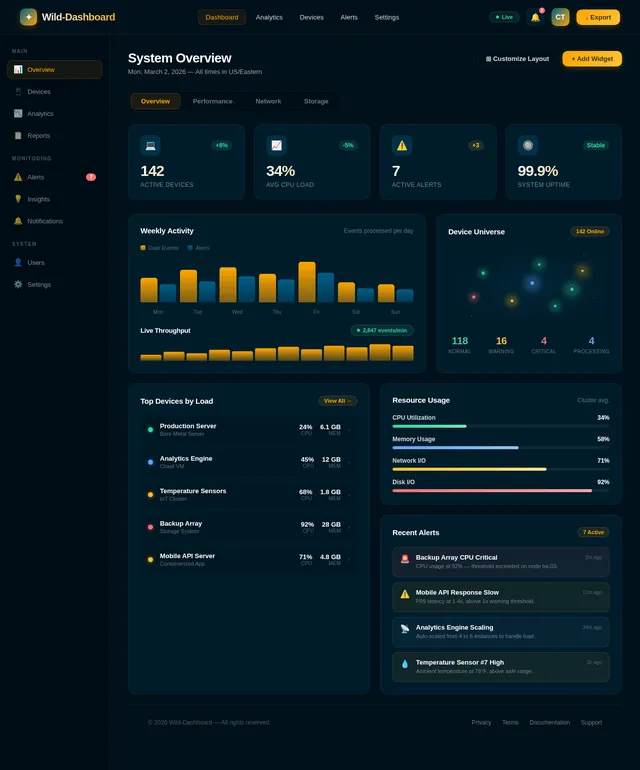
- As a User, I should be able to view real-time analytics of my connected devices.
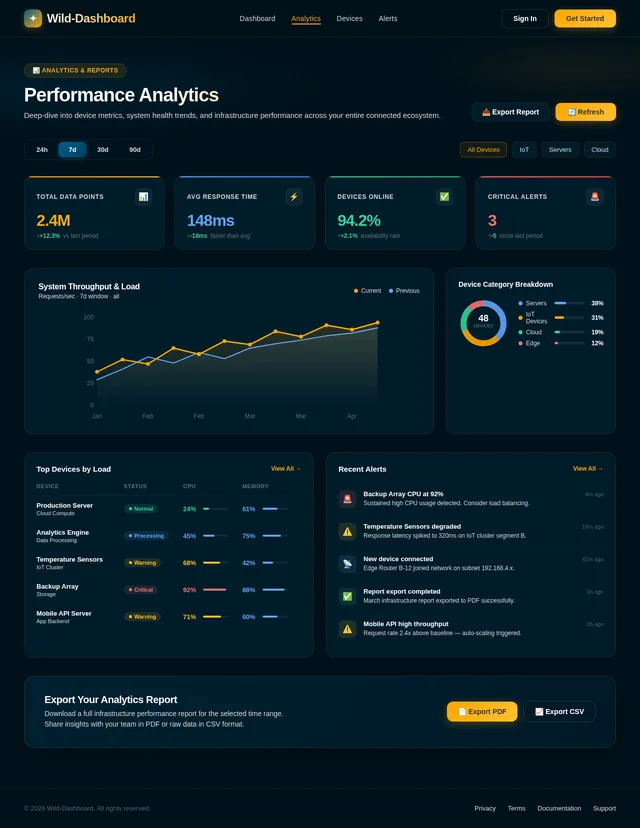
- As a User, I should be able to monitor live system performance metrics.
- As a User, I should be able to customize my dashboard layout and widgets.
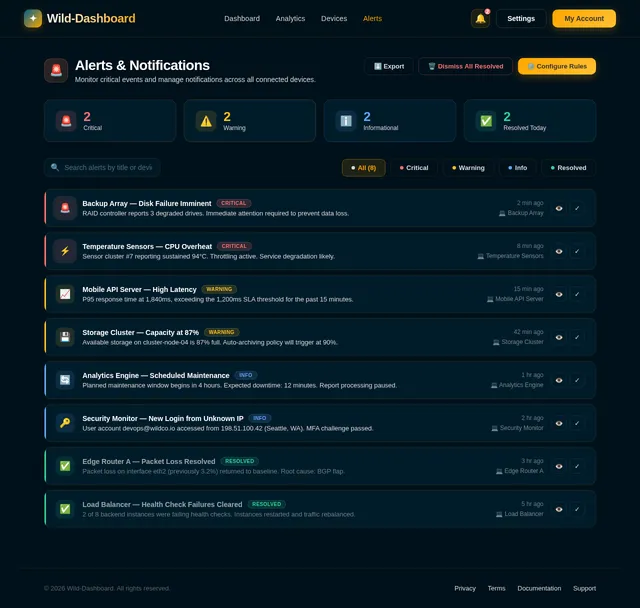
- As a User, I should be able to receive alerts and notifications for critical events.
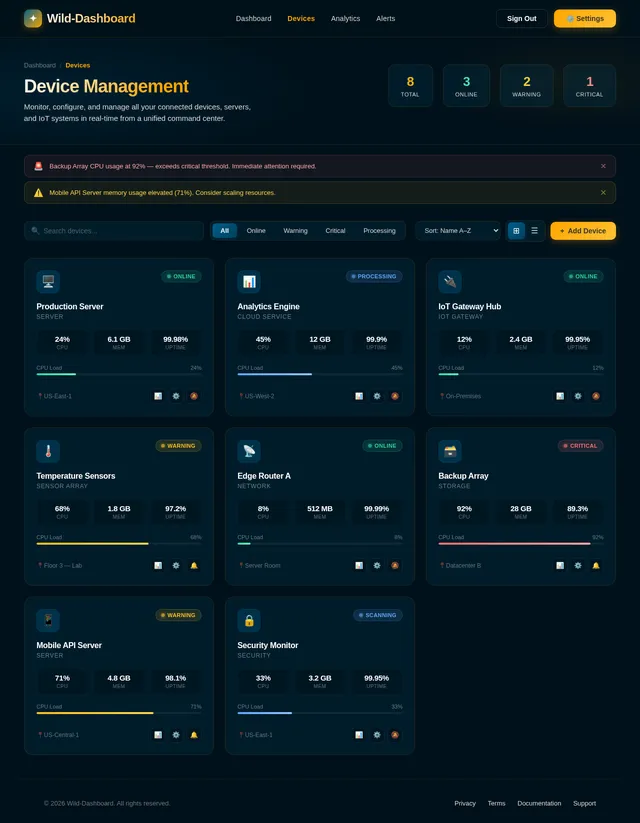
- As a User, I should be able to integrate and manage multiple devices across accounts.
- As a User, I should be able to export analytics reports in various formats (e.g., PDF, CSV).
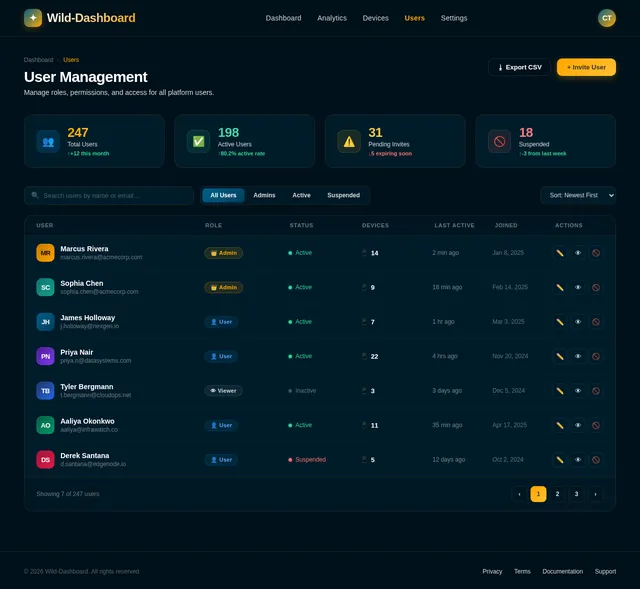
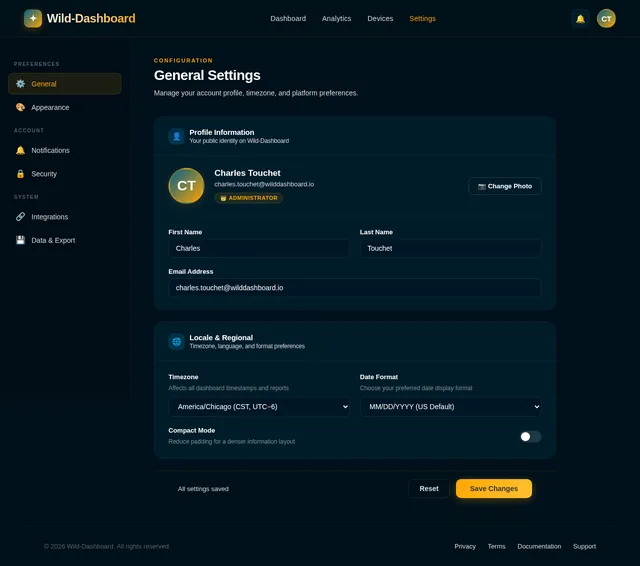
- As an Admin, I should be able to manage user roles and permissions.
- As an Admin, I should be able to configure system-wide settings and integrations.
4. User Personas
4.1 Regular User
- Description: Individuals or businesses using the dashboard to monitor their systems and devices.
- Goals: Access real-time data, analyze performance, and receive alerts.
- Technical Proficiency: Moderate to high.
4.2 Admin
- Description: Users with elevated privileges to manage system configurations and user roles.
- Goals: Ensure smooth operation of the platform and manage user access.
- Technical Proficiency: High.
5. Visuals Colors and Theme
The Wild-Dashboard will adopt a modern, professional, and visually appealing theme. The proposed color palette includes:
- Primary Color: Deep Blue (#003f5c) – Represents trust and professionalism.
- Secondary Color: Vibrant Orange (#ffa600) – Adds energy and highlights key elements.
- Accent Color: Light Gray (#d9d9d9) – For backgrounds and subtle contrasts.
- Text Color: White (#ffffff) and Dark Gray (#333333) – For readability.
The theme will emphasize clarity and usability, with a clean layout and responsive design for both web and mobile platforms.
6. Signature Design Concept
Interactive Data Universe Homepage
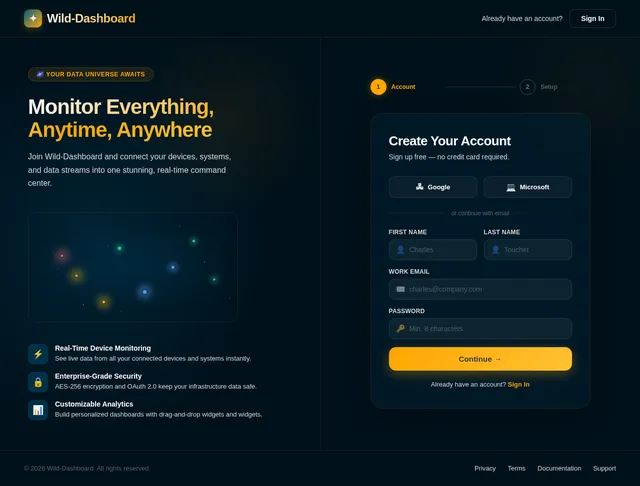
The Wild-Dashboard's homepage will feature an Interactive Data Universe. Upon landing, users will be greeted with a dynamic, 3D galaxy-like visualization where each "star" represents a connected device or system.
Key Features:
- Hover Interactions: Hovering over a star reveals a tooltip with the device/system name and key metrics.
- Zoom and Pan: Users can zoom in and pan around the galaxy to explore their devices.
- Color-Coded Stars: Stars will be color-coded based on device status (e.g., green for normal, yellow for warning, red for critical).
- Real-Time Animations: Stars will pulse or glow to indicate live data updates.
- Quick Actions: Clicking on a star opens a side panel with detailed analytics and management options for the selected device.
This immersive and visually stunning concept will make the Wild-Dashboard instantly memorable and engaging, setting it apart from traditional dashboards.
7. Non-Functional Requirements
- Performance: The system must support real-time data updates with minimal latency (<1 second).
- Scalability: The platform should handle up to 10,000 concurrent users without performance degradation.
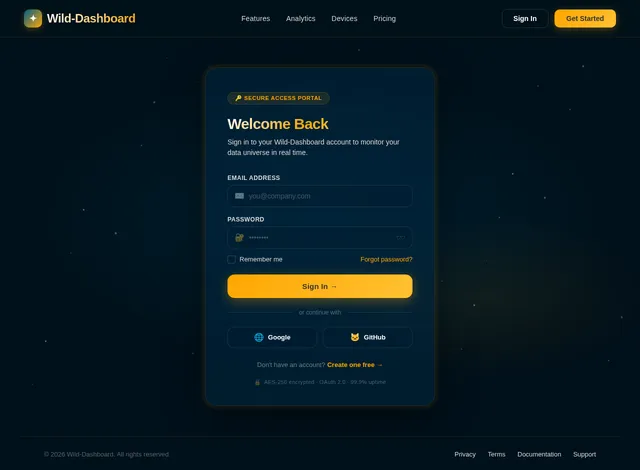
- Security: Ensure data encryption (AES-256) for all sensitive information and implement robust authentication mechanisms (OAuth 2.0).
- Availability: Maintain 99.9% uptime with failover mechanisms in place.
- Accessibility: Comply with WCAG 2.1 standards to ensure usability for all users.
8. Tech Stack
Frontend
- React for Web
- React Native for Mobile App
Backend
- Python
- FastAPI
Database
- MySQL (with Alembic for migrations)
AI Models
- GPT 5.2 for user-friendly responses
- Claude 4.5 Opas for coding and academic tasks
- Google Nano Banana for image generation
AI Tools
- Litellm for LLM Routing
- Langchain
Orchestration
- Docker and docker-compose for local orchestration
- Kubernetes for server-side orchestration
9. Assumptions and Constraints
- The platform will primarily target users in the US, with English as the default language.
- The system will support integration with commonly used devices and platforms (e.g., IoT devices, cloud services).
- Development will prioritize web and mobile platforms, with no immediate plans for desktop applications.
- The project must be completed within a 12-month timeline.
10. Glossary
- Dashboard: A user interface that provides a visual representation of data and analytics.
- IoT: Internet of Things, referring to interconnected devices that communicate over the internet.
- OAuth 2.0: An open standard for access delegation, commonly used for token-based authentication.
- WCAG: Web Content Accessibility Guidelines, a set of standards for making web content accessible to all users.
End of Document
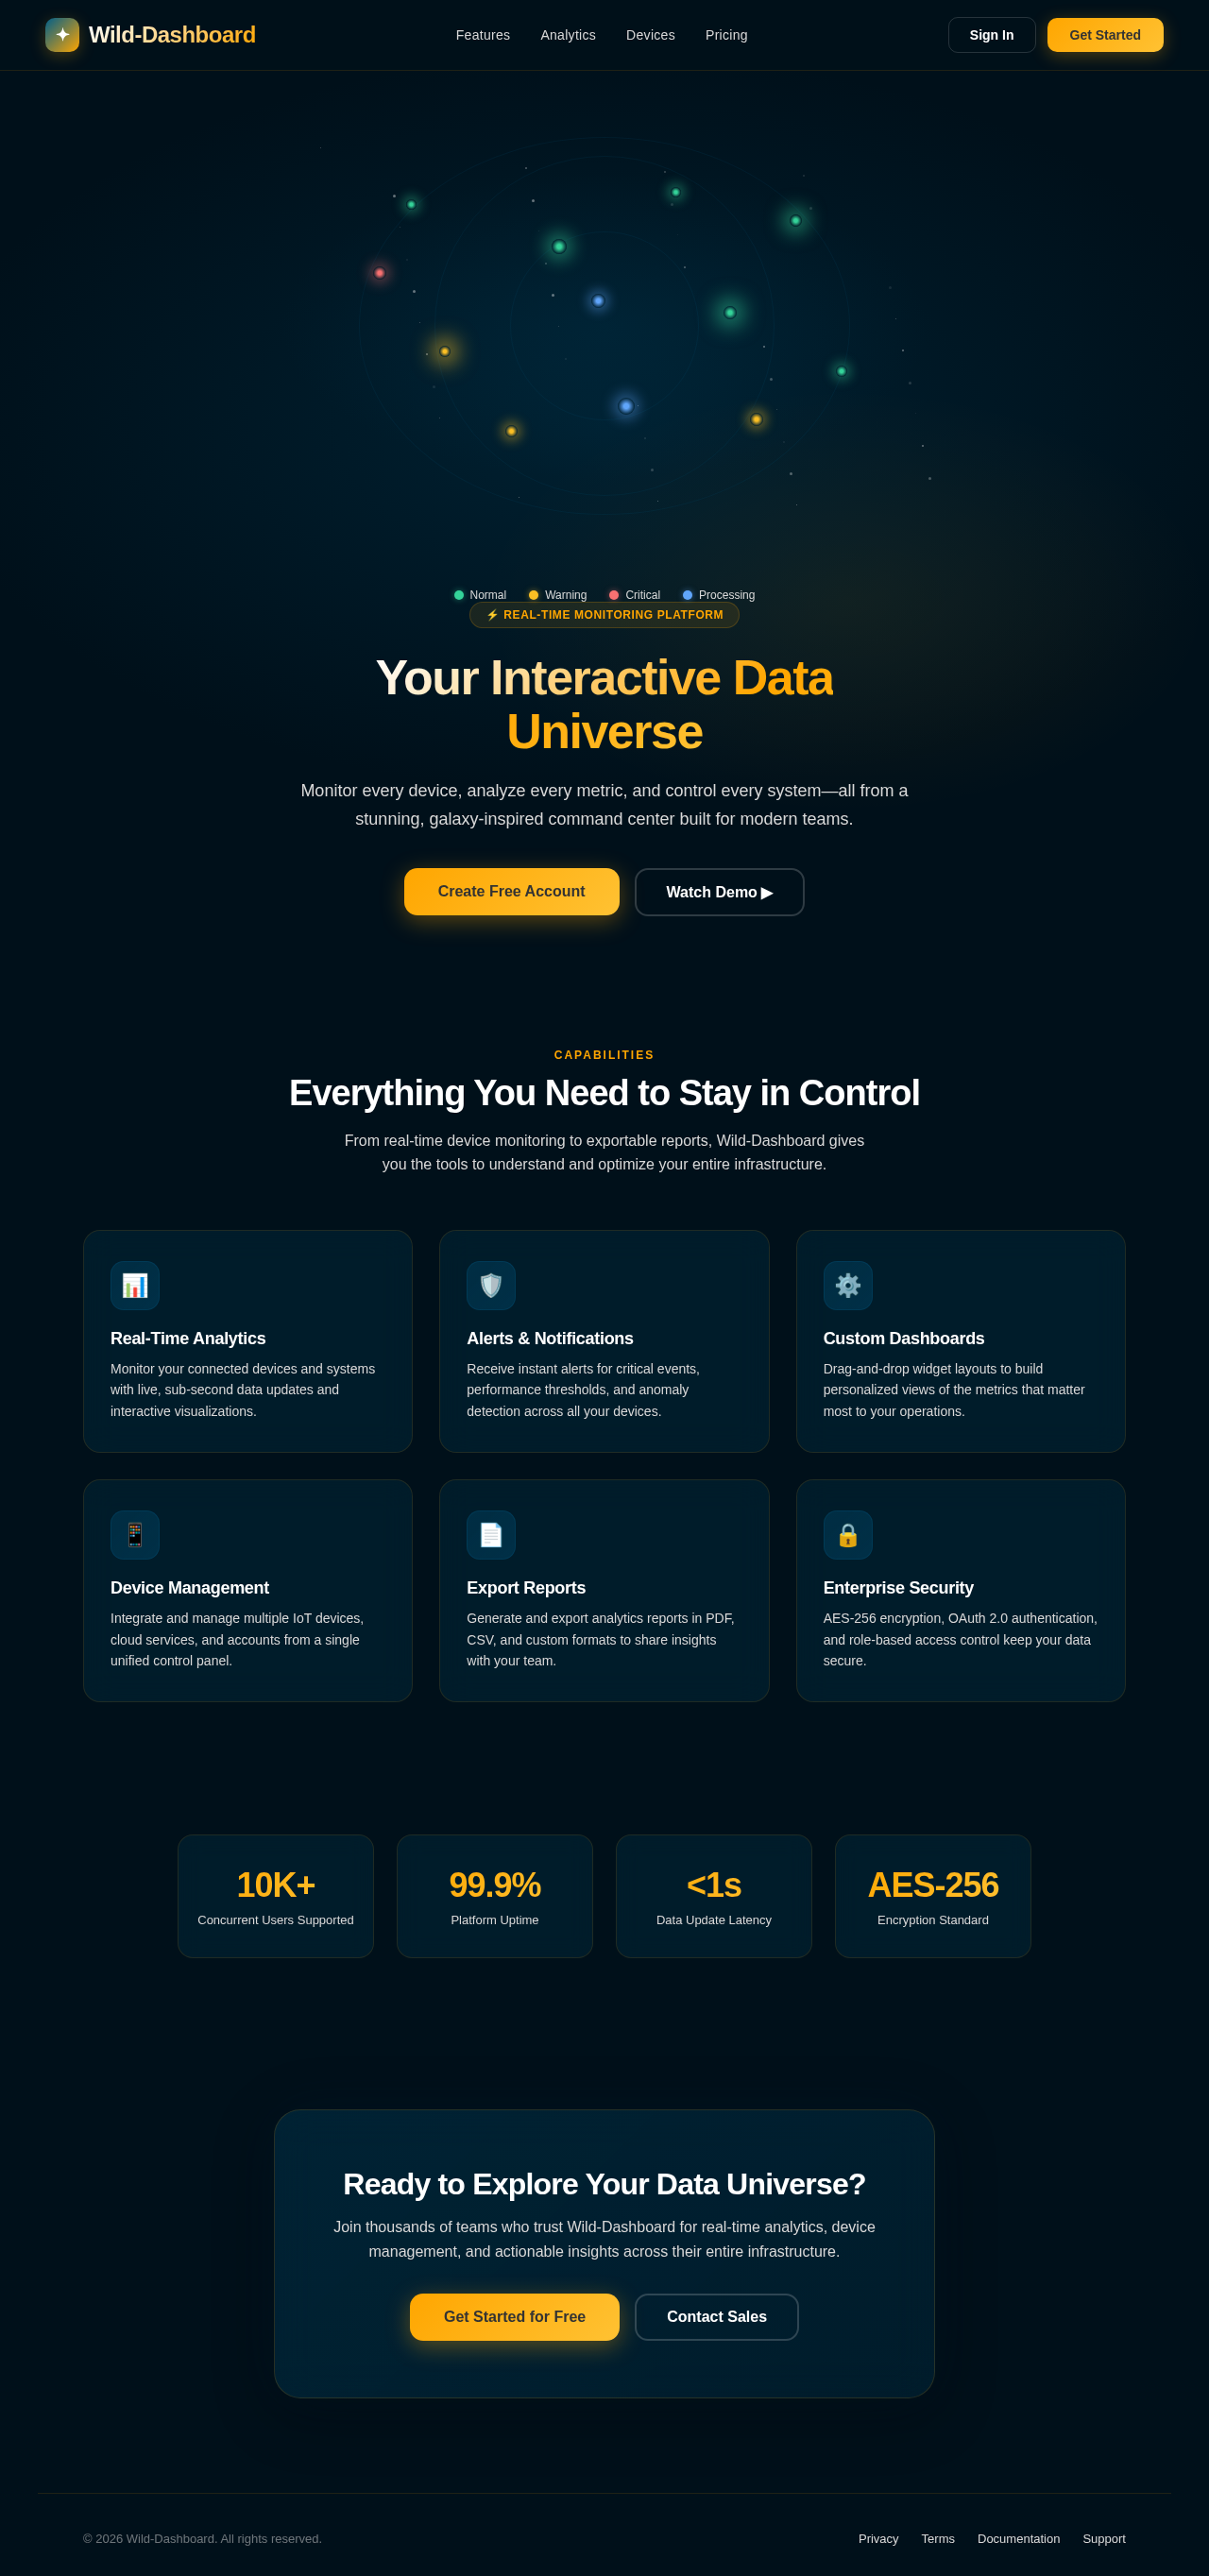
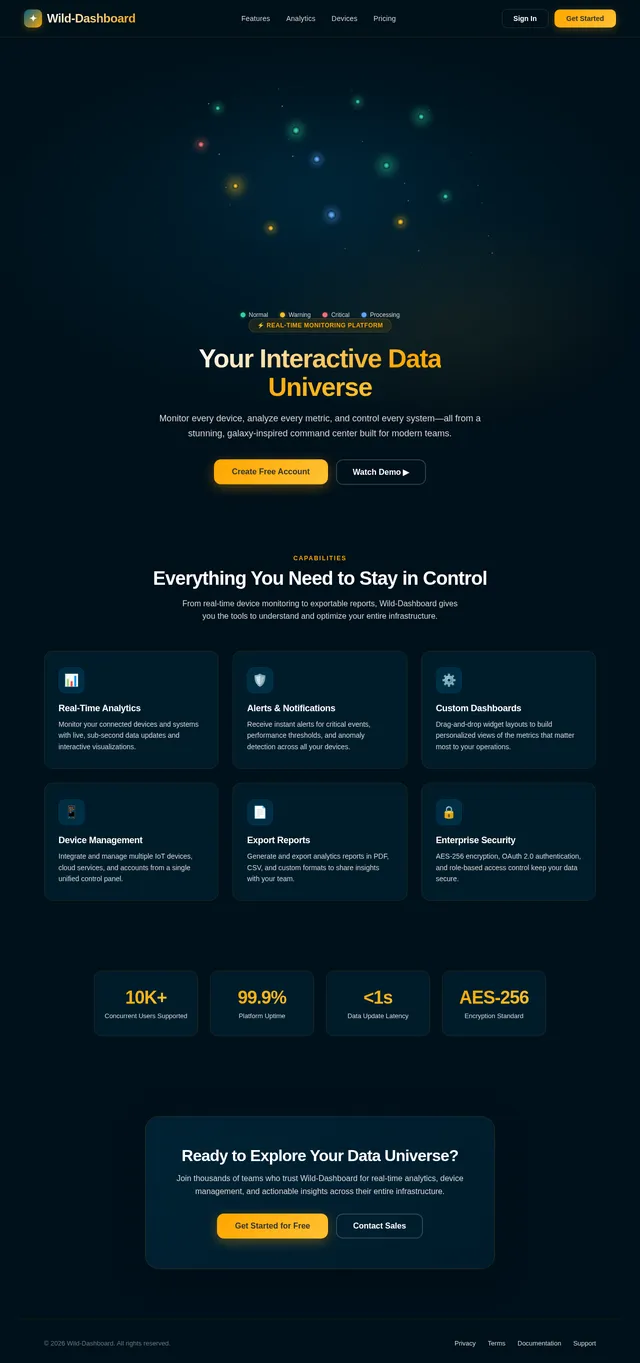
Your Interactive Data Universe
Monitor every device, analyze every metric, and control every system—all from a stunning, galaxy-inspired command center built for modern teams.
Everything You Need to Stay in Control
From real-time device monitoring to exportable reports, Wild-Dashboard gives you the tools to understand and optimize your entire infrastructure.
Real-Time Analytics
Monitor your connected devices and systems with live, sub-second data updates and interactive visualizations.
Alerts & Notifications
Receive instant alerts for critical events, performance thresholds, and anomaly detection across all your devices.
Custom Dashboards
Drag-and-drop widget layouts to build personalized views of the metrics that matter most to your operations.
Device Management
Integrate and manage multiple IoT devices, cloud services, and accounts from a single unified control panel.
Export Reports
Generate and export analytics reports in PDF, CSV, and custom formats to share insights with your team.
Enterprise Security
AES-256 encryption, OAuth 2.0 authentication, and role-based access control keep your data secure.
Ready to Explore Your Data Universe?
Join thousands of teams who trust Wild-Dashboard for real-time analytics, device management, and actionable insights across their entire infrastructure.
No comments yet. Be the first!