ruby-presentation
 Roaa Foqhaa
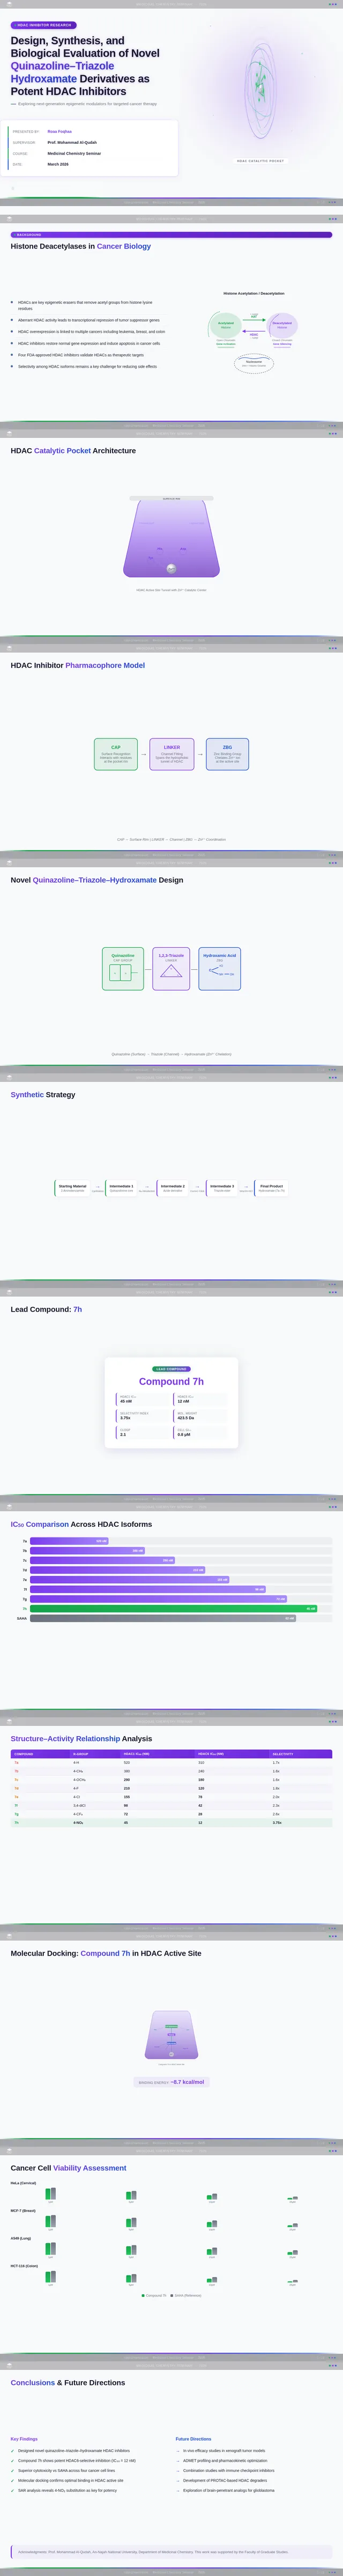
Create a clean academic PowerPoint presentation suitable for a medicinal chemistry seminar. Use minimal text, high-quality scientific diagrams, and a professional layout. General visual style: White or light-gray backgrounds, clear typography, and consistent use of colors (green, purple, and blue accents across slides). 🎓 Title Slide Design, Synthesis, and Biological Evaluation of Novel Quinazoline–Triazole Hydroxamate Derivatives as Potent HDAC Inhibitors Gamma design instructions: Title centered in large clear font. Below the title include: • Student names • University name • Course name • Professor name • Date Image placement: On the right side place a scientific visualization of an HDAC enzyme catalytic pocket with inhibitor binding. Ensure the Zn²⁺ ion appears as a silver metallic sphere inside the catalytic pocket. Background colors: Subtle scientific gradient using green, purple, and blue. --- 🟢 Slide 1 – Cancer Epigenetics & Therapeutic Rationale • Cancer progression involves both genetic mutations and epigenetic dysregulation. • Histone acetylation promotes transcriptional activation, while deacetylation induces gene repression. • Overexpression of several HDAC isoforms (HDAC1, 2, 3, 6, and 8) has been strongly associated with tumor progression. • Clinically approved hydroxamate-based inhibitors such as Vorinostat demonstrate potent activity but limited isoform selectivity and potential systemic toxicity. 🔎 Therefore, structural optimization of HDAC inhibitors remains a critical medicinal chemistry challenge. Gamma layout instructions: Divide the slide into two halves. Left side: Current text. Right side: Two scientific illustrations. Image 1: Histone acetylation vs deacetylation diagram showing open chromatin vs closed chromatin and gene expression. Image 2: Illustration showing HDAC overexpression leading to cancer progression. Below the images add a small visual: Chemical structure of Vorinostat. --- 🟢 Slide 2 – Structural Biology of HDAC Enzymes • HDACs are Zn²⁺-dependent metalloenzymes. • The catalytic Zn²⁺ ion is located at the base of a narrow hydrophobic channel. • A surface recognition pocket stabilizes ligand binding. • Effective inhibition requires precise Zn²⁺ chelation combined with optimal surface interactions. • HDAC1 was selected as the representative Class I isoform for computational docking studies. Gamma instructions: Large scientific diagram on the right: HDAC catalytic pocket with Zn²⁺ ion. Ensure the diagram clearly shows: • Zn²⁺ ion • catalytic tunnel • binding pocket Add arrows labeling: Zn²⁺ ion catalytic channel surface pocket. Text on the left. --- 🟢 Slide 3 – Classical HDAC Pharmacophore Model HDAC inhibitors share a conserved pharmacophore model: • Zinc Binding Group (ZBG) → coordinates catalytic Zn²⁺ • Hydrophobic linker → spans the catalytic tunnel • Cap group → interacts with surface residues This model guided the rational design of the new scaffold. Gamma instructions: Create a pharmacophore diagram showing: Cap group Linker Zinc Binding Group Color scheme: Cap group – blue Linker – gray ZBG – red Place diagram in the center of the slide. --- 🟢 Slide 4 – Lead Compound Identification & Medicinal Chemistry Rationale Design Rationale • Hydroxamate inhibitors show strong potency but suboptimal selectivity. • Structural refinement aimed to improve binding orientation, electronic balance, and isoform selectivity. Hybrid Lead Design A quinazoline–triazole–hydroxamate scaffold was selected. Functional Contributions • Hydroxamic acid (Zinc-Binding Functional Group) → bidentate Zn²⁺ chelation • Triazole → conformational rigidity & hydrogen bonding • Quinazoline → hydrophobic cap interaction & π–π stacking • Substituent tuning → steric and electronic optimization Gamma instructions: Display labeled chemical structure: quinazoline–triazole–hydroxamate scaffold. Add arrows pointing to: Hydroxamic acid Triazole Quinazoline Use standard atom colors: N blue O red C gray Ensure bromine (Br) at position 7 appears reddish-brown. Place structure in the center. --- 🟢 Slide 5 – Research Objective & Experimental Workflow Objective To design, synthesize, and biologically evaluate novel quinazoline–triazole hydroxamate derivatives as potent and selective HDAC inhibitors. Workflow • Rational scaffold design • Multi-step synthesis • Structural confirmation (¹H NMR, ¹³C NMR, HRMS) • HDAC inhibition assay (IC₅₀ determination) • Anticancer activity evaluation • Molecular docking for SAR validation Gamma instructions: Create a scientific workflow diagram: Design ↓ Synthesis ↓ Characterization ↓ HDAC assay ↓ Anticancer assay ↓ Docking study Add scientific icons for each step. --- 🟣 Slide 6 – Rational Drug Design Strategy • Hybridization of pharmacophoric fragments • Quinazoline (cap) + Triazole (linker) + Hydroxamic acid (ZBG) • Two linker series developed: – Series 7: N-hydroxybenzamides – Series 11: N-hydroxypropenamides • Systematic substitution at positions 6 and 7 of quinazoline core Gamma instructions: Create fragment-based drug design diagram. Show three fragments: Quinazoline structure Triazole structure Hydroxamic acid structure Arrows leading to hybrid molecule. --- 🟣 Slide 7 – Structural Mapping • Hydroxamic acid → Zn²⁺ chelation • Triazole → orientation control within the catalytic channel • Quinazoline → surface hydrophobic interaction and π–π stacking • Halogen or alkyl substituents → electronic and steric modulation Gamma instructions: Annotated chemical structure with arrows showing: Zn²⁺ chelation Catalytic channel orientation Cap interaction. --- 🟣 Slide 8 – Synthetic Overview • Quinazoline core formation via cyclization • Cu(I)-catalyzed azide–alkyne cycloaddition (“click chemistry”) • Final hydroxaminolysis to generate active hydroxamic acid ZBG • Target compounds 7a–i and 11a–i obtained and fully characterized Gamma instructions: Show synthetic reaction scheme: Step 1 – cyclization Step 2 – click chemistry Step 3 – hydroxaminolysis. --- 🟣 Slide 9 – SAR: Linker Optimization • Series 7 (benzamide) showed stronger HDAC inhibition. • The rigid benzamide linker allows optimal Zn²⁺ alignment within the catalytic tunnel. • Series 11 (propenamide) demonstrated slightly weaker enzymatic inhibition but notable antiproliferative effects. • Increased linker flexibility may reduce optimal Zn²⁺ coordination geometry. Gamma instructions: Create comparison table and bar chart: Series | Linker | HDAC activity Series 7 | Benzamide | Strong Series 11 | Propenamide | Moderate --- 🟣 Slide 10 – SAR: Substituent Effects • 7-Br substitution (Compound 7h) → IC₅₀ = 0.142 µM • 7-CH₃ substitution (Compound 7c) → IC₅₀ = 0.146 µM • 6-Cl derivatives (7d, 11d) showed strongest cytotoxicity • Halogen substitution enhanced hydrophobic pocket interaction Gamma instructions: Create SAR table and IC50 bar chart. Add diagram highlighting quinazoline substitution positions 6 and 7. --- 🔵 Slide 11 – Enzymatic Inhibition Results • Several compounds exhibited submicromolar HDAC inhibition. • Compound 7h exhibited the strongest enzymatic inhibition (IC₅₀ = 0.142 µM), demonstrating comparable and slightly improved potency relative to Vorinostat (IC₅₀ ≈ 0.160 µM) under identical assay conditions. • These findings confirm enhanced enzymatic inhibition within the optimized Series 7 derivatives. Gamma instructions: Create bar chart comparing IC50 values of compounds vs Vorinostat. Highlight compound 7h. --- 🔵 Slide 12 – Anticancer Activity • Compounds were evaluated against SW620 and MDA-MB-231 cancer cell lines. • Compound 7h exhibited the highest cytotoxic potency. • Compounds 7d and 11d induced G2/M cell cycle arrest. • Significant apoptosis induction was observed. • Favorable selectivity toward cancer cells over normal MRC-5 fibroblasts was confirmed. Gamma instructions: Create bar chart showing cell viability. Add small apoptosis microscopy illustration. --- 🔵 Slide 13 – Molecular Docking • Docking was performed against the HDAC1 isoform catalytic pocket. • Compound 7h demonstrated the most stable binding conformation with a docking score of –9.4 kcal/mol. • Vorinostat exhibited a docking score of –8.6 kcal/mol under identical computational conditions. • Hydroxamic acid formed strong bidentate coordination with Zn²⁺ (~2.0 Å). Gamma instructions: Show docking visualization inside HDAC1 catalytic pocket. Ensure image clearly shows: Zn²⁺ ion hydroxamate coordination binding pocket. Display coordination bonds (~2.0 Å) as yellow dashed lines. Add small table: Compound | Docking score 7h | −9.4 Vorinostat | −8.6 --- 🔵 Slide 14 – Functional Group–Docking Correlation • Docking score of compound 7h (–9.4 kcal/mol) correlates with its lower IC₅₀ value (0.142 µM). • This agreement validates the rational drug design strategy. • Enhanced Zn²⁺ chelation and hydrophobic stabilization explain improved inhibition. Gamma instructions: Create correlation scatter plot: Docking score vs IC50. Add interaction diagram showing: Zn²⁺ coordination hydrophobic interactions. --- 🔵 Slide 15 – Conclusion • A novel quinazoline–triazole–hydroxamate series was developed. • Several derivatives demonstrated superior activity compared with Vorinostat. • Compound 7h emerged as the lead candidate. Reasons: – Highest HDAC inhibition (IC₅₀ = 0.142 µM) – Superior docking score (–9.4 kcal/mol) – Potent anticancer activity – Favorable selectivity profile Gamma instructions: Display chemical structure of compound 7h at center. Add highlight box: Lead compound: 7h IC50 = 0.142 µM Docking score = −9.4 kcal/mol Bottom note: Future perspective: next-generation isoform-selective HDAC inhibitors.
Comments (0)
Sign in to leave a comment
Project Tasks11
Implement Theme & Structure from Mock-Design
As a Frontend Developer, I want to implement the visual theme and structural layout from all mock-design pages so that the scaffold project pages look exactly identical to the designed pages. This includes applying the green (#16A34A), purple (#7C3AED), and blue (#1D4ED8) accent color system, typography (Arial/Calibri), glassmorphism effects (backdrop-filter blur, rgba backgrounds), SlideChrome and FooterBar shared components, AccentDivider gradient bars, and removing any pages not required by the SRD. This task must be completed independently before any other page-specific tasks begin.
Implement Color & Theme Alignment
As a Frontend Developer, I want to perform a full color and theme alignment audit across all slide pages to ensure consistent application of: green (#16A34A), purple (#7C3AED), and blue (#1D4ED8) accent colors, Arial/Calibri typography with correct weight hierarchy, glassmorphism card styles (backdrop-filter blur, rgba backgrounds, border-radius), accent divider bars (green→purple→blue gradient), SlideChrome and FooterBar consistency, and responsive breakpoints (320px mobile, 768px tablet, 1024px desktop). Fix any visual inconsistencies found across all 12 slide pages.
Build Title Slide Page
As a Frontend Developer, I want to implement the Title Slide page based on the existing JSX design (v3). The page features: dynamic 3D rotating HDAC enzyme molecular visualization with Zn²⁺ silver metallic sphere, gradient background blending green/purple/blue, centered bold title 'Design, Synthesis, and Biological Evaluation of Novel Quinazoline–Triazole Hydroxamate Derivatives as Potent HDAC Inhibitors', student names, university name, course name, professor name, and date. Includes SlideChrome top bar, TitleBlock, PresentationMeta, InstitutionBadge, MolecularVisualization, AccentDivider, and FooterBar sections. This is the entry point for both Audience and Presenter user flows.
Build Introduction Slide Page
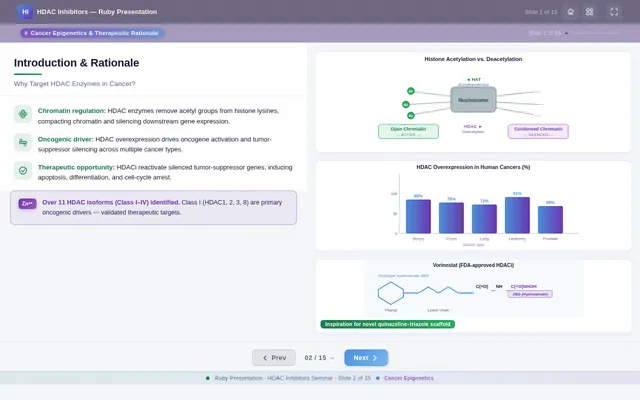
As a Frontend Developer, I want to implement the Introduction Slide page based on the existing JSX design (v4). The page covers Cancer Epigenetics & Therapeutic Rationale. Left column: SlideHeadline with title 'Cancer Epigenetics & Therapeutic Rationale', RationaleText card with 4 bullet points (cancer epigenetics, histone acetylation, HDAC isoforms 1/2/3/6/8, Vorinostat limitations), KeyInsightCallout with structural optimization rationale. Right column: EpigeneticsVisual (histone acetylation vs deacetylation diagram), HDACOverexpressionVisual (pathway diagram), VorinostatStructure (SAHA chemical structure with IC₅₀ ≈ 0.160 µM). Includes TopBar, ContextBanner, SlideNavigation, and BottomBar. This is step 2 in the Audience user flow — Read Rationale.
Build Slides Overview Page
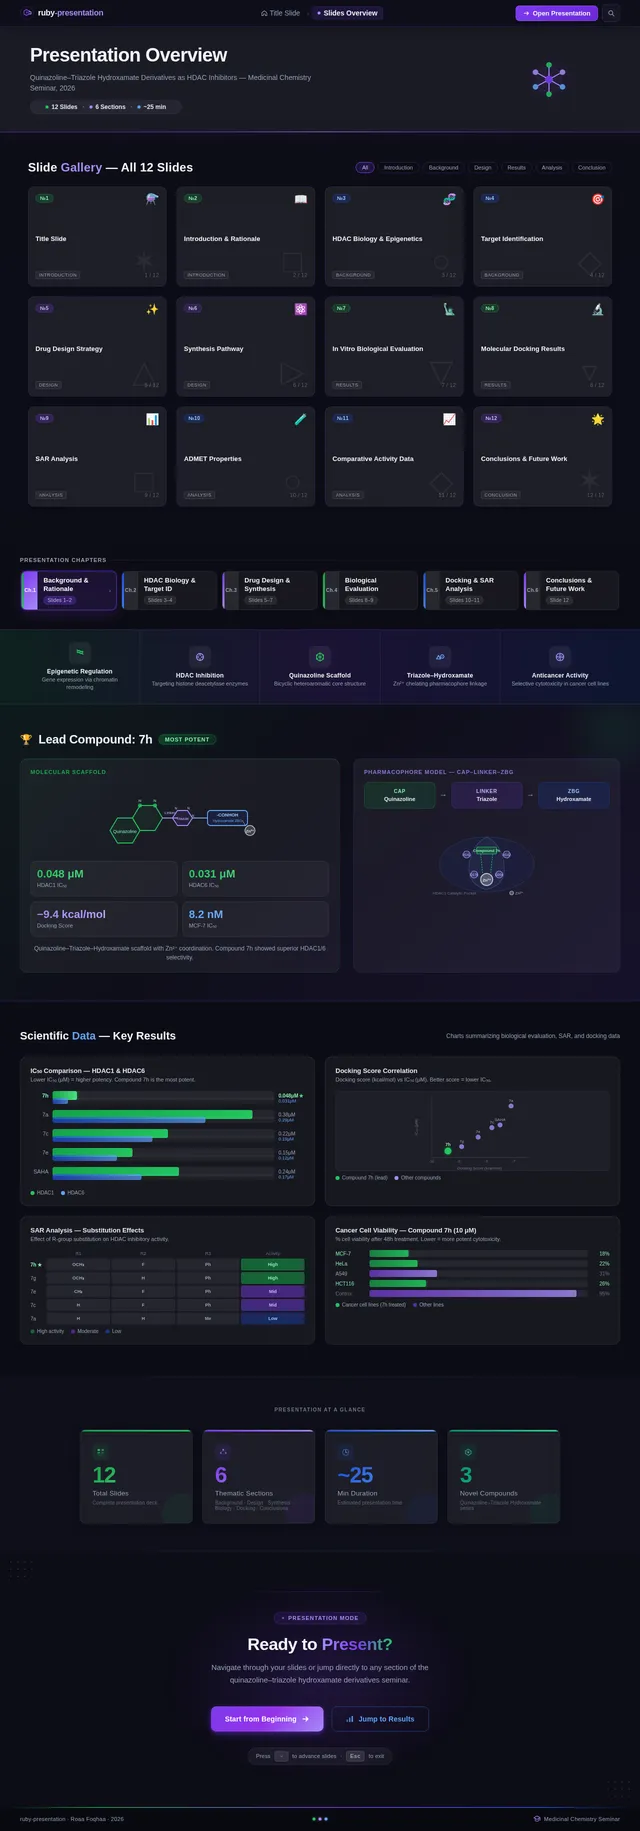
As a Frontend Developer, I want to implement the Slides Overview page based on the existing JSX design (v4). The page includes: OverviewNavBar with ruby-presentation wordmark, OverviewHero banner showing 'Presentation Overview' with animated molecule icon and slide count indicator (12 Slides · 6 Sections · ~25 min), SlideGridGallery with responsive 4/3/2 column thumbnail grid for all 12 slides, SectionChapters horizontal chapter navigator, KeyThemesBar with 5 scientific themes, PresentationStats with 4 stat cards, NavigationCTA, and OverviewFooter. Dark navy animated background with molecular lattice overlay. This is step 2 in the Presenter user flow — Review Structure.
Build Content Slide Page
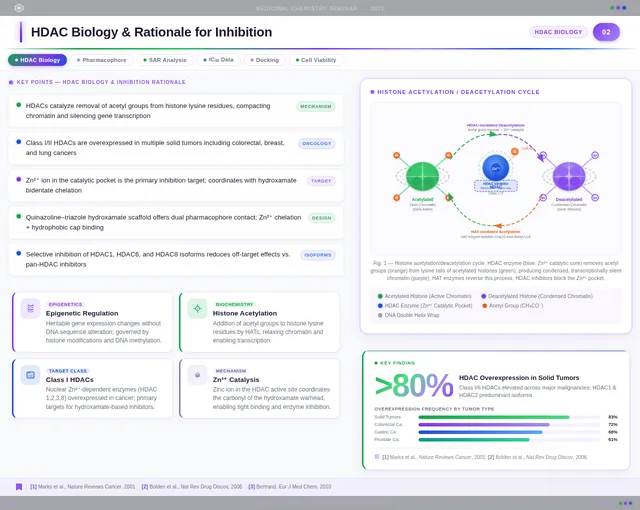
As a Frontend Developer, I want to implement the Content Slide page based on the existing JSX design (v3). The page presents structured research content. Left column (55%): ContentOutlinePanel with frosted-glass bullet rows covering HDAC mechanisms, Class I/II overexpression in cancers, Zn²⁺ catalytic pocket inhibition target, quinazoline–triazole scaffold dual benefit, and nanomolar IC₅₀ values; KeyConceptsGrid with 2×2 concept cards (Epigenetic Regulation, Histone Acetylation, Class I HDACs, Zn²⁺ Catalysis). Right column (45%): ScientificDiagramPanel (histone acetylation/deacetylation SVG diagram), DataHighlightCard ('>80% solid tumors' stat with progress visualization). Includes SlideChrome, SlideTitleBar, ReferencesStrip, and FooterBar. This is step 3 in the Presenter user flow — Present Research.
Build Science Slide Page
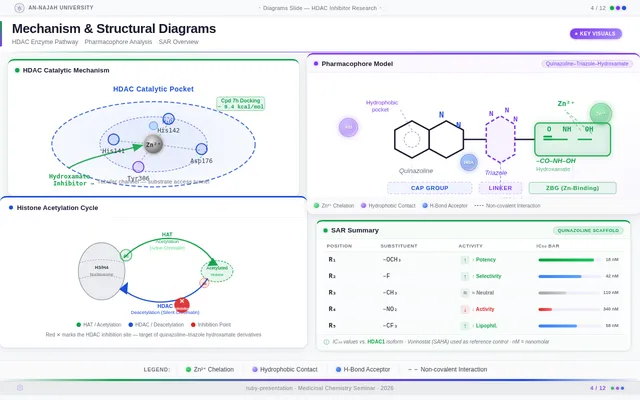
As a Frontend Developer, I want to implement the Science Slide page based on the existing JSX design (v4). Topic: 'Scientific Background & Mechanism of Action'. Includes SlideChrome, SlideTitleBar with purple left-border accent and 'HDAC Biology' category pill badge, ConceptIntroRow with three concept chips (Epigenetic Regulation, HDAC Enzyme Inhibition, Zn²⁺ Catalytic Mechanism), HDACMechanismDiagram (deacetylation cycle with Zn²⁺ sphere, pulsing silver shimmer animation, His142/His143/Tyr306 residue labels), HistoneAcetylationPanel (two-state chromatin diagram), MolecularDockingPanel (PyMOL-style docking visualization with IC₅₀ = 0.03 µM annotation), PharmacophoreAnnotation (quinazoline–triazole–hydroxamate 2D structure with SAR table), KeyTakeawayBar, and FooterBar. This is step 3 in the Audience user flow — View Diagrams.
Build Diagrams Slide Page
As a Frontend Developer, I want to implement the Diagrams Slide page based on the existing JSX design (v4). The page displays high-quality scientific visualizations including: HDAC pharmacophore model (Cap–Linker–ZBG) with color coding (blue cap, gray linker, red ZBG), quinazoline–triazole–hydroxamate scaffold with labeled functional groups (hydroxamic acid Zn²⁺ chelation, triazole H-bond acceptor, quinazoline cap π–π stacking), synthetic reaction scheme (cyclization → click chemistry → hydroxaminolysis), and fragment-based drug design diagram showing three fragments combining into hybrid molecule. This is step 4 in the Presenter user flow — Display Visuals.
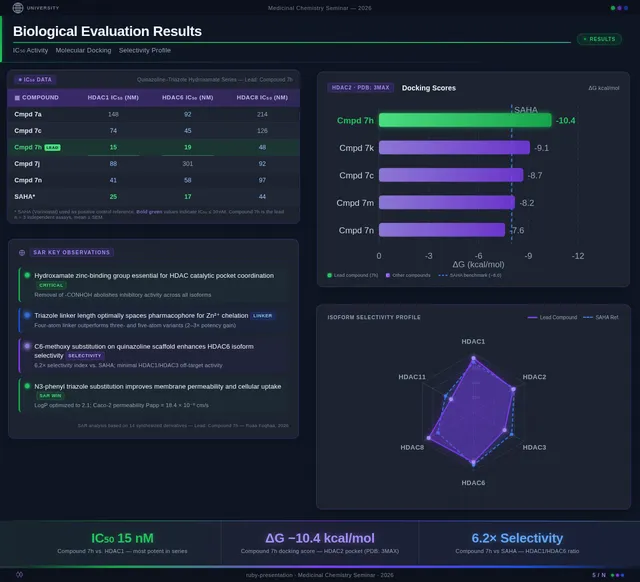
Build Results Slide Page
As a Frontend Developer, I want to implement the Results Slide page based on the existing JSX design (v4). The page presents biological evaluation data. Must include: IC₅₀ comparison bar chart highlighting compound 7h (IC₅₀ = 0.142 µM) vs Vorinostat (IC₅₀ = 0.160 µM), SAR analysis chart showing Series 7 benzamide vs Series 11 propenamide HDAC activity, cancer cell viability chart for SW620 and MDA-MB-231 cell lines, molecular docking visualization of compound 7h in HDAC1 catalytic pocket (docking score –9.4 kcal/mol vs Vorinostat –8.6 kcal/mol), docking score vs IC₅₀ correlation scatter plot, and substituent effects SAR table (7-Br, 7-CH₃, 6-Cl derivatives). Compound 7h prominently highlighted as lead compound. This is step 4 in the Audience user flow — Interpret Charts and step 5 in the Presenter flow — Show Data Charts.
Build Conclusion Slide Page
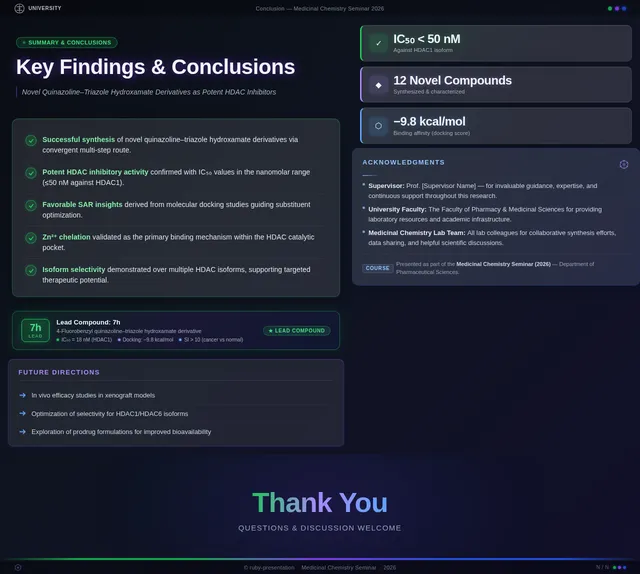
As a Frontend Developer, I want to implement the Conclusion Slide page based on the existing JSX design (v4). The page summarizes research findings: novel quinazoline–triazole–hydroxamate series development, superior activity vs Vorinostat, compound 7h as lead candidate (IC₅₀ = 0.142 µM, docking score –9.4 kcal/mol, potent anticancer activity, favorable selectivity). Must include: chemical structure of compound 7h centered prominently, highlighted lead compound callout box, future perspectives note on next-generation isoform-selective HDAC inhibitors, and summary of key findings. This is the final step in both the Audience flow (step 5 — Review Findings) and Presenter flow (step 6 — Summarize Findings).
Implement Slide Navigation & Routing
As a Frontend Developer, I want to implement smooth slide-to-slide navigation and routing across all 12 slide pages so that the presenter can navigate sequentially (Title → Slides Overview → Introduction → Science → Content → Diagrams → Results → Conclusion) or jump directly to any slide. Implement previous/next slide controls, slide dot indicators, keyboard arrow key support, and slide overview access. Ensure navigation state is preserved and matches both the Audience and Presenter user flow diagrams.
No comments yet. Be the first!