regal-dashboard
 ashi singh
Build a professional AI analytics dashboard-style website for a Deep Learning project named: VisionDigits AI AI-Powered Handwritten Digit Recognition Dashboard Project Goal: Create an interactive web application where users can draw or upload handwritten digits (0–9) and receive predictions using a trained CNN model based on the MNIST dataset. Tech Stack: Python, Convolutional Neural Network (CNN), MNIST dataset, FastAPI backend API, Streamlit frontend interface, OpenCV for image preprocessing, Plotly or Matplotlib for visualization. Core Features: • Canvas input to draw handwritten digits • Image upload option for prediction • Large predicted digit display in bold format • Top-3 prediction confidence scores • Full probability distribution chart for digits (0–9) • Bright colorful visible confidence bars • Confidence gauge meter visualization • Grad-CAM attention heatmap visualization • Prediction history panel storing last 5 predictions • Download prediction result option • Demo sample digit buttons for quick testing without drawing Explainable AI Features: • Confidence interpretation panel explaining whether prediction confidence is high, medium, or low • Panel showing top 3 similar digit predictions with comparison confidence • Attention heatmap explaining which image region influenced prediction Dashboard UI Requirements: • Fix overlapping layout issues • Add proper spacing between all components • Use high-contrast typography (primary text white, secondary text light gray) • Replace thin fonts with modern fonts like Inter or Poppins • Keep dark theme but add theme toggle button (dark/light mode switch) • Save theme preference after page reload • Use bright distinct colors for probability bars (digits 0–9) • Highlight prediction output clearly • Center-align dashboard layout professionally • Add clean card-style UI sections like real AI analytics dashboards Workflow Section (visible pipeline): Capture → Pre-process → CNN Inference → Visualization Explain steps clearly: Capture: user draws or uploads digit Pre-process: resize image to 28×28 pixels, grayscale conversion, normalization CNN Inference: trained CNN model predicts digit probabilities Visualization: display predicted digit, charts, and Grad-CAM heatmap Navigation Menu: Home | About | Architecture | Dataset | Workflow | Model Training Add About Page Section: Include explanation describing what VisionDigits AI is and how it works step-by-step using CNN and MNIST dataset. Explain preprocessing, prediction pipeline, visualization outputs, and dashboard workflow clearly. Dataset Information Panel: Dataset: MNIST handwritten digit dataset Images: 70,000 samples Classes: digits 0–9 Image size: 28×28 pixels Model Architecture Panel: Model Type: Convolutional Neural Network Layers: Convolution → ReLU → Pooling → Dense → Softmax Display model accuracy (~98%) Model Training Details Panel: Epochs used during training Optimizer: Adam Loss function: categorical cross-entropy Training accuracy visualization chart Visualization Panel: Confidence gauge meter Colorful probability distribution chart Grad-CAM attention heatmap explanation Top 3 similar digit prediction comparison chart Prediction Intelligence Panels: Confidence interpretation panel (high / medium / low confidence explanation) Prediction history panel storing last 5 predictions Footer Status Bar: System Active indicator API connection status Inference latency indicator Model type: CNN MNIST Precision level indicator System Performance Panel: Display inference time in milliseconds Show model loaded status Show API connected status Design Requirement: Create a modern professional AI analytics dashboard interface with structured layout, readable typography, colorful charts, card-style UI panels, and responsive spacing similar to real-world machine learning product demo dashboards. Additional UX Enhancements: Add demo sample digit buttons Add download prediction report option Add prediction history tracking panel Add similar digit comparison visualization Add confidence explanation logic panel Goal: Build a resume-level interactive AI deployment website demonstrating Deep Learning classification, Explainable AI visualization, CNN prediction workflow understanding, API integration using FastAPI, and a professional dashboard interface suitable for portfolio presentation and job interviews.

Comments (0)
Sign in to leave a comment
Project Tasks19
Implement Theme & Global Styles
As a user I want to be able to use a consistent dark/light theme across all pages. Implement the global color palette (#121212 background, #1E1E1E surface, #F5F5F5 text, #FF5722 accent, #757575 muted), typography (Inter/Poppins), and theme toggle logic with localStorage persistence. Remove any scaffold pages not needed (e.g. default welcome page). This task must be completed independently before any page implementation begins.
Implement Prediction API
As a user I want to be able to use the backend API for digit prediction. Implement a FastAPI endpoint POST /api/predict that accepts a base64-encoded image or file upload, preprocesses it (resize to 28×28, grayscale, normalize), runs CNN inference, and returns predicted digit, top-3 confidence scores, full probability distribution (0–9), and inference latency in ms.
Integrate Status Bar Dashboard
As a user, I want the Dashboard StatusBar component wired to GET /api/status polling every 30 seconds so that real-time indicators (API status, inference latency, model type, IST timestamp) are displayed without manual refresh.
Integrate Report Download Dashboard
As a user, I want the Dashboard QuickActions download button wired to GET /api/report so that I can download a full prediction report (PDF/JSON with prediction, confidence scores, heatmap, IST timestamp) with one click.
Implement Confidence Interpretation API
As a developer, I need a FastAPI endpoint using LangChain that accepts a confidence score and returns a human-readable interpretation (high/medium/low with explanation) so that users can understand prediction reliability in plain language.
Build Home Page
As a user I want to be able to use the Home page to draw a digit on a canvas, upload an image, or test a demo sample digit. Implement the Home page based on the existing JSX design (v2). The page should include: interactive canvas input, image upload button with ripple animation, fixed demo sample digit buttons, and an animated workflow pipeline (Capture → Pre-process → Analysis → Visualization). Links to Dashboard after prediction. Ensure light/dark theme compatibility.
Build Dashboard Page
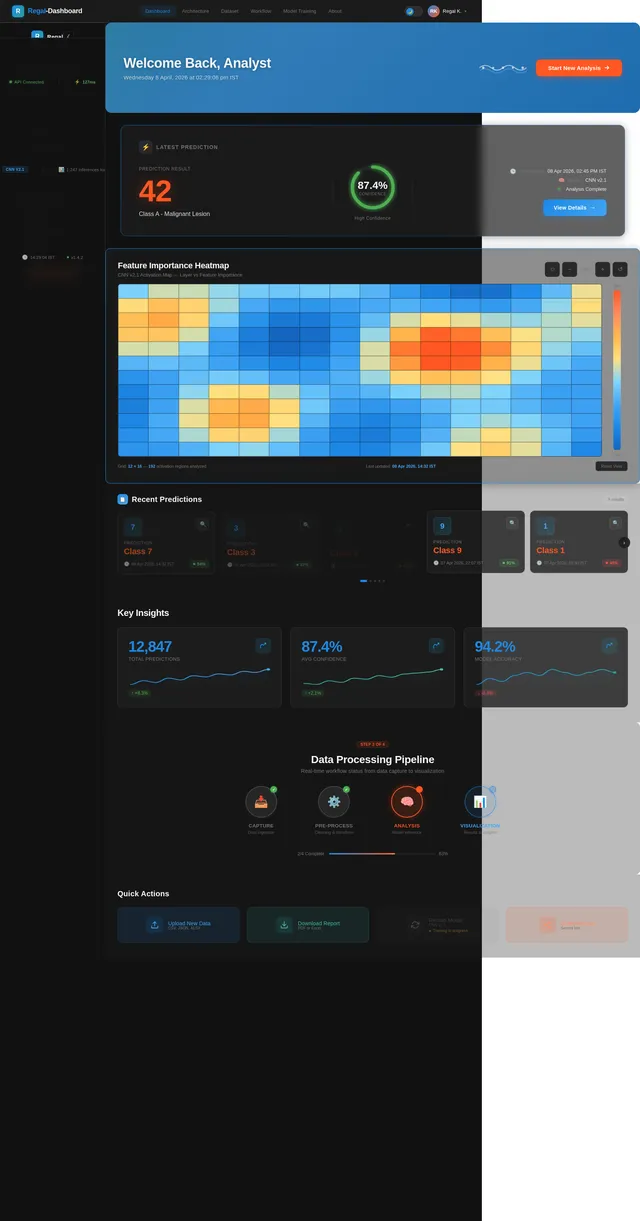
As a user I want to be able to use the Dashboard page to view the latest prediction result, explore the Grad-CAM heatmap, review prediction history, and download a report. Implement based on existing JSX design (v2). Sections include: PredictionPanel (large bold digit, confidence radial indicator), InteractiveHeatmap (Grad-CAM), HistorySection (last 5 predictions with IST timestamps and confidence badges), InsightsCards (total predictions, avg confidence, model accuracy), WorkflowVisualization, QuickActions (upload, download, retrain, share), TopBar, Sidebar, and StatusBar. Fix light theme rendering. Ensure all sub-sections are functional and navigable.
Build Architecture Page
As a user I want to be able to use the Architecture page to view CNN model layer details (Convolution → ReLU → Pooling → Dense → Softmax), model accuracy (~98%), and model type. Implement based on existing JSX design (v1). The page should visually represent each layer with icons, labels, and a brief description. Link back to Dashboard and forward to Dataset per user flow.
Build Dataset Page
As a user I want to be able to use the Dataset page to explore MNIST dataset information: 70,000 samples, 10 classes (digits 0–9), 28×28 image size. Implement based on existing JSX design (v1). Include dataset stats cards, sample image grid, and class distribution chart. Links from Architecture and to Workflow per user flow.
Build Workflow Page
As a user I want to be able to use the Workflow page to view the full data processing pipeline: Capture → Pre-process (resize 28×28, grayscale, normalize) → CNN Inference → Visualization. Implement based on existing JSX design (v1). Include animated step nodes, descriptions per step, and status indicators. Links from Dataset to Model Training per user flow.
Build Model Training Page
As a user I want to be able to use the Model Training page to view training statistics: epochs, optimizer (Adam), loss function (categorical cross-entropy), and training accuracy visualization chart. Implement based on existing JSX design (v1). Include training accuracy/loss charts and a model performance summary card. Links from Workflow per user flow.
Build About Page
As a user I want to be able to use the About page to read an overview of VisionDigits AI, understand how it works step-by-step using CNN and MNIST, and learn about preprocessing, prediction pipeline, visualization outputs, and the dashboard workflow. Implement based on existing JSX design (v1). Include narrative sections with icons and clear typography. Entry point for Recruiter/Interviewer persona per user flow.
Implement Grad-CAM Heatmap API
As a user I want to be able to use the backend API for Grad-CAM heatmap generation. Implement a FastAPI endpoint POST /api/heatmap that accepts an image and returns a Grad-CAM attention heatmap overlay image (base64 or URL) highlighting the regions that influenced the CNN prediction.
Implement Report Download API
As a user I want to be able to use the backend API to download a prediction report. Implement a FastAPI endpoint GET /api/report that generates and returns a PDF or structured JSON report containing prediction result, confidence scores, heatmap image, and IST timestamp for the current session.
Implement Status Bar API
As a user I want to be able to use the footer status bar to see real-time system performance indicators. Implement a FastAPI endpoint GET /api/status returning API connection status, inference latency (ms), model type (CNN v2.x), model loaded status, and current IST timestamp. Poll every 30 seconds from the frontend StatusBar component.
Build Confidence Interpretation UI
As a user, I want a confidence interpretation panel on the Dashboard that shows a LangChain-generated explanation (high/medium/low confidence label with descriptive text) so that I can understand the model's prediction reliability without technical knowledge.
Integrate Prediction API with Home
As a user I want to be able to use the Home page canvas draw, image upload, and demo sample buttons to trigger real backend predictions. Wire POST /api/predict to the Home page input components. On success, navigate to Dashboard and pass prediction results. Show loading states and error handling. Fix wrong prediction display issue.
Integrate Heatmap API with Dashboard
As a user I want to be able to use the Dashboard page to view the real Grad-CAM heatmap for the latest prediction. Wire POST /api/heatmap to the InteractiveHeatmap section. Include zoom/pan controls, color scale legend, and tooltip on hover. Ensure heatmap updates when a new prediction is loaded from HistorySection.
Implement Selective Re-run Feature
As a user I want to be able to trigger a selective re-run of specific dashboard sections (PredictionPanel, InteractiveHeatmap, InsightsCards) to regenerate outputs without refreshing the entire page. Add re-run buttons per section in the Dashboard UI that call the relevant API endpoints and update only that section's state.

VisionDigits AI
Handwritten Digit Recognition Powered by Deep Learning
Draw or upload any handwritten digit and watch our CNN model recognize it in real-time — complete with confidence scores, attention heatmaps, and full probability distributions.
Draw a Digit
Use the canvas below to draw any digit from 0 to 9. The model will recognize your handwriting in real-time.
Drop an image here or click to upload a handwritten digit
Full Distribution
Probability scores across all digits (0–9). The predicted digit is highlighted in cyan.
Confidence Interpretation
High ConfidenceThe model is highly confident that the input digit is 7. The CNN detected strong, distinctive features that closely match training patterns for this digit. This prediction is reliable and consistent with high-quality input.
Grad-CAM Attention Heatmap
The highlighted regions show where the neural network focused when making the prediction. Warmer colors (red, yellow) indicate higher activation areas that most influenced the CNN model's decision. Cooler colors (green) represent regions with lower contribution to the output classification.
Activation Intensity
Toggle the attention map to visualize which pixel regions of the input digit the CNN model focuses on during inference. This explainable AI feature uses Gradient-weighted Class Activation Mapping (Grad-CAM).
Try Demo Samples
Click to instantly test the model on these handwritten digits from the MNIST dataset.
Digit 0 Loaded!
Round shape, clean stroke
Digit 1 Loaded!
Vertical stroke, slight tilt
Digit 2 Loaded!
Curved top with flat base
Digit 3 Loaded!
Double curve, classic form
Digit 4 Loaded!
Angular intersecting lines
Digit 5 Loaded!
Flat top with curved bottom
Digit 6 Loaded!
Loop at bottom, curved top
Digit 7 Loaded!
Horizontal top, diagonal stroke
Digit 8 Loaded!
Double loop, symmetric shape
Digit 9 Loaded!
Loop on top, descending tail
Recent Predictions
5 of 5Top 3 Predictions
Compare how the CNN model ranked its top predictions. The confidence scores show the probability distribution across the most likely digit candidates.
Predictions are generated by the CNN model trained on the MNIST dataset. Confidence scores represent the softmax probability output for each digit class (0–9).
About VisionDigits AI
A deep learning-powered dashboard demonstrating CNN-based handwritten digit recognition, Explainable AI visualization, and a professional API-integrated workflow — built for portfolio presentation and technical interviews.
What is VisionDigits AI?
VisionDigits AI is an interactive web application that uses a Convolutional Neural Network (CNN) trained on the MNIST dataset to recognize handwritten digits (0–9). Users can draw or upload digit images and receive instant AI-powered predictions with confidence scores and explainable visualizations.
Preprocessing Pipeline
Input images are resized to 28×28 pixels, converted to grayscale, and normalized to a 0–1 pixel value range. This matches the MNIST training data format, ensuring optimal prediction accuracy from the CNN model.
CNN Prediction Engine
The trained Convolutional Neural Network processes the preprocessed image through convolution layers, ReLU activations, pooling layers, and dense layers. The final softmax layer outputs probability scores for each digit class (0–9), enabling confident classification.
Visualization & Explainability
Results are displayed as probability distribution charts, confidence gauge meters, Grad-CAM attention heatmaps, and top-3 prediction comparisons. These explainable AI features help users understand which image regions influenced the model's decision.
Dataset Information
The model is trained on the MNIST handwritten digit dataset — one of the most widely used benchmarks in computer vision and deep learning research.
Model Architecture
Convolutional Neural Network architecture trained on the MNIST dataset for handwritten digit classification.
CNN Layer Pipeline
Model Training Details
Training configuration and accuracy progression of the CNN model over 15 epochs.
Training Accuracy Over Epochs
System Performance
Real-time metrics from the VisionDigits AI inference engine
Ready to Dive Deeper?
Explore the CNN architecture powering VisionDigits AI or follow the complete digit recognition workflow from input capture to visualization.
No comments yet. Be the first!