regal-dashboard
 ashi singh
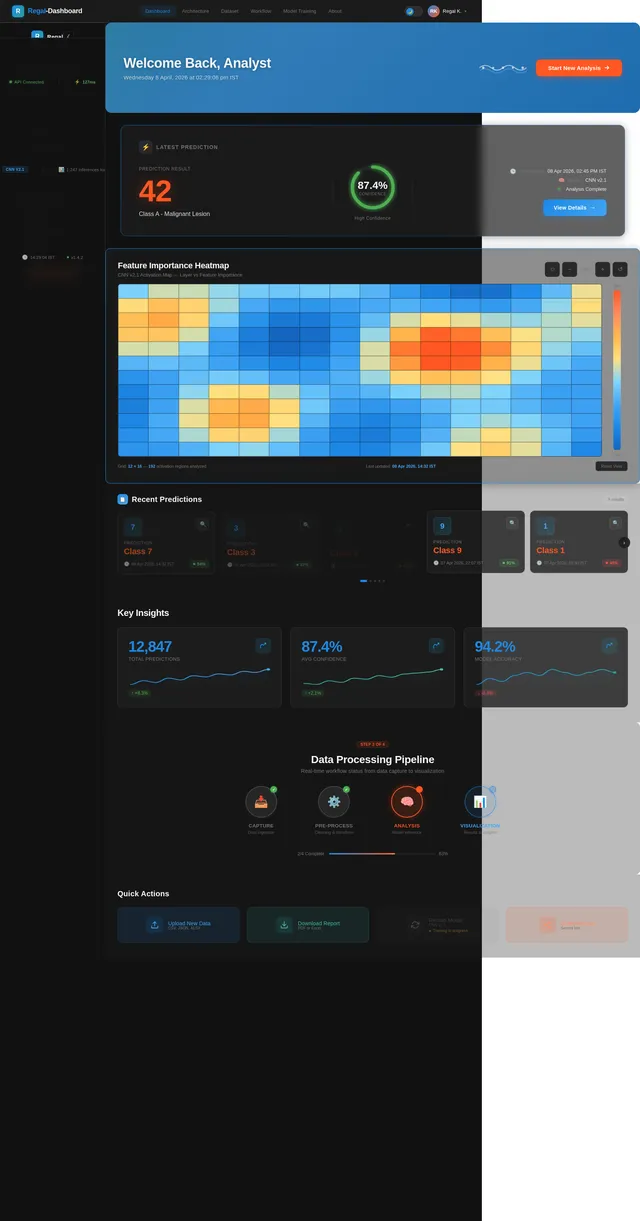
Build a professional AI analytics dashboard-style website for a Deep Learning project named: VisionDigits AI AI-Powered Handwritten Digit Recognition Dashboard Project Goal: Create an interactive web application where users can draw or upload handwritten digits (0–9) and receive predictions using a trained CNN model based on the MNIST dataset. Tech Stack: Python, Convolutional Neural Network (CNN), MNIST dataset, FastAPI backend API, Streamlit frontend interface, OpenCV for image preprocessing, Plotly or Matplotlib for visualization. Core Features: • Canvas input to draw handwritten digits • Image upload option for prediction • Large predicted digit display in bold format • Top-3 prediction confidence scores • Full probability distribution chart for digits (0–9) • Bright colorful visible confidence bars • Confidence gauge meter visualization • Grad-CAM attention heatmap visualization • Prediction history panel storing last 5 predictions • Download prediction result option • Demo sample digit buttons for quick testing without drawing Explainable AI Features: • Confidence interpretation panel explaining whether prediction confidence is high, medium, or low • Panel showing top 3 similar digit predictions with comparison confidence • Attention heatmap explaining which image region influenced prediction Dashboard UI Requirements: • Fix overlapping layout issues • Add proper spacing between all components • Use high-contrast typography (primary text white, secondary text light gray) • Replace thin fonts with modern fonts like Inter or Poppins • Keep dark theme but add theme toggle button (dark/light mode switch) • Save theme preference after page reload • Use bright distinct colors for probability bars (digits 0–9) • Highlight prediction output clearly • Center-align dashboard layout professionally • Add clean card-style UI sections like real AI analytics dashboards Workflow Section (visible pipeline): Capture → Pre-process → CNN Inference → Visualization Explain steps clearly: Capture: user draws or uploads digit Pre-process: resize image to 28×28 pixels, grayscale conversion, normalization CNN Inference: trained CNN model predicts digit probabilities Visualization: display predicted digit, charts, and Grad-CAM heatmap Navigation Menu: Home | About | Architecture | Dataset | Workflow | Model Training Add About Page Section: Include explanation describing what VisionDigits AI is and how it works step-by-step using CNN and MNIST dataset. Explain preprocessing, prediction pipeline, visualization outputs, and dashboard workflow clearly. Dataset Information Panel: Dataset: MNIST handwritten digit dataset Images: 70,000 samples Classes: digits 0–9 Image size: 28×28 pixels Model Architecture Panel: Model Type: Convolutional Neural Network Layers: Convolution → ReLU → Pooling → Dense → Softmax Display model accuracy (~98%) Model Training Details Panel: Epochs used during training Optimizer: Adam Loss function: categorical cross-entropy Training accuracy visualization chart Visualization Panel: Confidence gauge meter Colorful probability distribution chart Grad-CAM attention heatmap explanation Top 3 similar digit prediction comparison chart Prediction Intelligence Panels: Confidence interpretation panel (high / medium / low confidence explanation) Prediction history panel storing last 5 predictions Footer Status Bar: System Active indicator API connection status Inference latency indicator Model type: CNN MNIST Precision level indicator System Performance Panel: Display inference time in milliseconds Show model loaded status Show API connected status Design Requirement: Create a modern professional AI analytics dashboard interface with structured layout, readable typography, colorful charts, card-style UI panels, and responsive spacing similar to real-world machine learning product demo dashboards. Additional UX Enhancements: Add demo sample digit buttons Add download prediction report option Add prediction history tracking panel Add similar digit comparison visualization Add confidence explanation logic panel Goal: Build a resume-level interactive AI deployment website demonstrating Deep Learning classification, Explainable AI visualization, CNN prediction workflow understanding, API integration using FastAPI, and a professional dashboard interface suitable for portfolio presentation and job interviews.

Comments (0)
Sign in to leave a comment
System Requirements
System Requirements Document (SRD) for Regal-Dashboard
1. Introduction
The Regal-Dashboard project is a professional AI analytics dashboard designed to provide users with an interactive and polished experience for visualizing and analyzing deep learning models. This dashboard leverages cutting-edge technologies to deliver real-time predictions, Explainable AI visualizations, and a structured workflow for showcasing AI capabilities.
The project is tailored for users in India, with locale-specific considerations such as IST (Indian Standard Time), high-contrast visuals for accessibility, and a modern design aesthetic. The goal is to create a resume-level interactive AI deployment website that demonstrates deep learning classification, Explainable AI visualization, CNN prediction workflow understanding, API integration using FastAPI, and a professional dashboard interface suitable for portfolio presentation and job interviews.
This document outlines the system requirements for Regal-Dashboard, ensuring alignment with the project's goals and user expectations.
2. System Overview
The Regal-Dashboard is a web-based application that provides the following functionalities:
- Interactive Input Options: Users can draw digits on a canvas or upload images for prediction.
- Explainable AI Features: Includes confidence interpretation, Grad-CAM heatmaps, and top-3 prediction comparisons.
- Visualization Tools: Displays probability distribution charts, confidence gauge meters, and prediction history.
- Professional Dashboard UI: Features a dark/light theme toggle, card-style layouts, and responsive spacing.
- Workflow Transparency: Clearly explains the data processing pipeline: Capture → Pre-process → CNN Inference → Visualization.
- Selective Re-run Capability: Allows users to trigger a re-run of specific sections to regenerate outputs without refreshing the entire dashboard.
The system is designed to operate in the Indian context, ensuring compatibility with local standards and user preferences.
3. Functional Requirements
As User:
- I should be able to draw digits on a canvas for prediction.
- I should be able to upload images of handwritten digits for prediction.
- I should be able to view the predicted digit in a large, bold format.
- I should be able to view the top-3 prediction confidence scores.
- I should be able to see a full probability distribution chart for digits (0–9).
- I should be able to toggle between dark and light themes, with my preference saved after page reload.
- I should be able to navigate through sections like Home, About, Architecture, Dataset, Workflow, and Model Training.
- I should be able to view Grad-CAM attention heatmaps explaining which image regions influenced predictions.
- I should be able to view a confidence gauge meter visualization.
- I should be able to view a prediction history panel storing the last 5 predictions.
- I should be able to download prediction results as a report.
- I should be able to test the system using demo sample digit buttons.
- I should be able to trigger a selective re-run of specific sections to regenerate outputs without refreshing the entire dashboard.
4. User Personas
1. General User
- Description: Individuals interested in testing AI-powered handwritten digit recognition.
- Goals: Draw or upload digits, view predictions, and explore visualizations.
- Needs: Intuitive interface, clear predictions, and engaging visualizations.
2. Data Scientist
- Description: Professionals working with deep learning models and Explainable AI.
- Goals: Understand the CNN workflow, test predictions, and evaluate model performance.
- Needs: Detailed insights, Grad-CAM visualizations, and confidence interpretation.
3. Recruiter/Interviewer
- Description: Professionals evaluating the dashboard as part of a portfolio.
- Goals: Assess the candidate's technical and design skills.
- Needs: Professional UI, clear workflow, and polished presentation.
5. Visuals Colors and Theme
Unique Color Palette:
- Background:
#1A202C(Charcoal Gray) - Surface:
#2D3748(Slate Gray) - Text:
#E2E8F0(Soft White) - Accent:
#63B3ED(Sky Blue) - Muted Tones:
#718096(Muted Gray)
This palette ensures high contrast, readability, and a professional aesthetic suitable for an AI analytics dashboard.
6. Signature Design Concept
Interactive Neural Network Visualization Landing Page
The homepage of Regal-Dashboard will feature an interactive neural network visualization that immerses users in the AI prediction process. Here's how it works:
- Dynamic Neural Network Animation: The homepage showcases a simplified neural network diagram that dynamically updates as users interact with the system. Nodes light up and animate to represent data flow through the network.
- Interactive Canvas Input: A glowing canvas invites users to draw digits. As they draw, the canvas animates with subtle ripple effects.
- Real-Time Prediction Display: A bold, animated display shows the predicted digit in real-time, accompanied by confidence scores.
- Seamless Transitions: Smooth animations guide users through the workflow, with visualizations "popping" into view in vibrant colors.
- Theme Integration: The dark/light theme toggle subtly shifts the glow and background tones, creating a cohesive experience.
This design ensures the homepage is not only functional but also visually captivating, leaving a lasting impression.
7. Non-Functional Requirements
- Performance: Predictions and visualizations should be delivered within 500ms for a seamless user experience.
- Scalability: The system should handle up to 200 concurrent users.
- Accessibility: Ensure WCAG 2.1 compliance for color contrast and keyboard navigation.
- Security: Protect user-uploaded data and ensure secure API communication.
- Localization: Default to Indian Standard Time (IST) and support English as the primary language.
8. Tech Stack
Frontend:
- React for Web
Backend:
- Python
- FastAPI
Database:
- MySQL (using Alembic for migrations)
AI Models:
- Convolutional Neural Network (CNN) trained on the MNIST dataset.
AI Tools:
- LangChain for Explainable AI workflows.
Orchestration:
- Docker for containerization.
- Kubernetes for server-side orchestration.
9. Assumptions and Constraints
- The system assumes users have a basic understanding of handwritten digit recognition.
- The system will not store user data beyond the current session unless explicitly downloaded by the user.
- The application will be hosted on a cloud platform with sufficient resources for AI inference.
10. Glossary
- Grad-CAM: Gradient-weighted Class Activation Mapping, a technique for visualizing which parts of an image influenced an AI model's prediction.
- Inference: The process of making predictions using a trained model.
- Selective Re-run: A feature that allows users to regenerate outputs for specific sections without refreshing the entire dashboard.
- WCAG: Web Content Accessibility Guidelines, a standard for making web content accessible.
This document provides a comprehensive overview of the Regal-Dashboard project, ensuring clarity and alignment with the project's goals. Let me know if there are any additional updates or refinements you'd like to make, ashi!

VisionDigits AI
Handwritten Digit Recognition Powered by Deep Learning
Draw or upload any handwritten digit and watch our CNN model recognize it in real-time — complete with confidence scores, attention heatmaps, and full probability distributions.
Draw a Digit
Use the canvas below to draw any digit from 0 to 9. The model will recognize your handwriting in real-time.
Drop an image here or click to upload a handwritten digit
Full Distribution
Probability scores across all digits (0–9). The predicted digit is highlighted in cyan.
Confidence Interpretation
High ConfidenceThe model is highly confident that the input digit is 7. The CNN detected strong, distinctive features that closely match training patterns for this digit. This prediction is reliable and consistent with high-quality input.
Grad-CAM Attention Heatmap
The highlighted regions show where the neural network focused when making the prediction. Warmer colors (red, yellow) indicate higher activation areas that most influenced the CNN model's decision. Cooler colors (green) represent regions with lower contribution to the output classification.
Activation Intensity
Toggle the attention map to visualize which pixel regions of the input digit the CNN model focuses on during inference. This explainable AI feature uses Gradient-weighted Class Activation Mapping (Grad-CAM).
Try Demo Samples
Click to instantly test the model on these handwritten digits from the MNIST dataset.
Digit 0 Loaded!
Round shape, clean stroke
Digit 1 Loaded!
Vertical stroke, slight tilt
Digit 2 Loaded!
Curved top with flat base
Digit 3 Loaded!
Double curve, classic form
Digit 4 Loaded!
Angular intersecting lines
Digit 5 Loaded!
Flat top with curved bottom
Digit 6 Loaded!
Loop at bottom, curved top
Digit 7 Loaded!
Horizontal top, diagonal stroke
Digit 8 Loaded!
Double loop, symmetric shape
Digit 9 Loaded!
Loop on top, descending tail
Recent Predictions
5 of 5Top 3 Predictions
Compare how the CNN model ranked its top predictions. The confidence scores show the probability distribution across the most likely digit candidates.
Predictions are generated by the CNN model trained on the MNIST dataset. Confidence scores represent the softmax probability output for each digit class (0–9).
About VisionDigits AI
A deep learning-powered dashboard demonstrating CNN-based handwritten digit recognition, Explainable AI visualization, and a professional API-integrated workflow — built for portfolio presentation and technical interviews.
What is VisionDigits AI?
VisionDigits AI is an interactive web application that uses a Convolutional Neural Network (CNN) trained on the MNIST dataset to recognize handwritten digits (0–9). Users can draw or upload digit images and receive instant AI-powered predictions with confidence scores and explainable visualizations.
Preprocessing Pipeline
Input images are resized to 28×28 pixels, converted to grayscale, and normalized to a 0–1 pixel value range. This matches the MNIST training data format, ensuring optimal prediction accuracy from the CNN model.
CNN Prediction Engine
The trained Convolutional Neural Network processes the preprocessed image through convolution layers, ReLU activations, pooling layers, and dense layers. The final softmax layer outputs probability scores for each digit class (0–9), enabling confident classification.
Visualization & Explainability
Results are displayed as probability distribution charts, confidence gauge meters, Grad-CAM attention heatmaps, and top-3 prediction comparisons. These explainable AI features help users understand which image regions influenced the model's decision.
Dataset Information
The model is trained on the MNIST handwritten digit dataset — one of the most widely used benchmarks in computer vision and deep learning research.
Model Architecture
Convolutional Neural Network architecture trained on the MNIST dataset for handwritten digit classification.
CNN Layer Pipeline
Model Training Details
Training configuration and accuracy progression of the CNN model over 15 epochs.
Training Accuracy Over Epochs
System Performance
Real-time metrics from the VisionDigits AI inference engine
Ready to Dive Deeper?
Explore the CNN architecture powering VisionDigits AI or follow the complete digit recognition workflow from input capture to visualization.
No comments yet. Be the first!