pearl-disasters
 Vedant Mhatre
Description Urban regions frequently face localized disasters such as floods, heatwaves, and infrastructure failures. However, existing systems lack timely, community-driven prediction and response mechanisms, leading to delayed actions and increased damage. There is a need for a platform that enables better awareness, reporting, and response using available or simulated data. Objective To develop a platform that predicts and manages localized disasters using available or simulated data and community participation. Key Features Real-time disaster prediction using multiple data sources (or simulated inputs) Geo-tagged community-based incident reporting system Alert and notification system for risk zones Visualization of affected areas on interactive maps Quick reporting interface for users Integration-ready architecture for external data sources Offline-capable functionality for low-connectivity scenarios Expected Impact Enables faster disaster response Improves preparedness and awareness Reduces potential damage and risks make me creative website for this for my offline hackathon build an web app
Comments (0)
Sign in to leave a comment
Project Tasks20
Implement Predictions API
As a backend developer, I want to build FastAPI endpoints for disaster predictions: GET /predictions (list predicted events with type, confidence, date range, affected zone), POST /predictions/data-sources (admin toggle data source), GET /predictions/model-accuracy. Integrates simulated input data pipeline and confidence scoring. Uses Litellm/Langchain for LLM-assisted prediction summaries.
Implement Theme & Structure
As a developer, I want to implement the pearl-disasters design system (color palette: #F5F9FF bg, #FF6B6B accent, #1A1A1A text, #34A853 secondary, #1A73E8 primary) and global layout structure across all scaffold pages. Remove pages not needed (signup, welcome, ai-assistant, settings if not in flow). Set up CSS custom properties, Inter font, shared NavBar/Footer components, and ensure all existing scaffold pages match the mock-design token system. This is a prerequisite for all other UI tasks.
Implement Incidents API
As a backend developer, I want to build FastAPI endpoints for incident management: POST /incidents (create geo-tagged report), GET /incidents (list with filters: type, severity, status, location), GET /incidents/{id} (detail), PUT /incidents/{id}/verify (admin verification), DELETE /incidents/{id}. Includes MySQL models with Alembic migrations, geo-coordinates storage, and status state machine (pending → in_review → verified/rejected).
Implement Alerts API
As a backend developer, I want to build FastAPI endpoints for alerts: POST /alerts (admin broadcast), GET /alerts (list active alerts by zone/severity), GET /alerts/{id}, PUT /alerts/{id}/acknowledge, DELETE /alerts/{id}/dismiss. Includes severity levels (critical, high, medium, low), zone targeting, issued_time, and recommendation fields. Supports push notification subscription management.
Implement Map Zones API
As a backend developer, I want to build FastAPI endpoints for map data: GET /zones (disaster-prone zones with geo-boundaries and severity), GET /zones/{id}/incidents (incidents in zone), GET /zones/heatmap (aggregated risk density for map overlay). Supports filtering by disaster type, time range, and severity. Returns GeoJSON-compatible data for Leaflet integration.
Implement AI Prediction Engine
As an AI engineer, I want to build the disaster prediction pipeline using Litellm for LLM routing and Langchain for orchestration. Ingest simulated or real disaster data inputs, run prediction logic, generate confidence scores per zone and disaster type, and expose results via the Predictions API. Integrate GPT for generating user-friendly prediction summaries and recommendations.
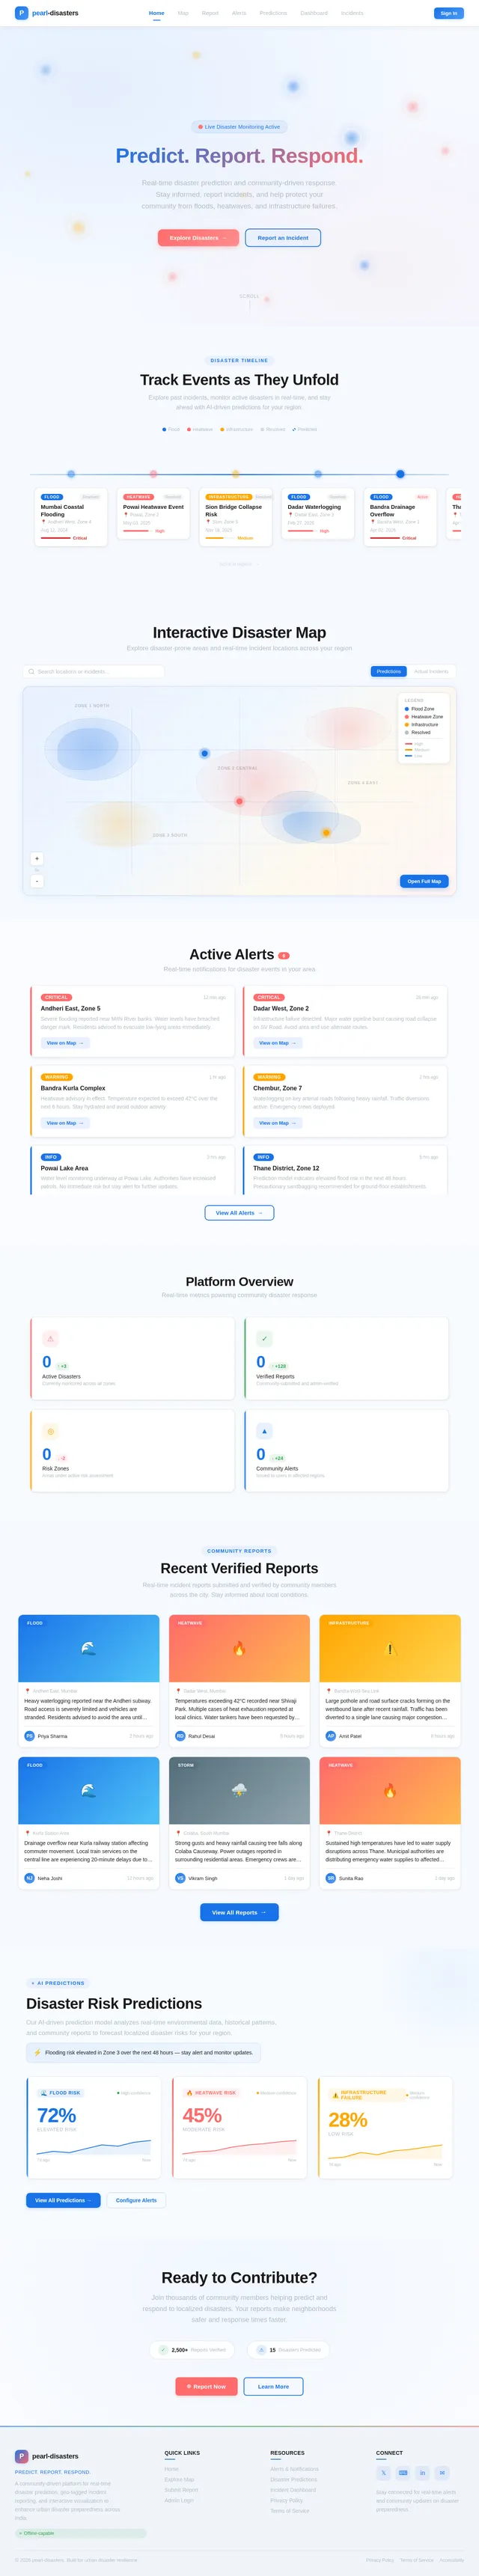
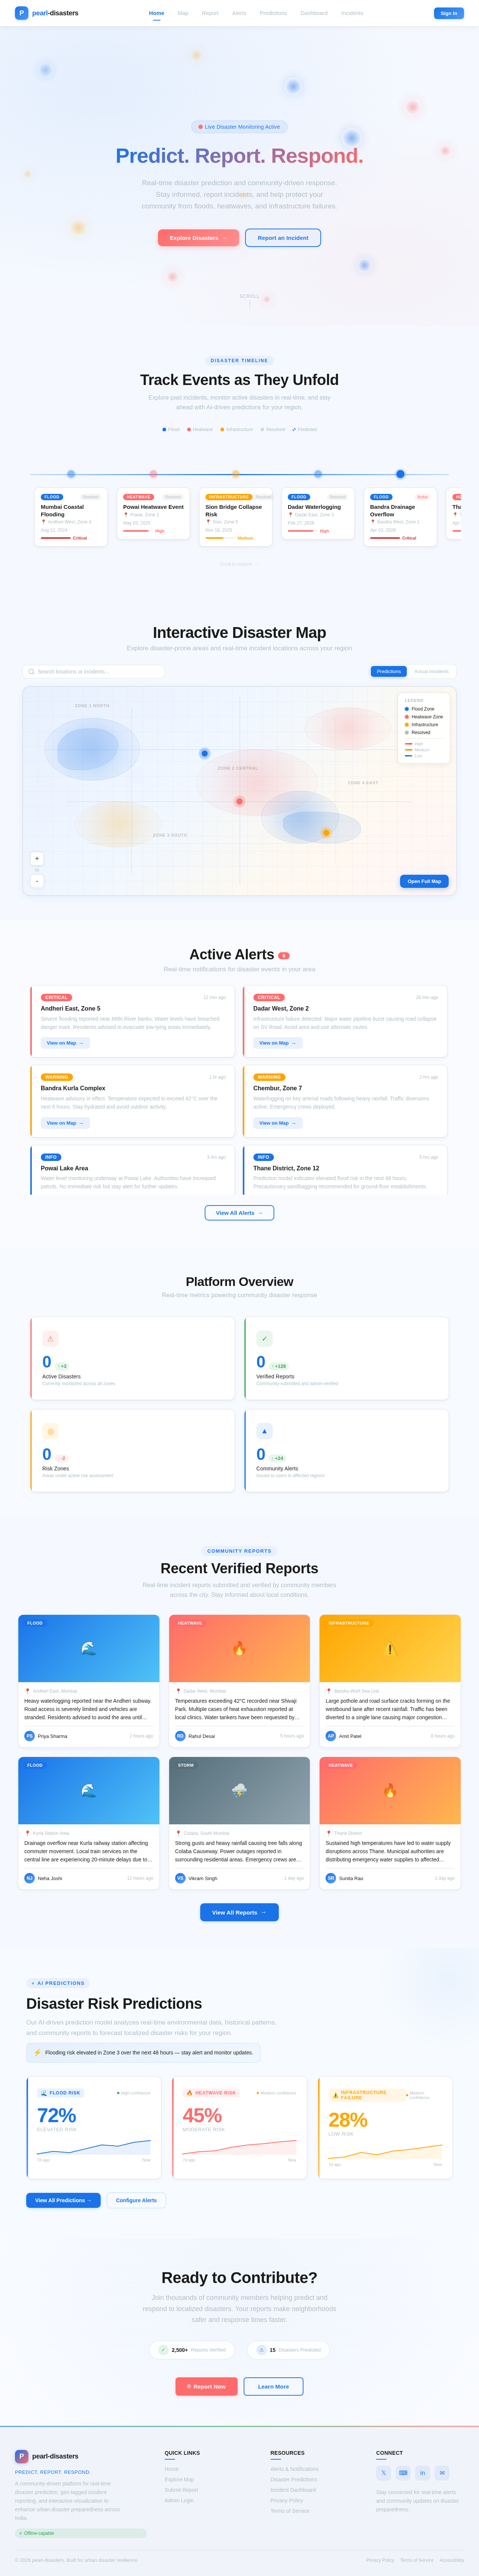
Build Home Page
As a community member, I want to use the Home page to view the interactive disaster timeline, explore past/present/predicted events as clickable animated nodes, and navigate to Map and Alerts. Implement based on existing Home (v2) JSX design. Includes: NavBar, interactive disaster timeline with ripple animations, color-shifting background by disaster type, hero section, and Footer. Links to: Map, Alerts.
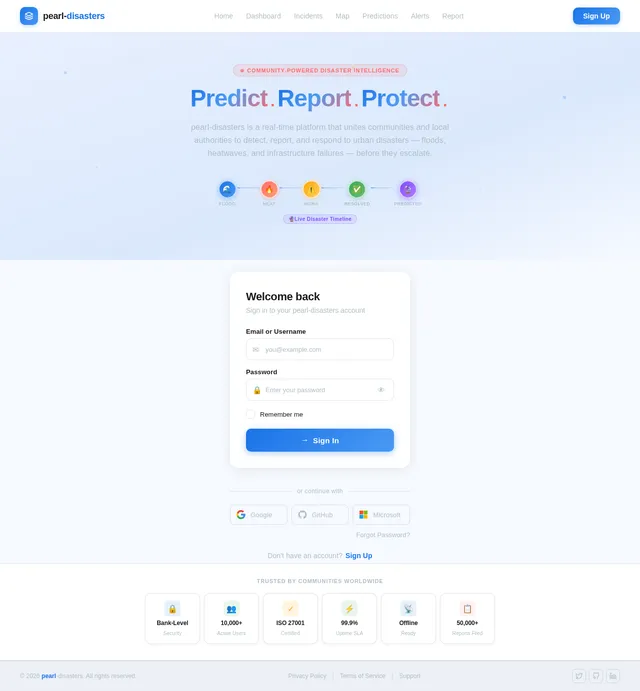
Build Login Page
As an administrator, I want to use the Login page to sign in securely and be redirected to the Dashboard. Implement based on existing Login (v2) JSX design. Includes: sign-in form, email/password fields, primary CTA button, error states, and pearl-disasters branding. Links to: Dashboard (on success).
Build Dashboard Page
As an administrator, I want to use the Dashboard page to view an overview of active disasters, incident statistics, alert summaries, and quick navigation to Incidents and Map. Implement based on existing Dashboard (v1) JSX design. Includes: TopNavigation, Sidebar, WelcomeBanner, DisasterTimeline preview, AlertsSummary, InteractiveMap panel, RiskZoneStats, PredictionPanel, RecentIncidents, NotificationCenter, ActionButtons, Footer. Links to: Incidents, Map.
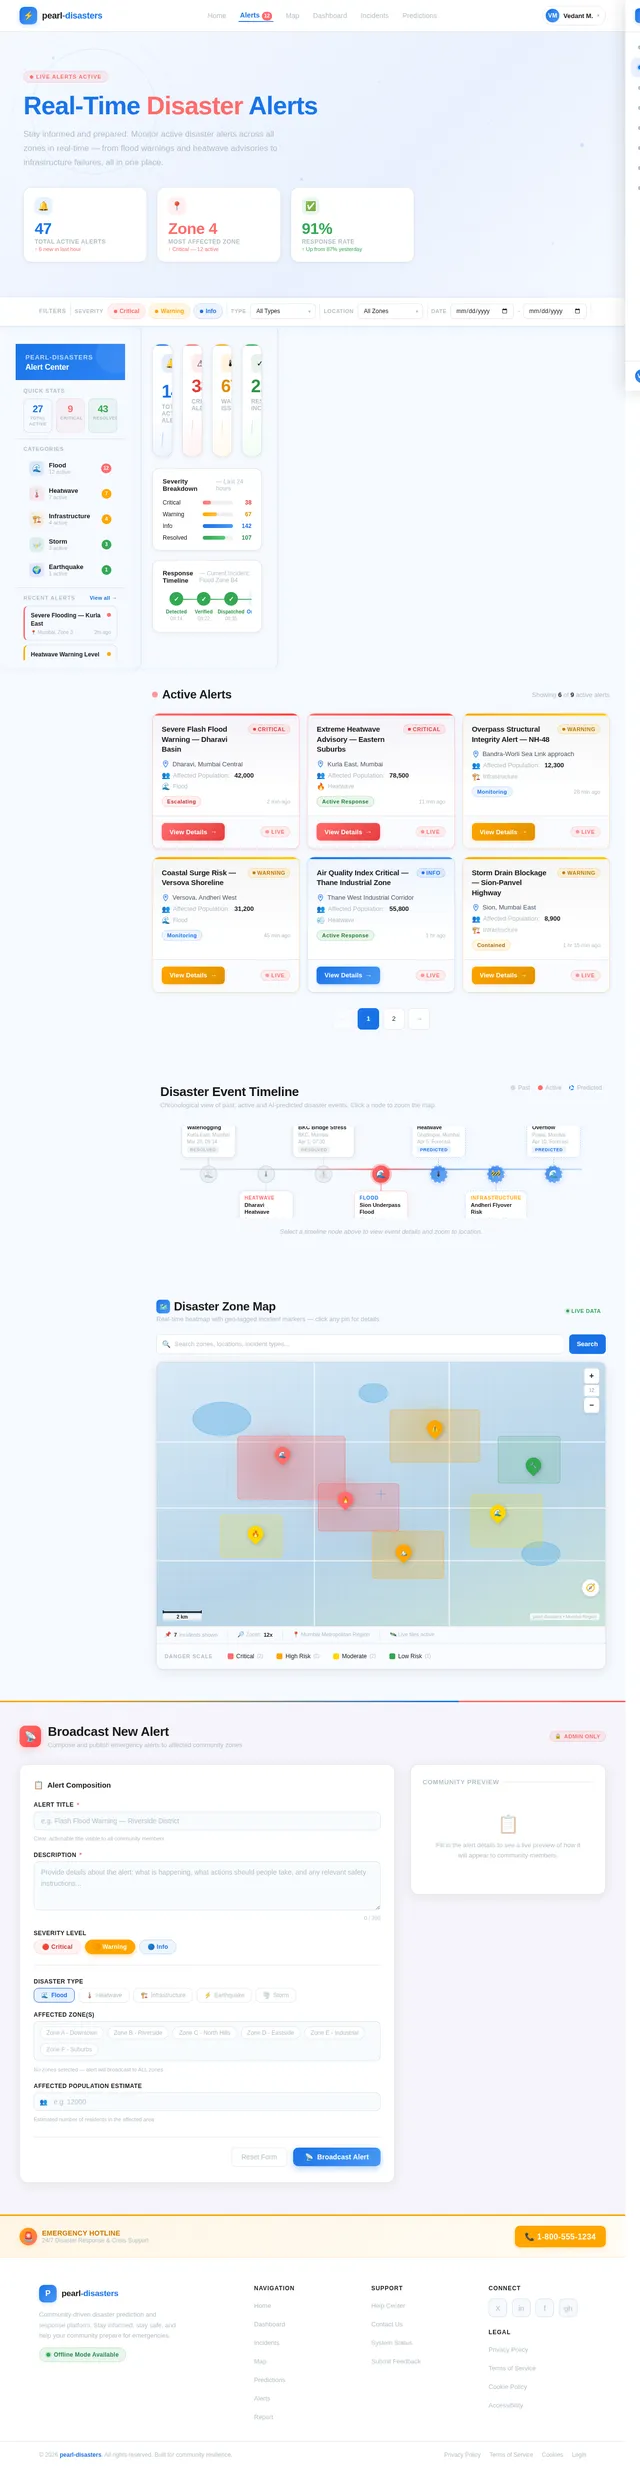
Build Alerts Page
As a community member, I want to use the Alerts page to view active notifications and alerts for risk zones, acknowledge or dismiss alerts, and navigate to the Map. Implement based on existing Alerts (v1) JSX design. Includes: alert list with severity badges (Critical=#FF6B6B, High=#FFA500), pulsing animations for active alerts, acknowledge/dismiss/share actions, push notification subscribe toggle, and breadcrumb back to Map. Links from: Home, Map. Links to: Map.
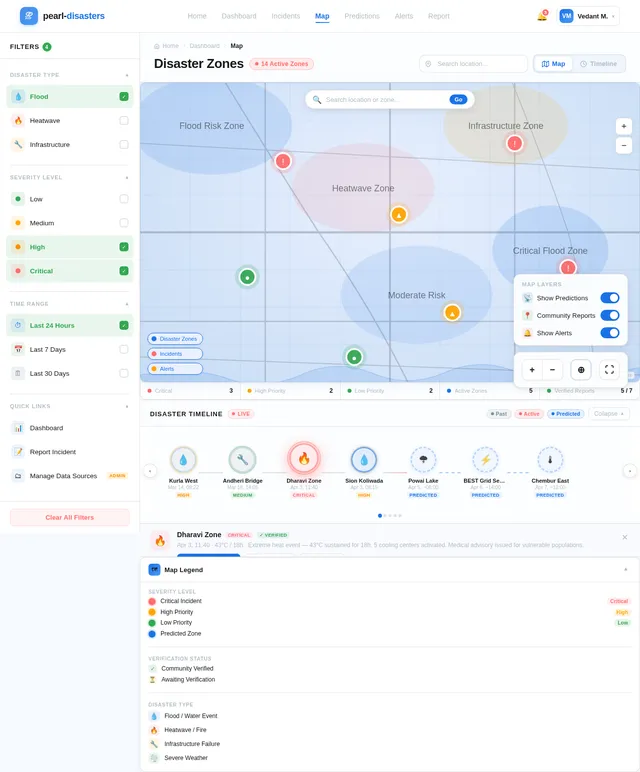
Build Map Page
As a user, I want to use the Map page to explore disaster zones on an interactive map with geo-tagged markers, heat map overlays, and real-time alerts. Implement based on existing Map (v2) JSX design. Includes: NavBar, Sidebar with filters, MapHeader, InteractiveMap with Leaflet, MapControls (layer toggles, zoom), DisasterTimeline, IncidentLegend, AlertPanel (slide-out with severity badges, pulse animations), Footer. Marker colors: critical=#FF6B6B, high=#FFA500, low=#34A853. Links to: Report. Navigated from: Home, Dashboard, Alerts.
Build Predictions Page
As an administrator, I want to use the Predictions page to manage external data sources, view real-time disaster predictions with confidence scores, and configure the prediction model. Implement based on existing Predictions (v1) JSX design. Includes: data source toggle management, predicted high-risk periods list, model accuracy gauge, confidence bars, and navigation to Alerts. Links from: Map. Links to: Alerts.
Integrate Alerts API with Frontend
As a frontend developer, I want to connect the Alerts page and Dashboard AlertsSummary to the backend alerts API. Render live alert data with severity badges, wire up acknowledge/dismiss/broadcast actions, and implement push notification subscribe toggle. Real-time polling or WebSocket for active alert updates.
Integrate Map API with Frontend
As a frontend developer, I want to connect the Map page to the backend zones and incidents APIs, rendering real geo-tagged markers and heat map overlays using Leaflet. Replace mock data with live API calls, wire up filter controls (disaster type, severity, time range) to API query params, and implement marker click → incident detail popup. Handle loading and error states.
Build Incidents Page
As an administrator, I want to use the Incidents page to view, manage, and verify community-reported incident reports. Implement based on existing Incidents (v1) JSX design. Includes: incident list with filters (type, severity, status), verification controls, approve/reject actions, incident detail panel, pagination, and search. Links from: Dashboard. Links to: Incident detail/verify view.
Build Report Page
As a community member, I want to use the Report page to submit an incident report with a geo-tagged location, add media, specify disaster type and severity, and proceed to Confirmation. Implement based on existing Report (v1) JSX design. Includes: multi-step form (incident details → geo-tag map picker → media upload → review & submit), progress indicator, offline support notice, and submit CTA. Links from: Map. Links to: Confirmation.
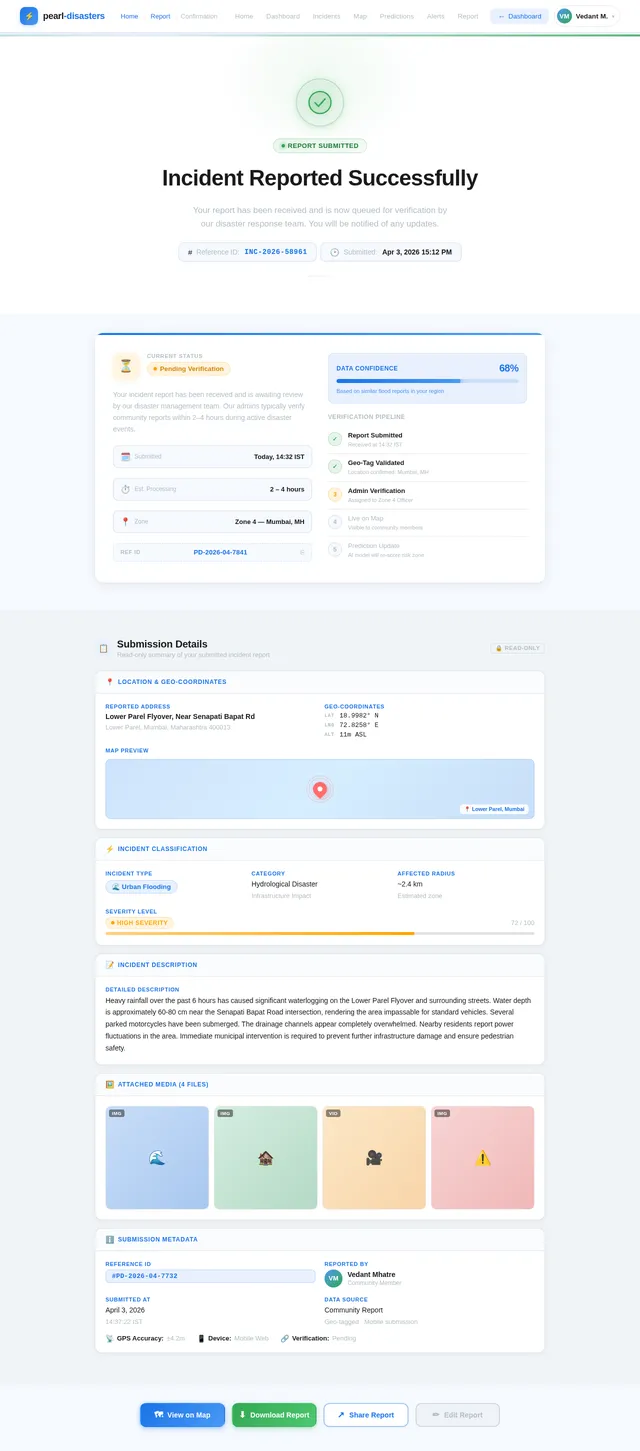
Build Confirmation Page
As a community member, I want to use the Confirmation page to view the status of my submitted incident report, see my report details, and take follow-up actions. Implement based on existing Confirmation (v2) JSX design. Includes: NavBar, Hero (success icon + reference ID + submission time), StatusCard (Pending/Verified/In Review badge), DetailsPanel (readonly geo-coordinates, type, severity, media), ActionButtons (View on Map, Download Report, Share, Edit), TimelinePreview (3-5 nodes showing incident placement), NextSteps (numbered verification steps), SupportSection, Footer. Links from: Report.
Implement Offline PWA Support
As a community member, I want to use the platform offline to submit incident reports and view cached maps when connectivity is unavailable. Implement service worker with cache-first strategy for map tiles and static assets, IndexedDB queue for offline incident submissions that sync when online, and offline status indicator in the UI.
Integrate Predictions API with Frontend
As a frontend developer, I want to connect the Predictions page to the backend predictions API. Render live predicted high-risk periods, confidence scores, model accuracy gauge, and data source toggle controls using real API responses. Show LLM-generated prediction summaries where applicable.
Integrate Incidents API with Frontend
As a frontend developer, I want to connect the Incidents page and Report page to the backend incidents API. Wire up incident list with live data, implement verification actions (approve/reject) calling PUT /incidents/{id}/verify, and connect the Report page form submission to POST /incidents. Show real reference IDs and status on the Confirmation page.
No comments yet. Be the first!