nova-ethanol
 yael tzror
ethanol, those lacking the tail domain exhibited a less dense network (Figure S1). This observation suggests that the tail domain may facilitate contacts between neighboring nanofilaments, contributing to a more cohesive internal structure. Importantly, since nanofibrils still formed in constructs without the tail (Ben-Harush et al., 2020), the observed aggregation phenomena under Ca²⁺ conditions are likely due to reduced connectivity rather than a failure of fibril formation itself. This reduced inter-fibril connectivity may limit interactions between neighboring fibrils, preventing the establishment of a continuous and mechanically stable network, which is consistent with the aggregation observed for these constructs under ion-mediated conditions.
Comments (0)
Sign in to leave a comment
System Requirements
System Requirements Document (SRD) for nova-ethanol
1. Introduction
The nova-ethanol project aims to provide a comprehensive platform for visualizing and analyzing biochemical phenomena, with a specific focus on nanofilament networks and their structural dynamics under varying conditions. This document outlines the system requirements for the development of the nova-ethanol platform, ensuring it meets the needs of researchers and professionals in the field of biochemistry and materials science.
This SRD has been updated to include a new feature: the ability to generate a figure for an article, as requested by the API supervisor. The figure will visually represent the differences in nanofilament networks under conditions with and without the tail domain, highlighting the role of inter-fibril connectivity.
2. System Overview
The nova-ethanol platform is designed to serve as a research and visualization tool for biochemical studies. It will enable users to model, analyze, and visualize complex molecular interactions, such as the aggregation phenomena of nanofilaments under ion-mediated conditions. The system will support the creation of high-quality figures for academic articles, providing researchers with tools to illustrate their findings effectively.
Key features of the system include:
- Interactive visualization of molecular structures and networks.
- Tools for generating publication-ready figures.
- Integration with advanced AI models for data analysis and visualization.
- Support for multiple user roles, including researchers, administrators, and guests.
The platform will be tailored to the needs of users in Israel (IL), with locale-specific defaults such as time zones and currency.
3. Functional Requirements
- As a Researcher, I should be able to upload molecular data for visualization.
- As a Researcher, I should be able to generate a figure for an article based on pre-resolved API data.
- As a Researcher, I should be able to compare nanofilament networks under different conditions (e.g., with and without the tail domain).
- As a Researcher, I should be able to export figures in publication-ready formats (e.g., PNG, SVG).
- As an Admin, I should be able to manage user accounts and permissions.
- As a Guest, I should be able to view public visualizations and articles.
4. User Personas
4.1 Researcher
- Description: A professional in the field of biochemistry or materials science who uses the platform to analyze molecular data and generate visualizations for research purposes.
- Goals: Upload data, generate figures, and export publication-ready visuals.
- Technical Expertise: Moderate to high.
4.2 Admin
- Description: A system administrator responsible for managing user accounts, permissions, and system settings.
- Goals: Ensure smooth operation of the platform and manage user access.
- Technical Expertise: High.
4.3 Guest
- Description: A casual user or potential researcher exploring the platform's capabilities.
- Goals: View public visualizations and articles.
- Technical Expertise: Low.
5. Visuals Colors and Theme
The nova-ethanol platform will feature a unique color palette inspired by molecular structures and biochemical environments. The colors will evoke a sense of precision, clarity, and innovation.
- Background: #F4F9FC (light molecular blue)
- Surface: #D9E4EA (soft gray-blue)
- Text: #1C3D5A (deep navy)
- Accent: #FF6F61 (vibrant coral)
- Muted Tones: #A3B9C9 (subtle steel blue)
This palette ensures a professional and visually appealing interface, suitable for academic and research contexts.
6. Signature Design Concept
Interactive Molecular Canvas
The homepage of nova-ethanol will feature an Interactive Molecular Canvas, a dynamic visualization that immediately immerses users in the world of molecular science.
-
Design Details:
- A 3D molecular network will float in the center of the screen, with nanofilaments dynamically connecting and disconnecting to simulate real-time aggregation phenomena.
- Users can interact with the canvas by clicking on molecular nodes, which will expand to reveal detailed information about the structure and its role in the network.
- The background will feature a subtle, animated gradient that shifts between the colors of the palette, creating a sense of depth and movement.
- Micro-interactions, such as hovering over a node, will trigger animations like glowing effects or slight vibrations to mimic molecular energy.
-
Landing Page Impact:
- The first impression will be one of cutting-edge technology and scientific precision.
- The interactive canvas will serve as both a visual centerpiece and a functional tool, allowing users to explore molecular data directly from the homepage.
This bold design concept will set nova-ethanol apart as a visually stunning and highly functional platform for researchers.
7. Non-Functional Requirements
- Performance: The system must handle large molecular datasets without significant lag.
- Scalability: The platform should support concurrent access by up to 500 users.
- Security: User data and uploaded files must be encrypted and stored securely.
- Accessibility: The interface must comply with WCAG 2.1 Level AA standards.
- Localization: The platform must support Hebrew and English languages.
8. Tech Stack
Frontend
- React for Web
Backend
- Python
- FastAPI
Database RDBMS
- MySQL (with Alembic for migrations)
AI Models
- GPT 5.4 for user-friendly responses
- Google Nano Banana for image generation
AI Tools
- Langchain
- Litellm for LLM Routing
Local Orchestration
- Docker
- docker-compose
Server-Side Orchestration
- Kubernetes
9. Assumptions and Constraints
- The system assumes that users have access to molecular data in compatible formats.
- The platform will be hosted on cloud infrastructure to ensure scalability.
- Development will prioritize features requested by researchers in Israel.
10. Glossary
- Nanofilament: A microscopic filament composed of molecular structures.
- Fibril Aggregation: The clustering of fibrils into a network under specific conditions.
- Tail Domain: A structural component of a molecule that facilitates inter-fibril connectivity.
- API: Application Programming Interface, used for integrating external data or functionalities.
- WCAG: Web Content Accessibility Guidelines, standards for making web content accessible.
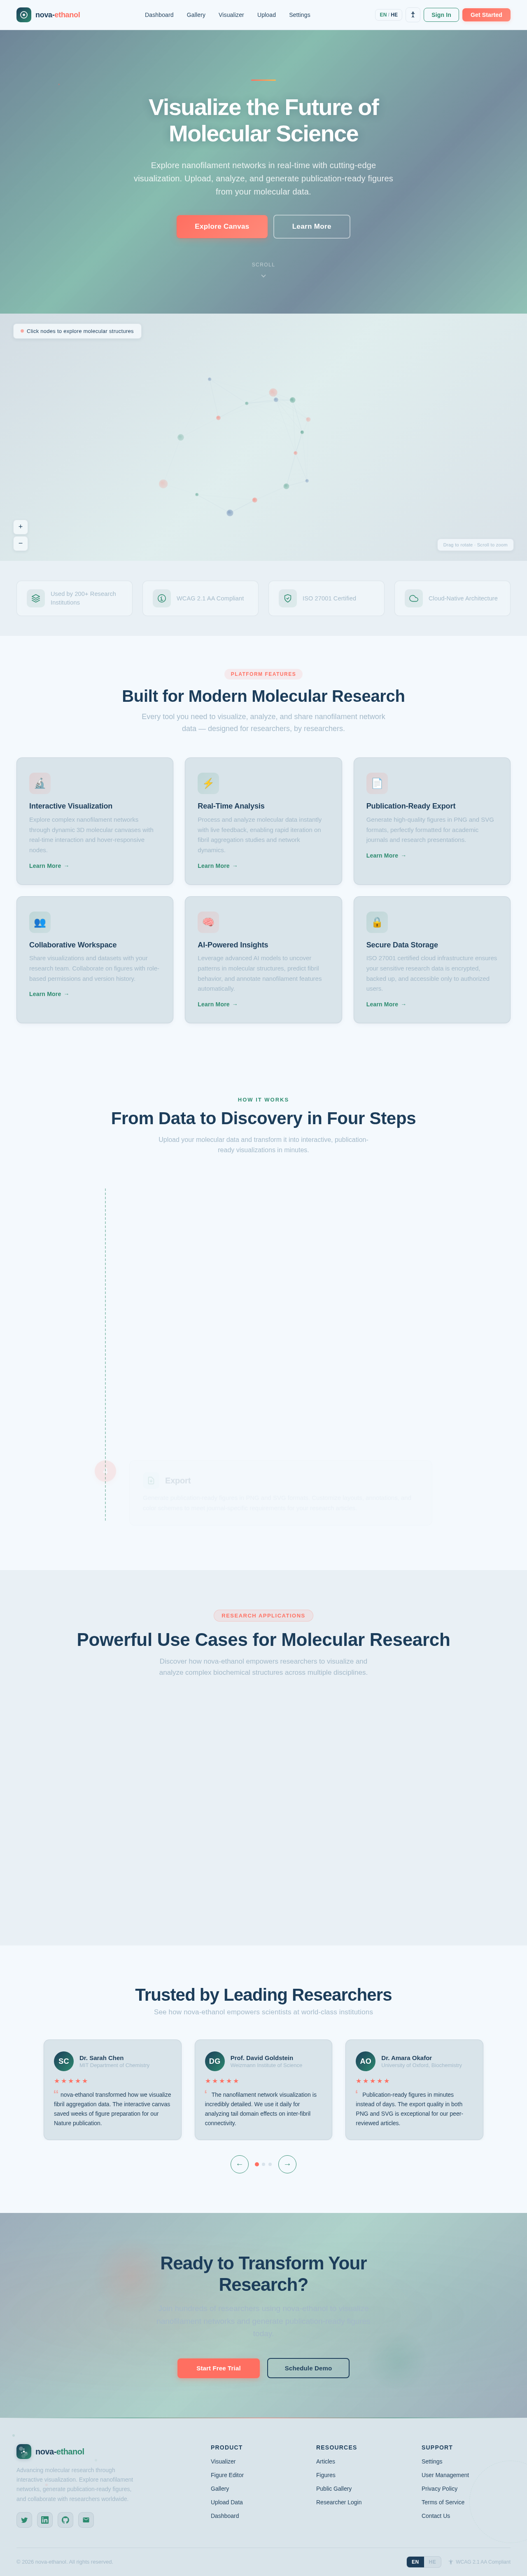
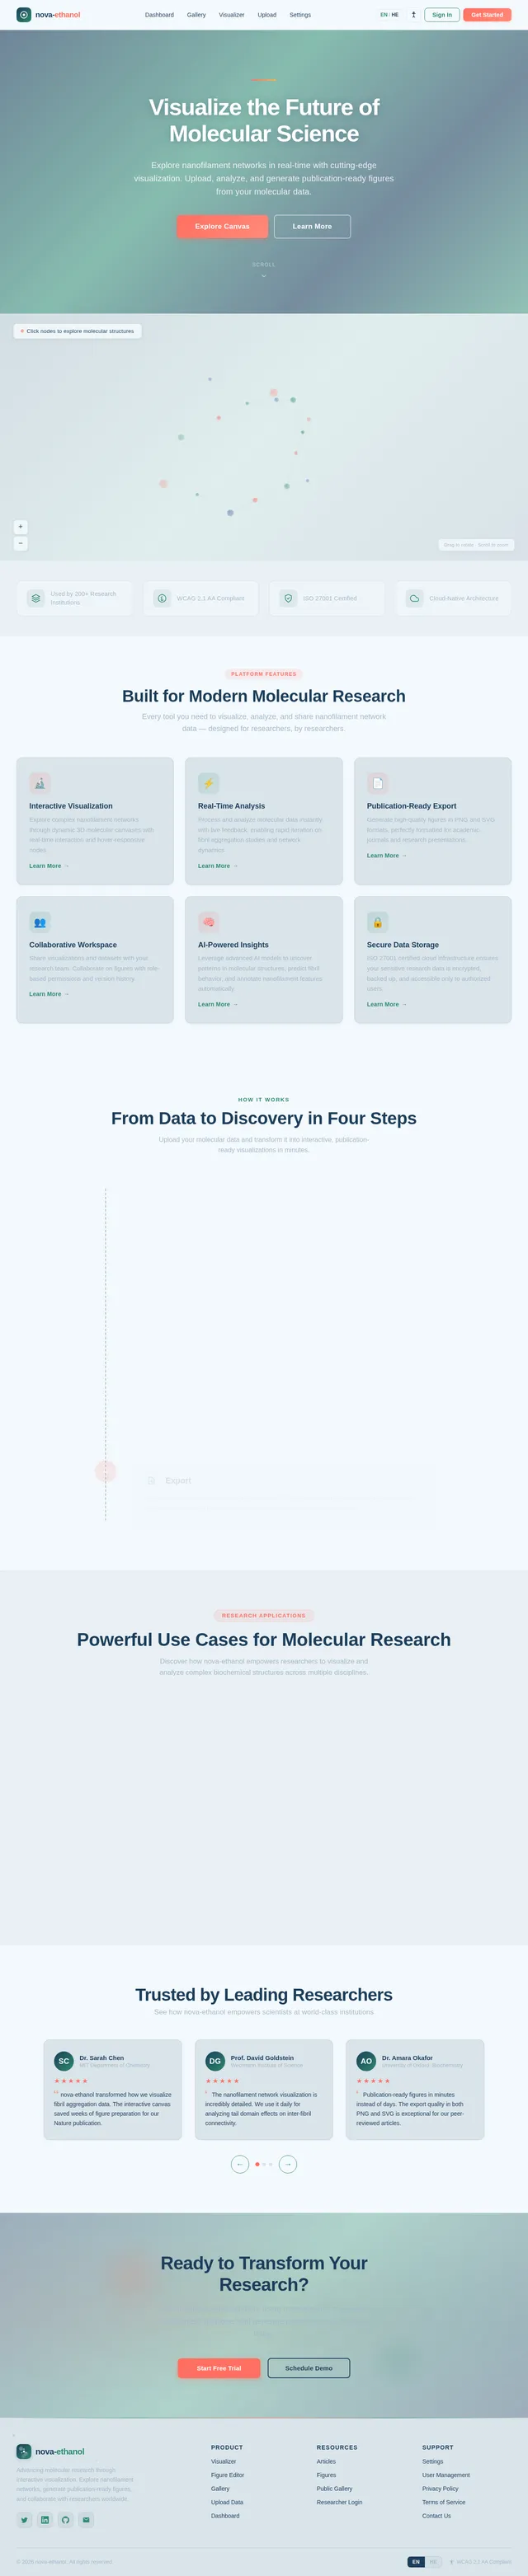
Visualize the Future of Molecular Science
Explore nanofilament networks in real-time with cutting-edge visualization. Upload, analyze, and generate publication-ready figures from your molecular data.
Built for Modern Molecular Research
Every tool you need to visualize, analyze, and share nanofilament network data — designed for researchers, by researchers.
Interactive Visualization
Explore complex nanofilament networks through dynamic 3D molecular canvases with real-time interaction and hover-responsive nodes.
Learn More→Real-Time Analysis
Process and analyze molecular data instantly with live feedback, enabling rapid iteration on fibril aggregation studies and network dynamics.
Learn More→Publication-Ready Export
Generate high-quality figures in PNG and SVG formats, perfectly formatted for academic journals and research presentations.
Learn More→Collaborative Workspace
Share visualizations and datasets with your research team. Collaborate on figures with role-based permissions and version history.
Learn More→AI-Powered Insights
Leverage advanced AI models to uncover patterns in molecular structures, predict fibril behavior, and annotate nanofilament features automatically.
Learn More→Secure Data Storage
ISO 27001 certified cloud infrastructure ensures your sensitive research data is encrypted, backed up, and accessible only to authorized users.
Learn More→From Data to Discovery in Four Steps
Upload your molecular data and transform it into interactive, publication-ready visualizations in minutes.
Upload Data
Researchers upload molecular data files directly to the platform. Supported formats include standard biochemical datasets, enabling seamless integration with existing lab workflows.
Analyze
The platform processes your data using advanced algorithms, generating interactive visualizations of nanofilament networks and molecular structures in real-time.
Explore
Interact with the 3D molecular canvas to rotate, zoom, and examine nanofilament networks. Click individual nodes to reveal structural details and inter-fibril connectivity patterns.
Export
Generate publication-ready figures in PNG and SVG formats. Customize layouts, annotations, and color schemes to meet journal-specific requirements for your research articles.
Upload Data
Researchers upload molecular data files directly to the platform. Supported formats include standard biochemical datasets, enabling seamless integration with existing lab workflows.
Analyze
The platform processes your data using advanced algorithms, generating interactive visualizations of nanofilament networks and molecular structures in real-time.
Explore
Interact with the 3D molecular canvas to rotate, zoom, and examine nanofilament networks. Click individual nodes to reveal structural details and inter-fibril connectivity patterns.
Export
Generate publication-ready figures in PNG and SVG formats. Customize layouts, annotations, and color schemes to meet journal-specific requirements for your research articles.
Powerful Use Cases for Molecular Research
Discover how nova-ethanol empowers researchers to visualize and analyze complex biochemical structures across multiple disciplines.
Fibril Aggregation Studies
Investigate ion-mediated aggregation phenomena in real-time. Visualize how individual fibrils cluster under varying ionic conditions and identify critical aggregation thresholds for your research.
Explore→Nanofilament Network Dynamics
Model and explore the dynamic behavior of interconnected nanofilament networks. Track structural transitions, connectivity changes, and emergent patterns through interactive 3D visualization.
Explore→Tail Domain Analysis
Compare nanofilament networks with and without the tail domain to understand inter-fibril connectivity. Generate publication-ready figures that highlight structural differences for your articles.
Explore→Trusted by Leading Researchers
See how nova-ethanol empowers scientists at world-class institutions
Ready to Transform Your Research?
Join hundreds of researchers using nova-ethanol to visualize nanofilament networks and generate publication-ready figures today.
No comments yet. Be the first!