heroic-dollar
Dollar exchange rate to ils from jan 2025 to march 2026

Comments (0)
Sign in to leave a comment
Project Tasks19
Implement Theme & Color System
As a frontend developer, I want to implement the global theme and color system based on the mock-design pages so that all pages use consistent colors, typography, and spacing. Set up CSS variables/tokens for Deep Blue (#003366), Gold (#FFD700), Light Gray (#D3D3D3), and White (#FFFFFF). Apply Inter font family. Remove any scaffold pages not present in the design (welcome page, generic dashboard sub-pages not matching design). This task must be completed before any page implementation begins.
Implement Exchange Rate Data API
As a user, I want to use the backend API for exchange rate data so I can retrieve USD/ILS rates for the period January 2025 to March 2026. Implement FastAPI endpoints: GET /api/rates (with date range, chart type, and pagination filters), POST /api/rates (manual data entry), DELETE /api/rates/{id} (remove data point), GET /api/rates/stats (current, highest, lowest, data point count). Store data in MySQL with Alembic migrations. Include Palestine Standard Time (UTC+2) handling for all timestamps.
Build Landing Page
As a user, I want to use the Landing page so I can view the interactive 3D globe, see USD/ILS highlights, access quick-access shortcuts, and navigate to Login or Dashboard. Implement all sections based on the existing Landing (v2) JSX design: NavBar, HeroGlobe (WebGL/Three.js globe with Palestine-USA arc animation, particle background, animated gold shimmer), LiveRateTicker, KeyFeatures, HowItWorks, QuickAccess, ChartPreview, TrustStats, Testimonials, CallToAction, and Footer. Ensure full responsiveness across mobile, tablet, and desktop. References the Landing (v2) design.
Build Login Page
As a user, I want to use the Login page so I can sign in to access the dashboard or admin panel. Implement all sections based on the Login (v2) JSX design: NavBar (minimal), LoginSplit (two-panel split — left deep blue decorative panel with animated USD/ILS rate card and trust bullets, right white login form with email/password, show/hide toggle, remember me, forgot password, Google OAuth option), TrustBadges, and Footer. On mobile, left panel collapses to a slim branded header. Connects to auth backend API.
Build Dashboard Page
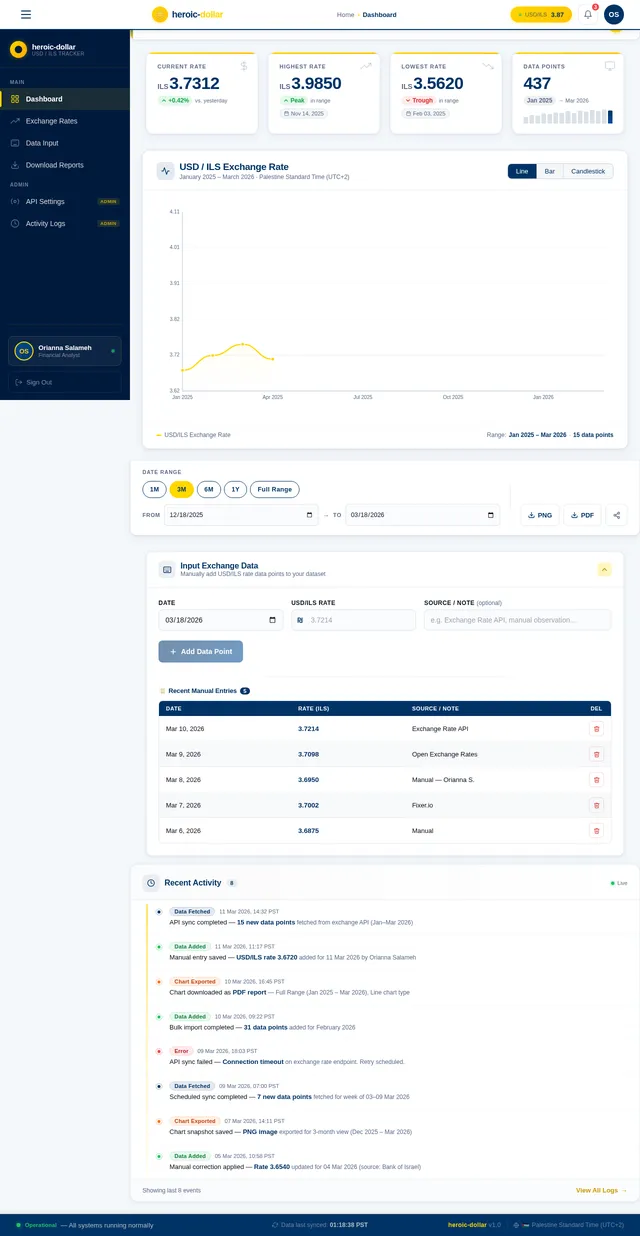
As a user, I want to use the Dashboard page so I can view the USD/ILS exchange rate chart, filter by date range, switch chart types (line, bar, candlestick), and download the chart. Implement all sections based on the Dashboard (v2) JSX design: TopBar, Sidebar, WelcomeBanner, StatsCards (Current Rate, Highest Rate, Lowest Rate, Data Points with sparkline), ChartPanel (interactive chart with tooltip), ChartControls (date range presets + custom range picker, export PNG/PDF), DataInputPanel (accordion form for manual entry + last 5 records table), RecentActivity, and StatusBar. Fully responsive.
Build Data Input Page
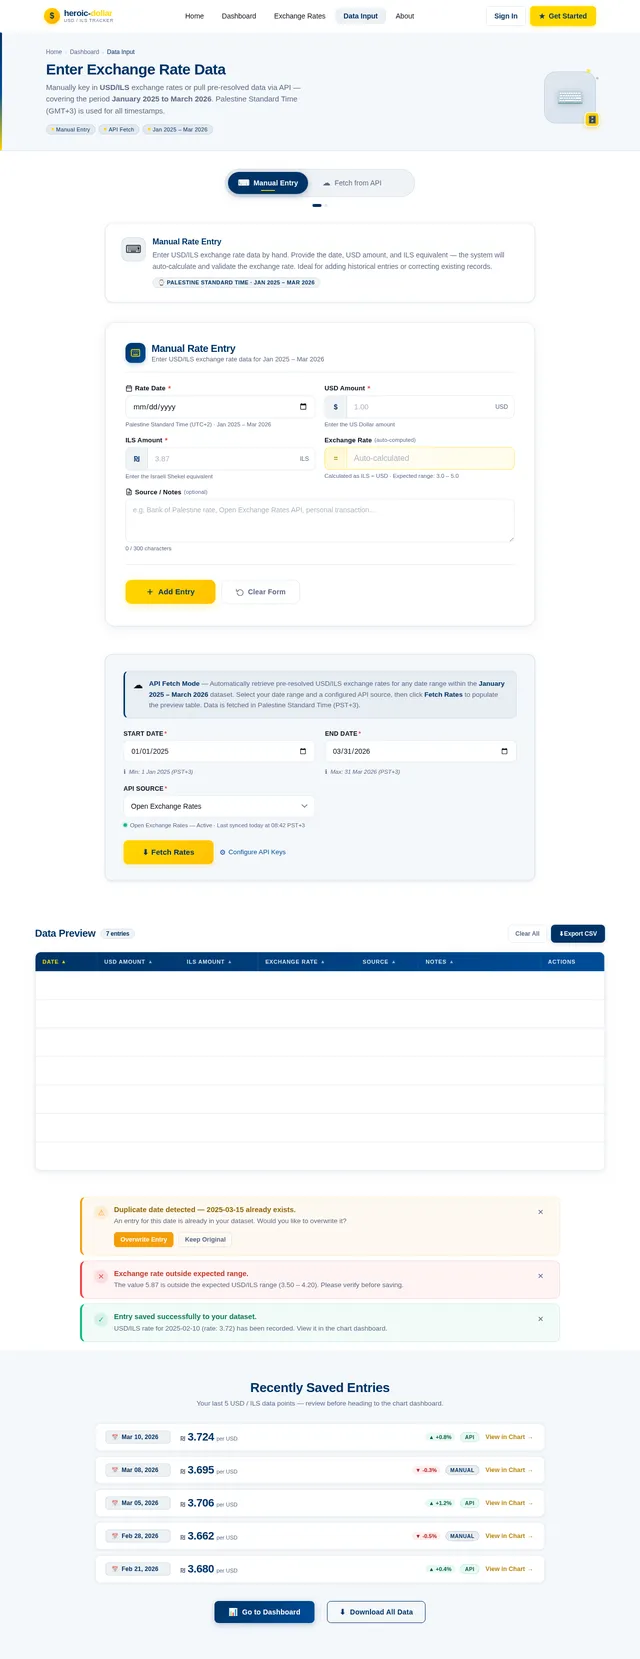
As a user, I want to use the Data Input page so I can manually enter USD/ILS exchange rate data points and trigger API data fetching. Implement all sections based on the Data Input (v2) JSX design: form with Date (PST default), USD/ILS Rate field, Source/Note field, submit button with validation, and a data table showing previously entered records with delete capability. Include API fetch trigger with status feedback. Fully responsive.
Build Admin Panel Page
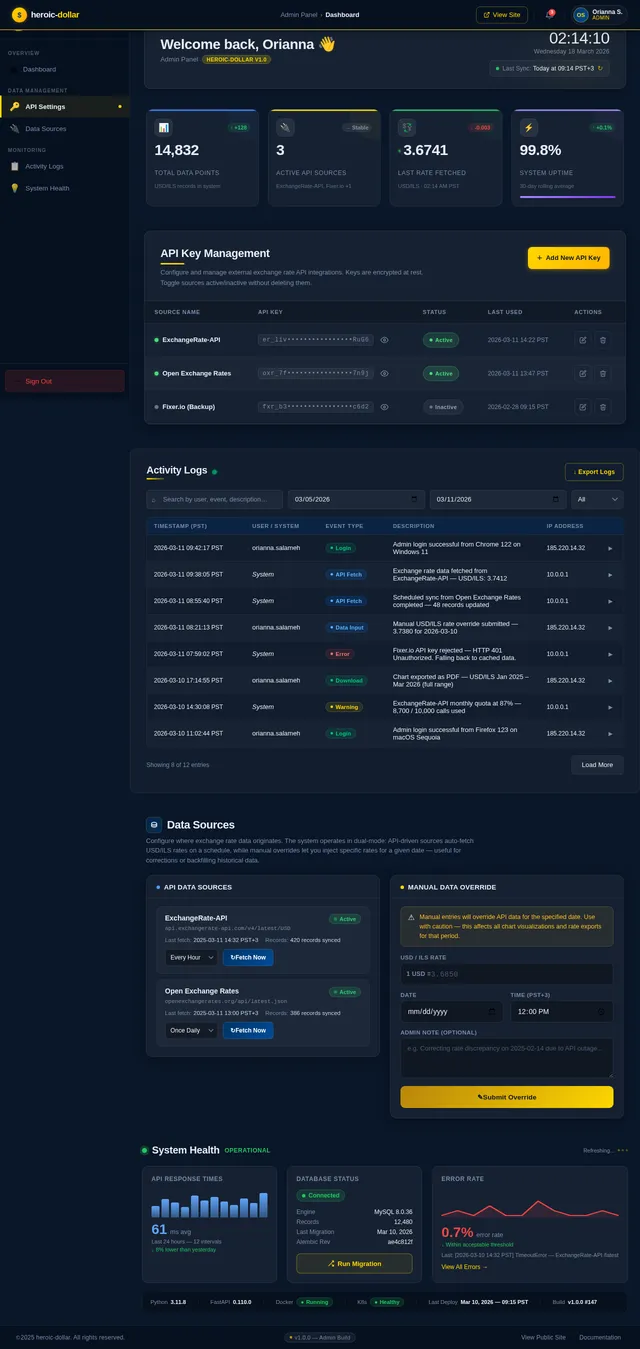
As an admin, I want to use the Admin Panel page so I can view a high-level dashboard of system status, user activity summaries, and navigate to API Settings or Activity Logs. Implement all sections based on the Admin Panel (v2) JSX design: TopBar with breadcrumb, Sidebar (with active Dashboard state), summary metric cards, quick-nav tiles to API Settings and Activity Logs, and StatusBar. Fully responsive.
Build Activity Logs Page
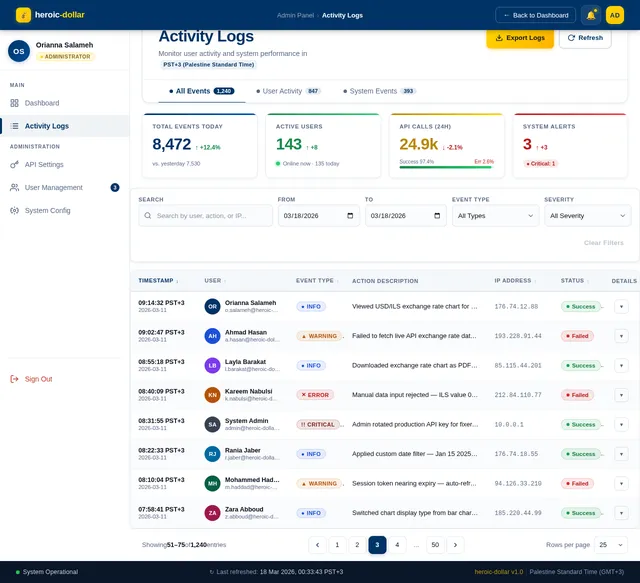
As an admin, I want to use the Activity Logs page so I can monitor user activity, filter logs by event type and severity, view performance metrics, and export logs. Implement all sections based on the Activity Logs (v2) JSX design: TopBar with breadcrumb, Sidebar (Activity Logs active state), PageHeader with export/refresh actions and category filter pills, PerformanceMetrics (4 stat cards with count-up animation), LogFiltersBar (search, date range, event type dropdown, severity dropdown), ActivityLogTable (sortable columns, expandable rows, mobile card layout), LogPagination, and StatusBar. Fully responsive.
Build API Settings Page
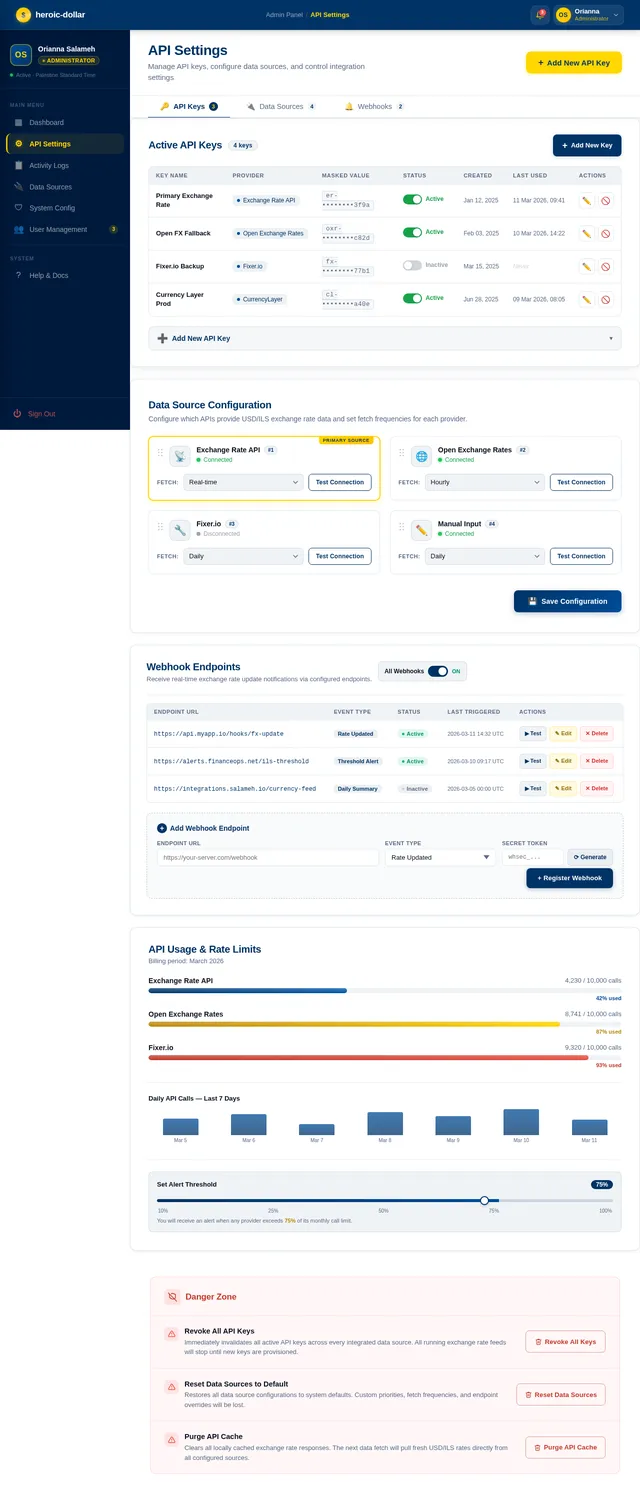
As an admin, I want to use the API Settings page so I can manage API keys, configure data sources, and set exchange rate data retrieval parameters. Implement all sections based on the API Settings (v2) JSX design: TopBar with breadcrumb, Sidebar (API Settings active state), API key management panel (create/revoke/copy keys), data source configuration form, connection status indicators, and StatusBar. Fully responsive.
Implement Chart Download API
As a user, I want to use the backend API for chart downloads so I can export the USD/ILS chart as a PNG image or PDF document. Implement FastAPI endpoints: POST /api/export/png and POST /api/export/pdf accepting chart data and date range parameters. Use server-side rendering or accept client-rendered canvas data. Return file as a downloadable response.
Implement External Rate Fetch API
As a user, I want to use the backend API for fetching pre-resolved exchange rates so the app can automatically retrieve USD/ILS rate data from an external source. Implement a FastAPI endpoint POST /api/rates/fetch that calls an external currency exchange API, stores the resolved rates for Jan 2025–Mar 2026 in MySQL, and returns a summary of imported records. Include error handling and duplicate prevention.
Implement Activity Logs API
As an admin, I want to use the backend API for activity logs so I can retrieve, filter, and paginate system and user activity events. Implement FastAPI endpoints: GET /api/admin/logs (with filters: event_type, severity, date_from, date_to, search, page, page_size), GET /api/admin/logs/stats (total events today, active users, API calls 24h, system alerts count). Log all significant actions (login, data input, chart export, API calls, errors) automatically.
Implement API Key Management API
As an admin, I want to use the backend API for API key management so I can create, revoke, and list API keys for external data source integrations. Implement FastAPI endpoints: GET /api/admin/api-keys, POST /api/admin/api-keys (generate new key), DELETE /api/admin/api-keys/{id} (revoke), PATCH /api/admin/api-keys/{id} (update label/config). Store keys securely with hashing. Include data source configuration endpoints: GET/POST/PATCH /api/admin/data-sources.
Implement Live Rate Ticker API
As a user, I want to use the backend API for a live USD/ILS rate ticker so the Landing page and Dashboard TopBar can display the current rate with 24h change and last-updated timestamp. Implement GET /api/rates/live returning the most recent rate, delta from previous day (value and percentage), and last updated timestamp in PST. Cache the result for 60 seconds to avoid redundant DB queries.
Connect Dashboard to Backend APIs
As a user, I want the Dashboard page to be connected to live backend APIs so I can view real USD/ILS chart data, stats, and perform data operations. Wire StatsCards to GET /api/rates/stats, ChartPanel to GET /api/rates with date/type filters, ChartControls to trigger filtered queries, DataInputPanel to POST /api/rates, and chart download buttons to POST /api/export/png and /api/export/pdf. Implement loading states, error handling, and PST timezone display.
Connect Data Input Page to API
As a user, I want the Data Input page to be connected to live backend APIs so I can submit manual exchange rate entries and trigger external data fetches. Wire the manual entry form to POST /api/rates, the API fetch button to POST /api/rates/fetch, and the records table to GET /api/rates with pagination. Show success/error toast notifications and refresh table on submission.
Connect Activity Logs Page to API
As an admin, I want the Activity Logs page to be connected to live backend APIs so I can view real-time filtered logs and performance metrics. Wire PerformanceMetrics to GET /api/admin/logs/stats, LogFiltersBar controls to GET /api/admin/logs with filter params, ActivityLogTable to paginated log data, and LogPagination to page controls. Wire the export button to a log export endpoint.
Connect API Settings Page to API
As an admin, I want the API Settings page to be connected to live backend APIs so I can create, view, and revoke API keys and manage data source configurations. Wire API key list to GET /api/admin/api-keys, create key form to POST /api/admin/api-keys, revoke action to DELETE /api/admin/api-keys/{id}, and data source config form to GET/POST/PATCH /api/admin/data-sources. Show connection status indicators.
Connect Landing Page Live Rate
As a user, I want the Landing page LiveRateTicker and HeroGlobe tooltip to display real USD/ILS rate data so I can see the current exchange rate on the homepage. Wire the LiveRateTicker marquee to GET /api/rates/live and update the HeroGlobe Palestine tooltip sparkline and rate display with live data. Implement auto-refresh every 60 seconds.
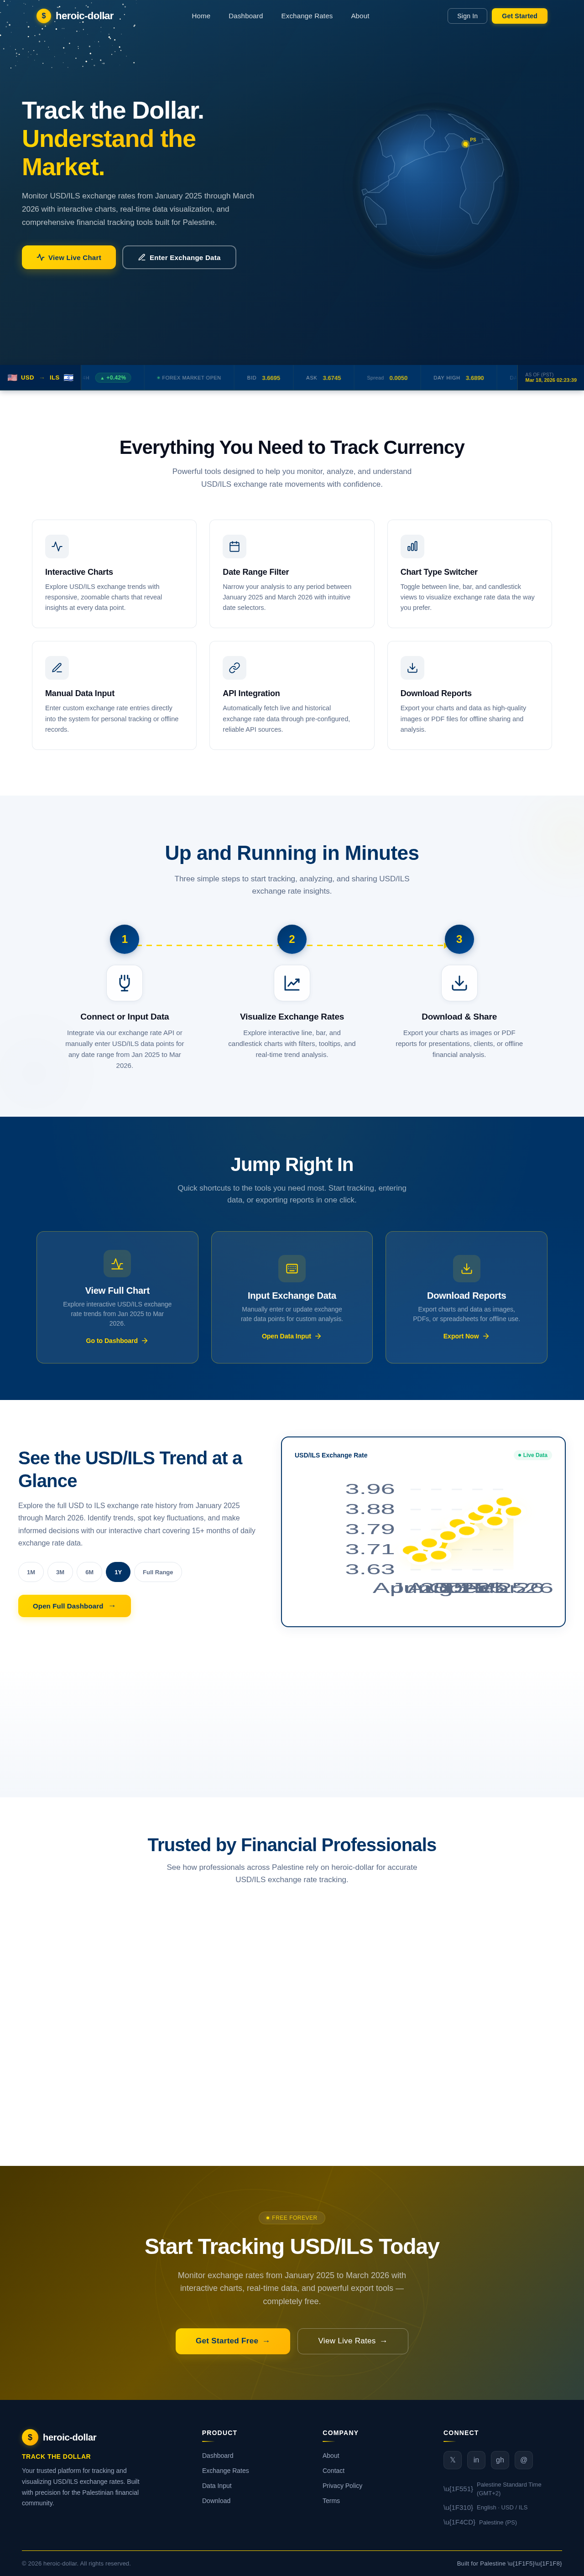
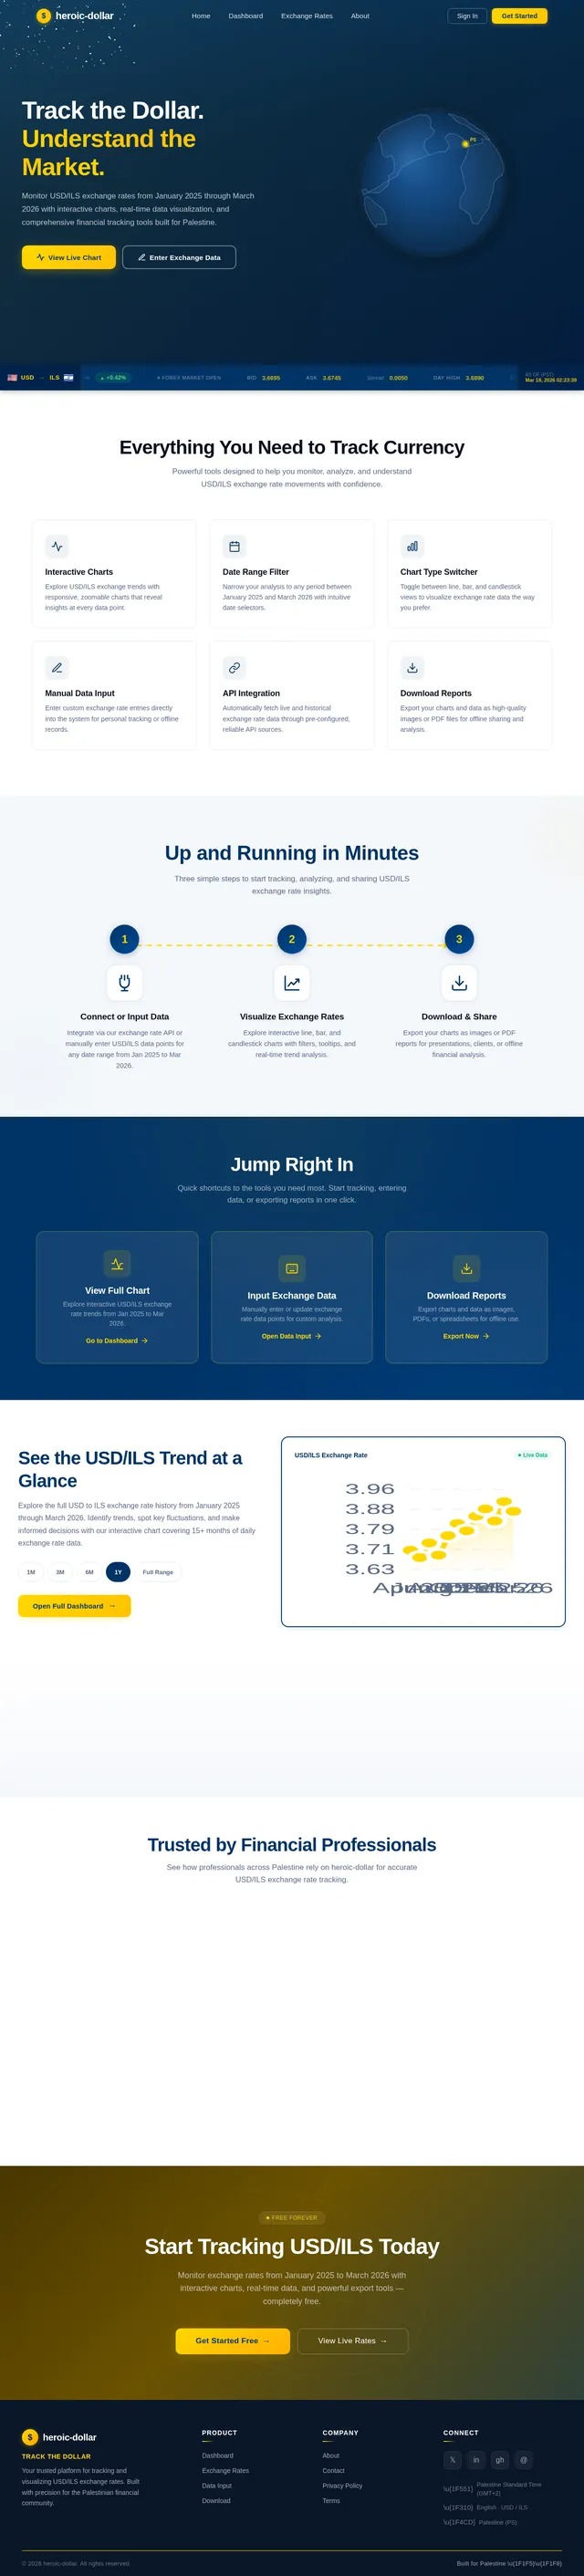
Track the Dollar. Understand the Market.
Monitor USD/ILS exchange rates from January 2025 through March 2026 with interactive charts, real-time data visualization, and comprehensive financial tracking tools built for Palestine.
Everything You Need to Track Currency
Powerful tools designed to help you monitor, analyze, and understand USD/ILS exchange rate movements with confidence.
Interactive Charts
Explore USD/ILS exchange trends with responsive, zoomable charts that reveal insights at every data point.
Date Range Filter
Narrow your analysis to any period between January 2025 and March 2026 with intuitive date selectors.
Chart Type Switcher
Toggle between line, bar, and candlestick views to visualize exchange rate data the way you prefer.
Manual Data Input
Enter custom exchange rate entries directly into the system for personal tracking or offline records.
API Integration
Automatically fetch live and historical exchange rate data through pre-configured, reliable API sources.
Download Reports
Export your charts and data as high-quality images or PDF files for offline sharing and analysis.
Up and Running in Minutes
Three simple steps to start tracking, analyzing, and sharing USD/ILS exchange rate insights.
Connect or Input Data
Integrate via our exchange rate API or manually enter USD/ILS data points for any date range from Jan 2025 to Mar 2026.
Visualize Exchange Rates
Explore interactive line, bar, and candlestick charts with filters, tooltips, and real-time trend analysis.
Download & Share
Export your charts as images or PDF reports for presentations, clients, or offline financial analysis.
Jump Right In
Quick shortcuts to the tools you need most. Start tracking, entering data, or exporting reports in one click.
View Full Chart
Explore interactive USD/ILS exchange rate trends from Jan 2025 to Mar 2026.
Go to DashboardInput Exchange Data
Manually enter or update exchange rate data points for custom analysis.
Open Data InputDownload Reports
Export charts and data as images, PDFs, or spreadsheets for offline use.
Export NowSee the USD/ILS Trend at a Glance
Explore the full USD to ILS exchange rate history from January 2025 through March 2026. Identify trends, spot key fluctuations, and make informed decisions with our interactive chart covering 15+ months of daily exchange rate data.
Trusted by Financial Professionals
See how professionals across Palestine rely on heroic-dollar for accurate USD/ILS exchange rate tracking.
heroic-dollar completely transformed how I track USD/ILS exchange rates. The interactive charts and date filtering make it effortless to spot trends across the entire Jan 2025 to March 2026 period.
As someone who deals with cross-border transactions daily, having real-time exchange data with multiple chart types is invaluable. The download feature saves me hours of manual reporting every week.
The API integration and manual data input options give me the flexibility I need. Being able to switch between line, bar, and candlestick charts helps me make better-informed exchange decisions.
Used By
Start Tracking USD/ILS Today
Monitor exchange rates from January 2025 to March 2026 with interactive charts, real-time data, and powerful export tools — completely free.
No comments yet. Be the first!