heroic-dollar
Dollar exchange rate to ils from jan 2025 to march 2026

Comments (0)
Sign in to leave a comment
System Requirements
System Requirements Document (SRD) for heroic-dollar
1. Introduction
The heroic-dollar project is a web application designed to provide users with tools to track and visualize currency exchange rates, specifically focusing on the exchange rate between the US Dollar (USD) and Israeli Shekel (ILS) for the period of January 2025 to March 2026. This document outlines the system requirements for the project, ensuring it meets the needs of Orianna Salameh and her target audience in Palestine (PS). The application will feature responsive design, interactive charts, and data input capabilities.
2. System Overview
The heroic-dollar system will serve as a currency exchange tracker and financial analysis tool. It will allow users to input, retrieve, and visualize exchange rate data between USD and ILS. The system will leverage APIs to fetch pre-resolved exchange rate data and display it in an intuitive and interactive chart format. The application will be accessible via web browsers and optimized for both desktop and mobile devices.
Key features include:
- Interactive chart visualization for exchange rates.
- Data input capabilities for manual or API-driven data.
- Responsive design for seamless user experience across devices.
- Locale-specific defaults tailored for Palestine (PS), including currency formatting and timezone settings.
3. Functional Requirements
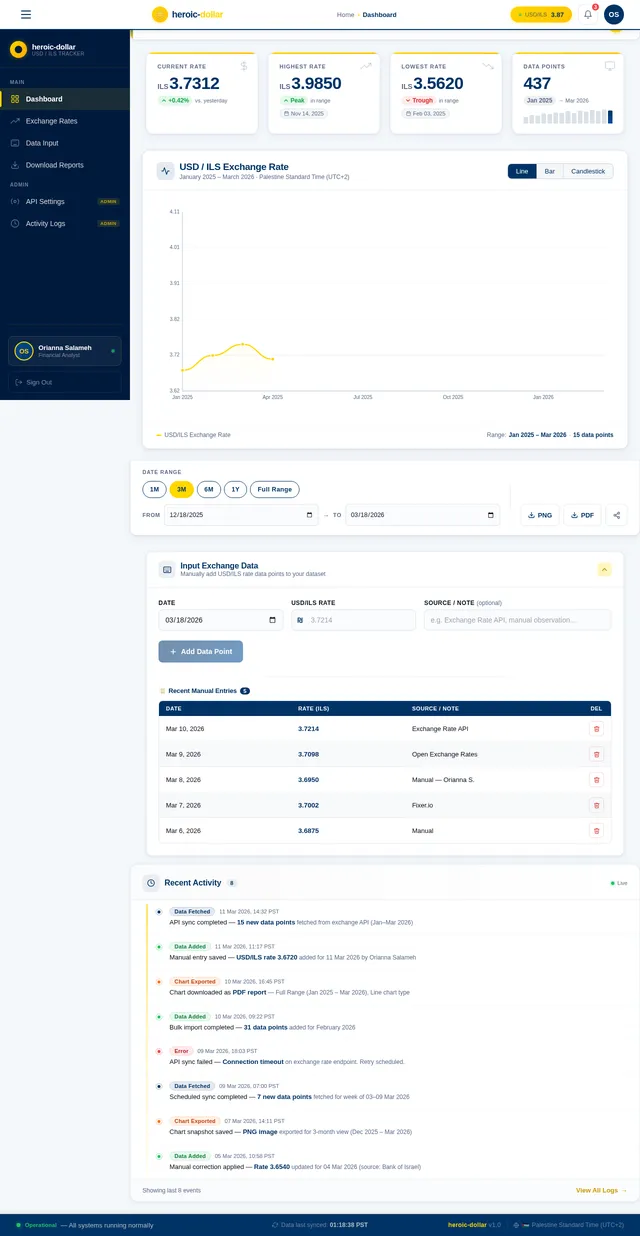
- As User, I should be able to view a chart displaying the exchange rate between USD and ILS for the period of January 2025 to March 2026.
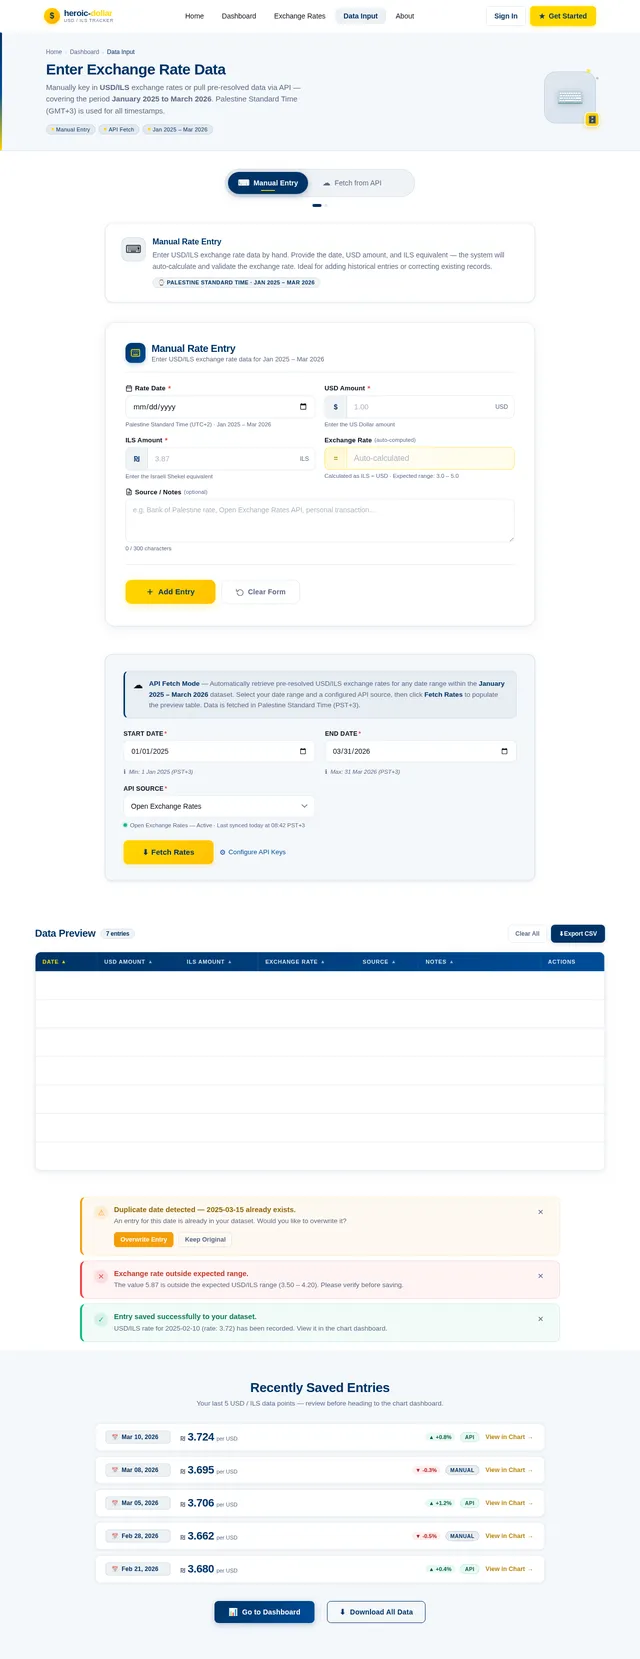
- As User, I should be able to input custom exchange rate data manually.
- As User, I should be able to fetch pre-resolved exchange rate data via an API.
- As User, I should be able to download the chart as an image or PDF for offline use.
- As User, I should be able to filter the chart data by specific date ranges within the given period.
- As User, I should be able to switch between different chart types (e.g., line chart, bar chart, candlestick chart).
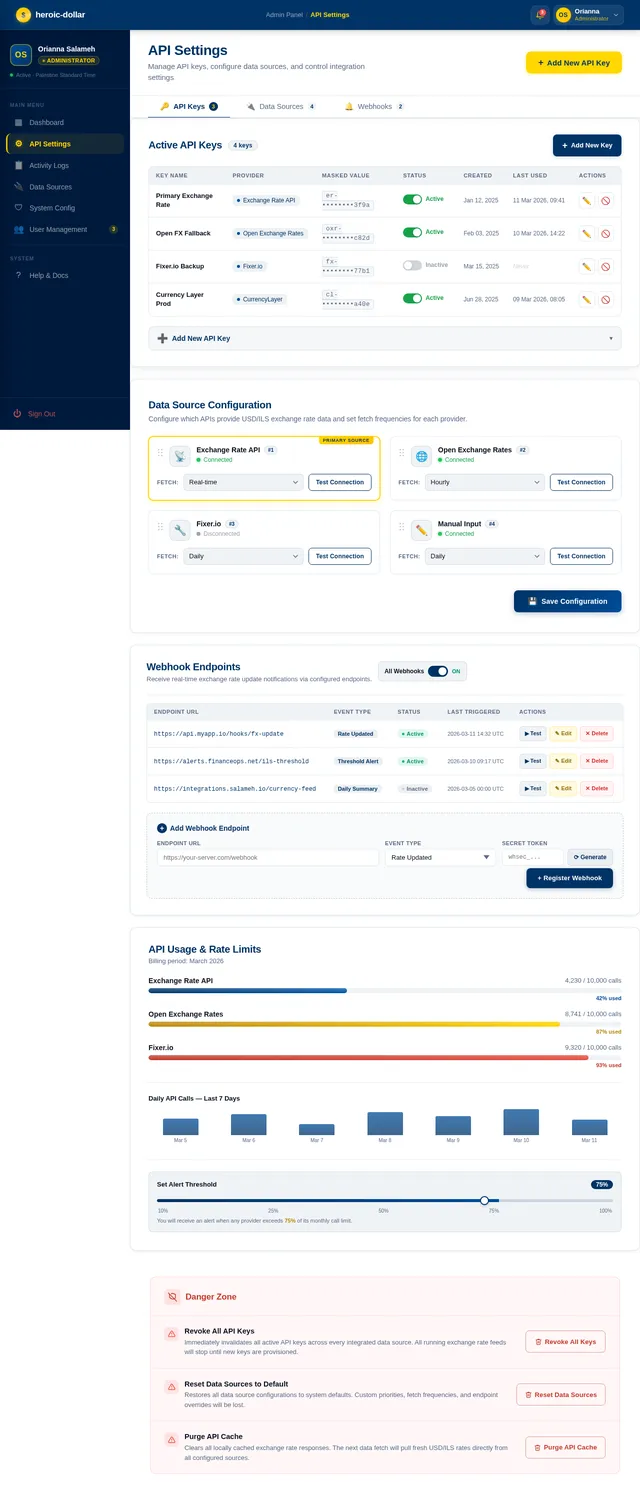
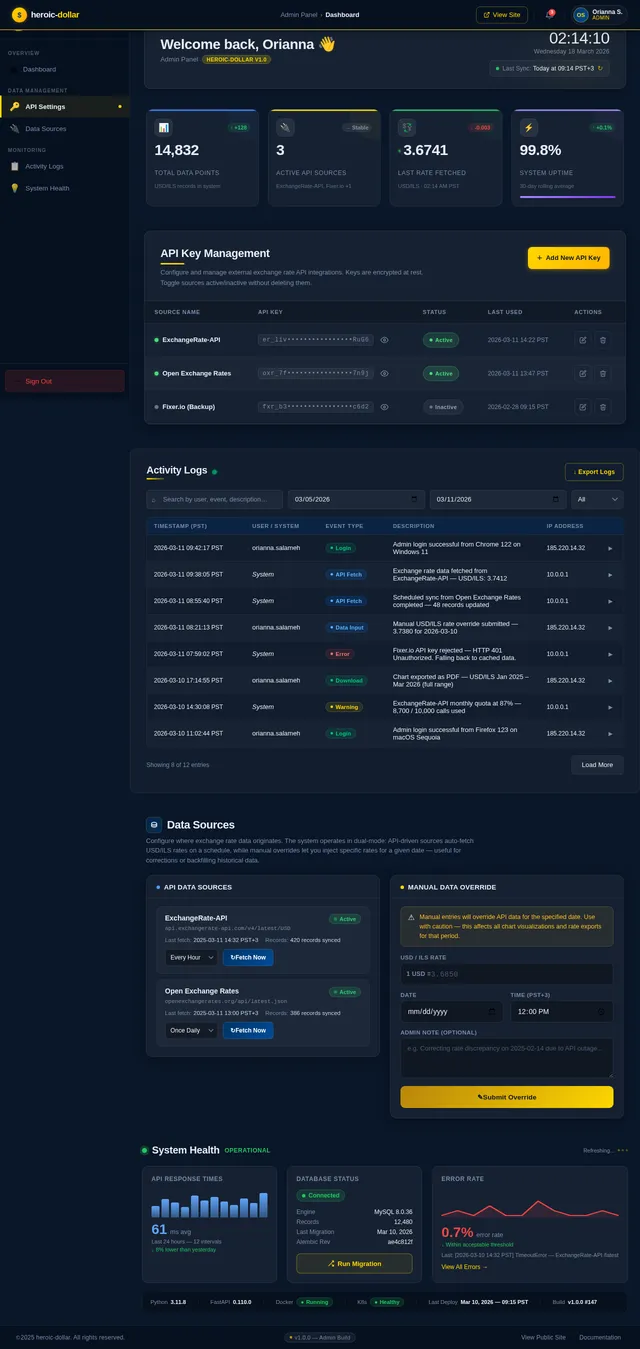
- As Admin, I should be able to manage API keys and configure data sources.
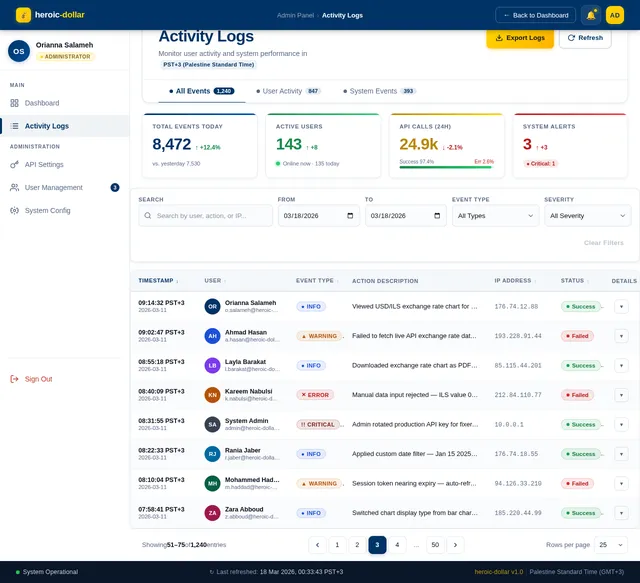
- As Admin, I should be able to monitor system performance and user activity logs.
4. User Personas
4.1 User
- Primary audience interested in tracking USD to ILS exchange rates.
- May include financial analysts, business owners, or individuals planning currency exchanges.
- Requires intuitive chart visualizations and responsive design.
4.2 Admin
- Responsible for managing the backend, API integrations, and system configurations.
- Ensures data accuracy and system reliability.
5. Visuals Colors and Theme
The heroic-dollar application will feature a professional and modern design with the following color palette:
- Primary Color: Deep Blue (#003366) – Represents trust and financial stability.
- Secondary Color: Gold (#FFD700) – Symbolizes currency and wealth.
- Accent Color: Light Gray (#D3D3D3) – Provides balance and neutrality.
- Background Color: White (#FFFFFF) – Ensures clarity and readability.
The theme will focus on clean, minimalistic design with sharp contrasts for data visualization. Charts will use vibrant colors to differentiate data points effectively.
6. Signature Design Concept
The heroic-dollar homepage will feature an interactive 3D globe that dynamically displays exchange rate trends across different regions. Users will see the USD to ILS exchange rate highlighted prominently on the globe, with animated lines connecting Palestine to the United States.
Details:
- The globe will rotate slowly, allowing users to interact by dragging or zooming to focus on specific regions.
- Hovering over Palestine will display a tooltip with the current exchange rate and a mini chart preview.
- The background will feature a subtle gradient animation transitioning between deep blue and gold, symbolizing financial growth and stability.
- Micro-interactions will include smooth transitions when switching between chart types and a glowing effect on buttons when hovered.
- The landing page will also include a "Quick Access" section with shortcuts to view the full chart, input data, or download reports.
This bold and interactive design will captivate users and make the homepage unforgettable.
7. Non-Functional Requirements
- The system must support high responsiveness across devices (desktop, tablet, mobile).
- The application must load charts within 2 seconds for optimal user experience.
- The system must ensure data security, especially for API integrations and user input.
- The application must comply with locale-specific standards for currency formatting and timezone settings (Palestine Standard Time).
8. Tech Stack
Frontend
- React for Web
Backend
- Python
- FastAPI
Database
- MySQL (preferred) or MariaDB with Alembic for migrations.
AI Models
- GPT 5.2 for user-friendly responses.
- Google Nano Banana for image generation (e.g., chart previews).
AI Tools
- Litellm for LLM Routing.
- Langchain for advanced AI workflows.
Local Orchestration
- Docker
- docker-compose
Server-Side Orchestration
- Kubernetes
9. Assumptions and Constraints
- The exchange rate data for USD to ILS from January 2025 to March 2026 will be available via APIs or manual input.
- The application will primarily target users in Palestine, with locale-specific defaults.
- The system will require internet connectivity for API data retrieval.
- The application will be optimized for modern browsers (Chrome, Firefox, Safari, Edge).
10. Glossary
- USD: United States Dollar.
- ILS: Israeli Shekel.
- API: Application Programming Interface, used for data retrieval.
- Responsive Design: A design approach ensuring optimal user experience across devices.
- Locale-Specific Defaults: Settings tailored to a specific region, such as currency formatting and timezone.
This document outlines the updated requirements for the heroic-dollar project, incorporating the requested chart feature and ensuring a user-friendly, visually appealing, and technically robust application. Orianna, we hope this meets your expectations and provides a solid foundation for your project!
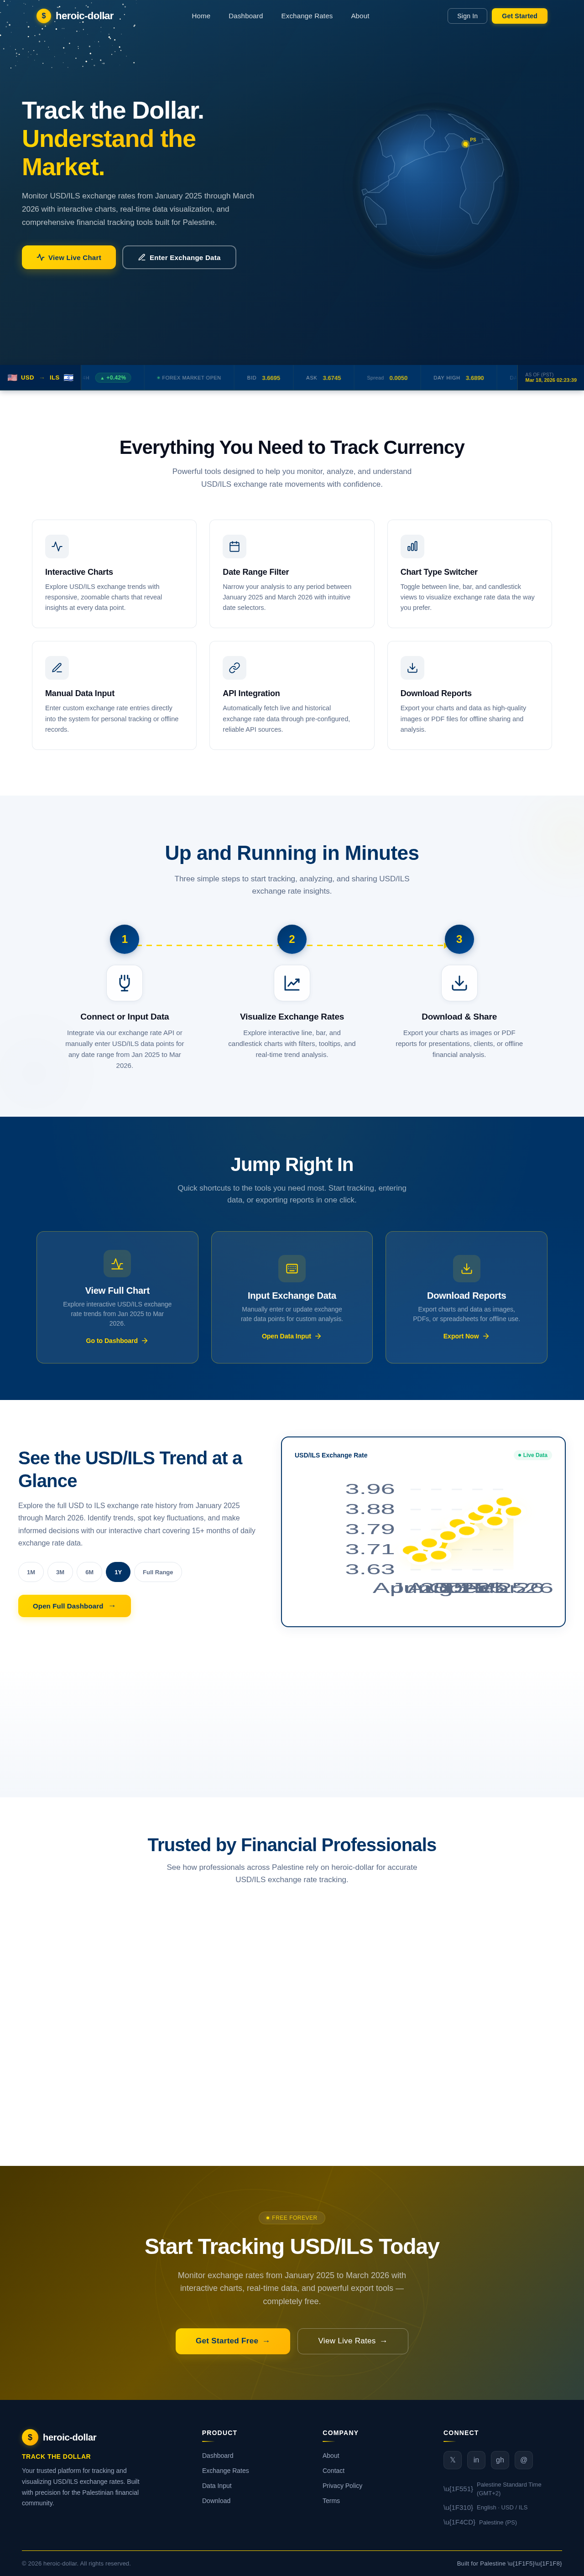
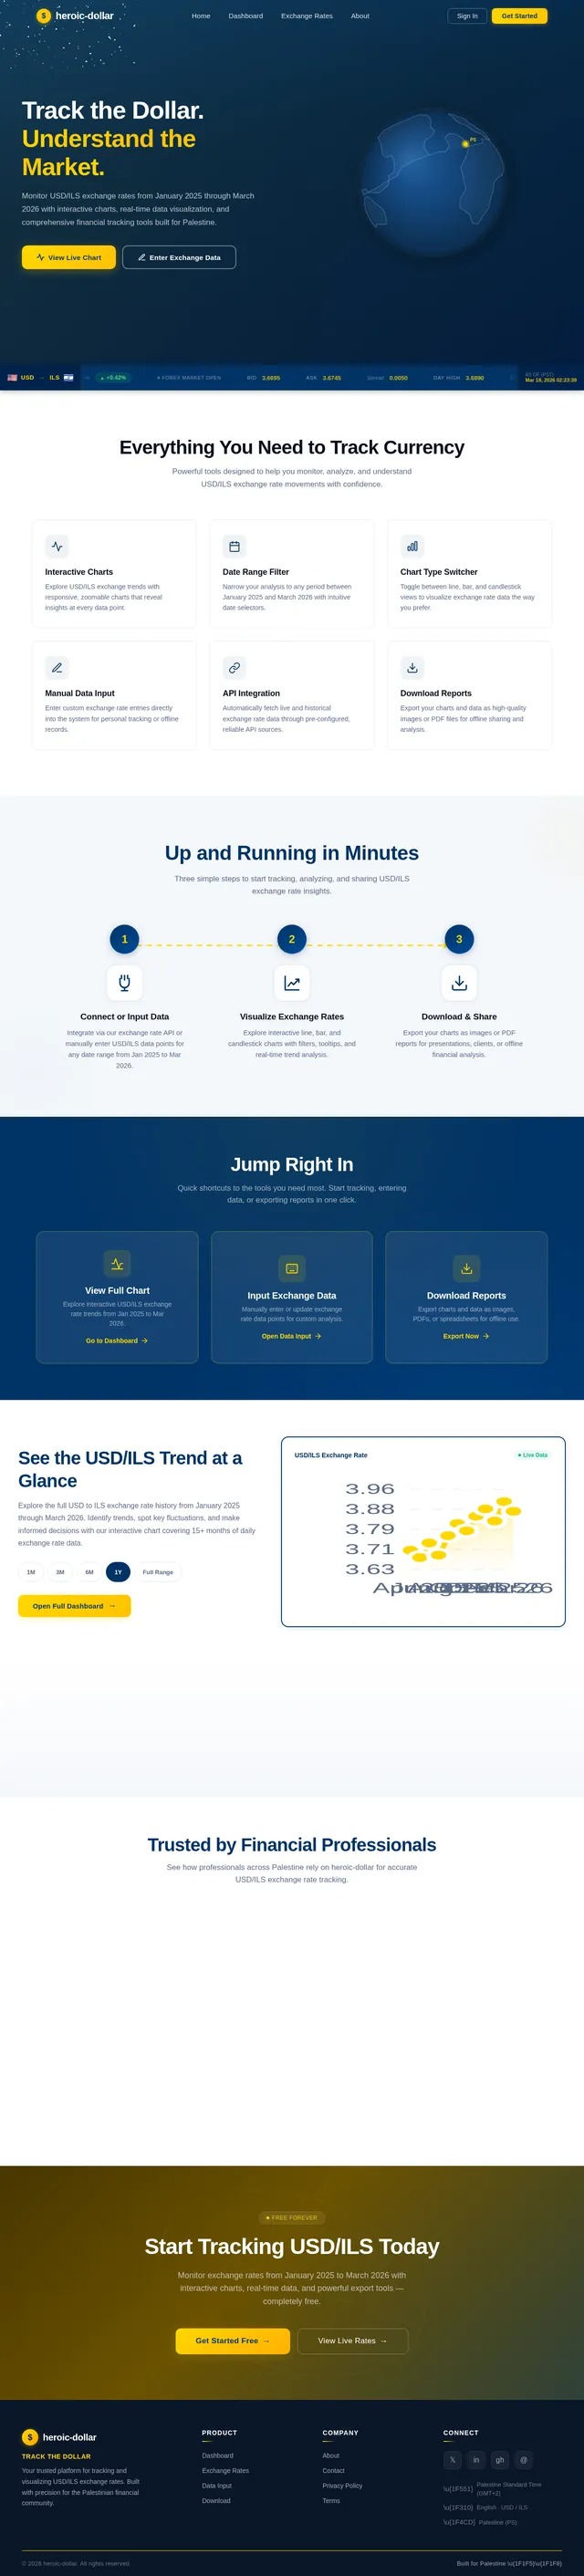
Track the Dollar. Understand the Market.
Monitor USD/ILS exchange rates from January 2025 through March 2026 with interactive charts, real-time data visualization, and comprehensive financial tracking tools built for Palestine.
Everything You Need to Track Currency
Powerful tools designed to help you monitor, analyze, and understand USD/ILS exchange rate movements with confidence.
Interactive Charts
Explore USD/ILS exchange trends with responsive, zoomable charts that reveal insights at every data point.
Date Range Filter
Narrow your analysis to any period between January 2025 and March 2026 with intuitive date selectors.
Chart Type Switcher
Toggle between line, bar, and candlestick views to visualize exchange rate data the way you prefer.
Manual Data Input
Enter custom exchange rate entries directly into the system for personal tracking or offline records.
API Integration
Automatically fetch live and historical exchange rate data through pre-configured, reliable API sources.
Download Reports
Export your charts and data as high-quality images or PDF files for offline sharing and analysis.
Up and Running in Minutes
Three simple steps to start tracking, analyzing, and sharing USD/ILS exchange rate insights.
Connect or Input Data
Integrate via our exchange rate API or manually enter USD/ILS data points for any date range from Jan 2025 to Mar 2026.
Visualize Exchange Rates
Explore interactive line, bar, and candlestick charts with filters, tooltips, and real-time trend analysis.
Download & Share
Export your charts as images or PDF reports for presentations, clients, or offline financial analysis.
Jump Right In
Quick shortcuts to the tools you need most. Start tracking, entering data, or exporting reports in one click.
View Full Chart
Explore interactive USD/ILS exchange rate trends from Jan 2025 to Mar 2026.
Go to DashboardInput Exchange Data
Manually enter or update exchange rate data points for custom analysis.
Open Data InputDownload Reports
Export charts and data as images, PDFs, or spreadsheets for offline use.
Export NowSee the USD/ILS Trend at a Glance
Explore the full USD to ILS exchange rate history from January 2025 through March 2026. Identify trends, spot key fluctuations, and make informed decisions with our interactive chart covering 15+ months of daily exchange rate data.
Trusted by Financial Professionals
See how professionals across Palestine rely on heroic-dollar for accurate USD/ILS exchange rate tracking.
heroic-dollar completely transformed how I track USD/ILS exchange rates. The interactive charts and date filtering make it effortless to spot trends across the entire Jan 2025 to March 2026 period.
As someone who deals with cross-border transactions daily, having real-time exchange data with multiple chart types is invaluable. The download feature saves me hours of manual reporting every week.
The API integration and manual data input options give me the flexibility I need. Being able to switch between line, bar, and candlestick charts helps me make better-informed exchange decisions.
Used By
Start Tracking USD/ILS Today
Monitor exchange rates from January 2025 to March 2026 with interactive charts, real-time data, and powerful export tools — completely free.
No comments yet. Be the first!