heroic-dollar
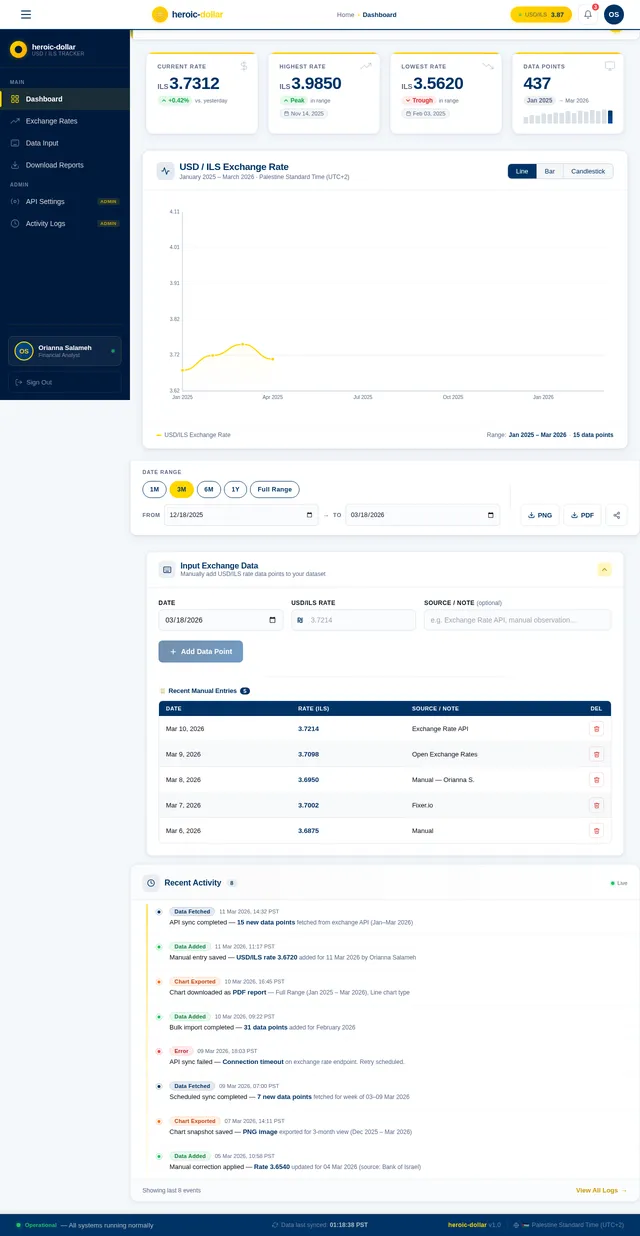
Dollar exchange rate to ils from jan 2025 to march 2026

Comments (0)
Sign in to leave a comment

Exchange Rate API key expires in 3 days
5 min ago
Rate limit reached 80% for Open Exchange Rates
42 min ago
Webhook endpoint responded with error 502
2 hours ago
USD/ILS data sync completed successfully
Yesterday
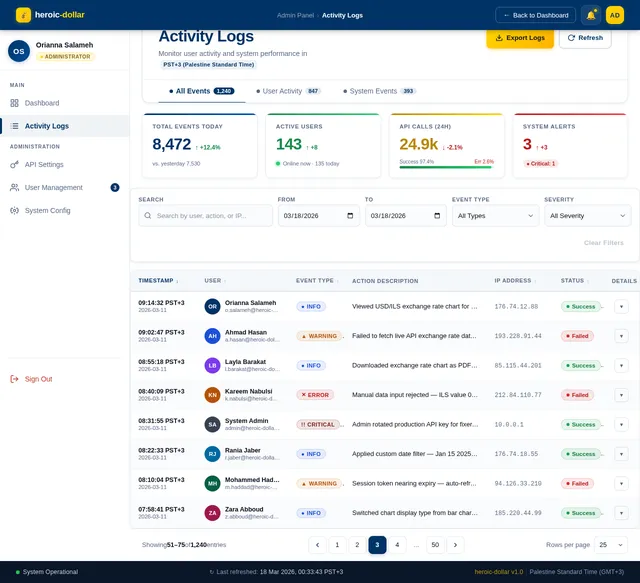
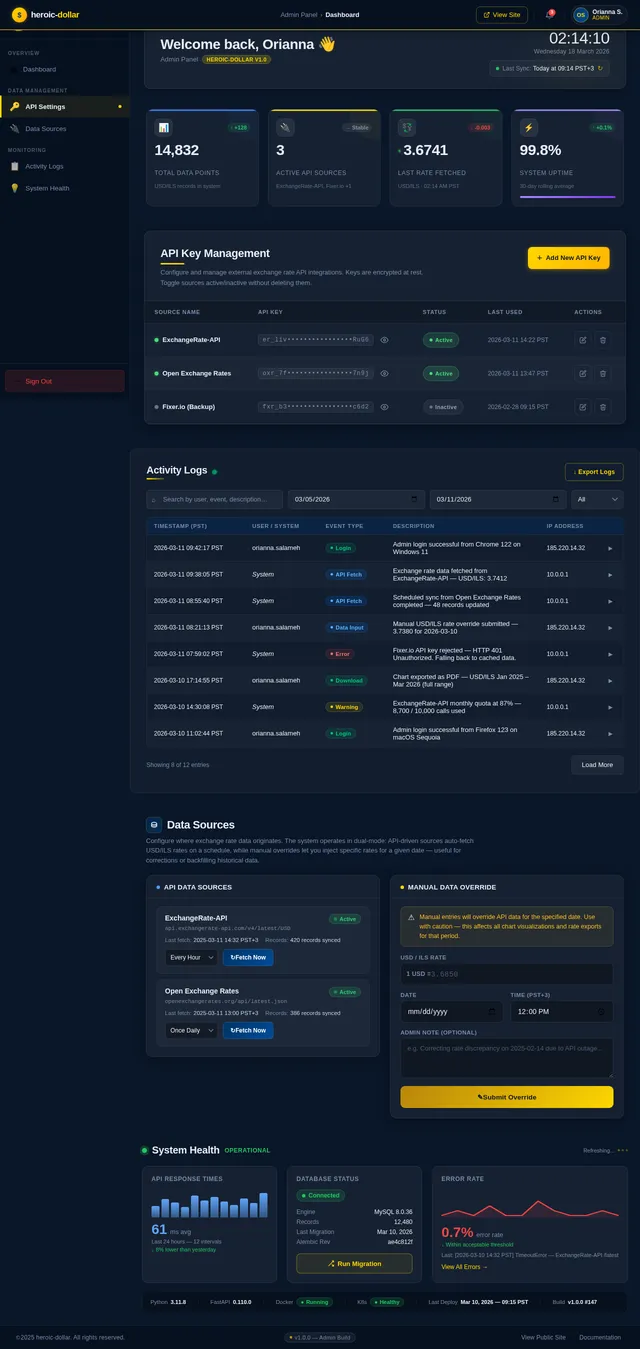
Orianna Salameh
admin@heroic-dollar.ps
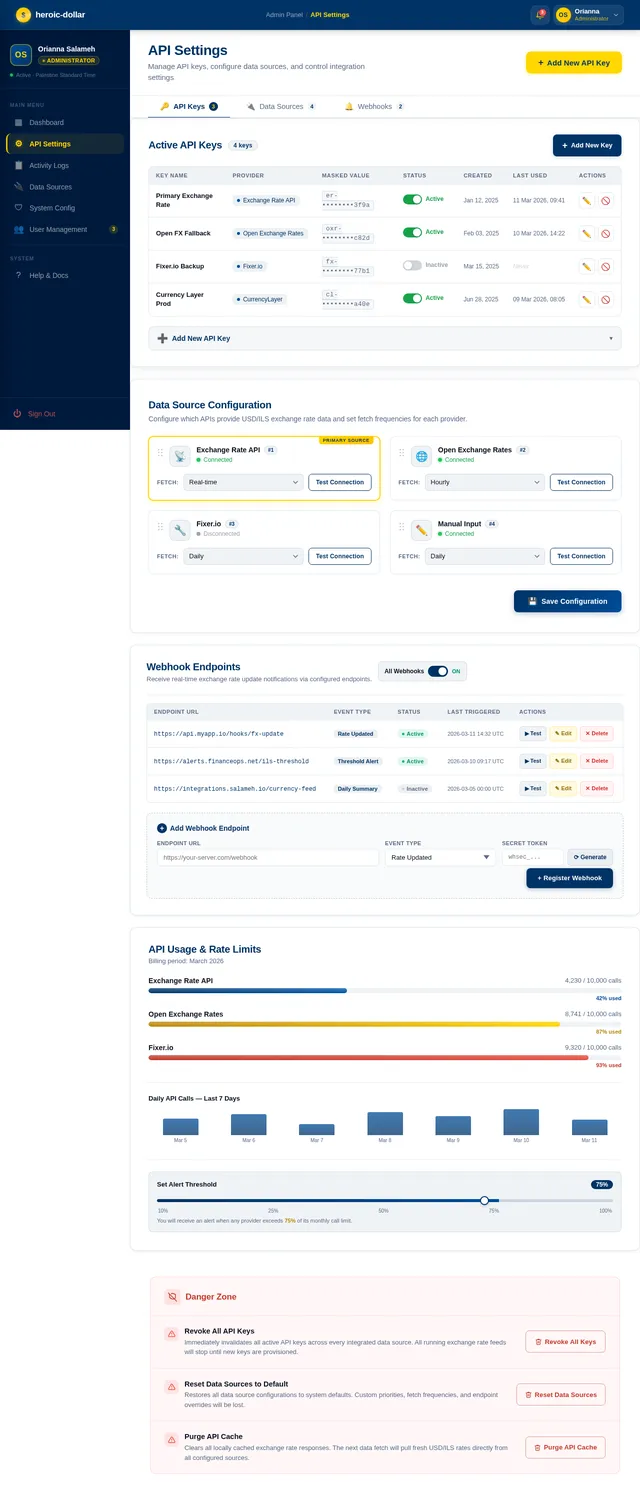
API Settings
Manage API keys, configure data sources, and control integration settings
Active API Keys
4 keys| Key Name | Provider | Masked Value | Status | Created | Last Used | Actions |
|---|---|---|---|---|---|---|
| Primary Exchange Rate | Exchange Rate API | er-••••••••3f9a | Jan 12, 2025 | 11 Mar 2026, 09:41 | ||
| Open FX Fallback | Open Exchange Rates | oxr-••••••••c82d | Feb 03, 2025 | 10 Mar 2026, 14:22 | ||
| Fixer.io Backup | Fixer.io | fx-••••••••77b1 | Mar 15, 2025 | Never | ||
| Currency Layer Prod | CurrencyLayer | cl-••••••••a40e | Jun 28, 2025 | 09 Mar 2026, 08:05 |
Data Source Configuration
Configure which APIs provide USD/ILS exchange rate data and set fetch frequencies for each provider.
Webhook Endpoints
Receive real-time exchange rate update notifications via configured endpoints.
| Endpoint URL | Event Type | Status | Last Triggered | Actions |
|---|---|---|---|---|
| https://api.myapp.io/hooks/fx-update | Rate Updated | Active | ||
| https://alerts.financeops.net/ils-threshold | Threshold Alert | Active | ||
| https://integrations.salameh.io/currency-feed | Daily Summary | Inactive |
Add Webhook Endpoint
API Usage & Rate Limits
Billing period: March 2026
You will receive an alert when any provider exceeds 75% of its monthly call limit.
Danger Zone
Revoke All API Keys
Immediately invalidates all active API keys across every integrated data source. All running exchange rate feeds will stop until new keys are provisioned.
Reset Data Sources to Default
Restores all data source configurations to system defaults. Custom priorities, fetch frequencies, and endpoint overrides will be lost.
Purge API Cache
Clears all locally cached exchange rate responses. The next data fetch will pull fresh USD/ILS rates directly from all configured sources.
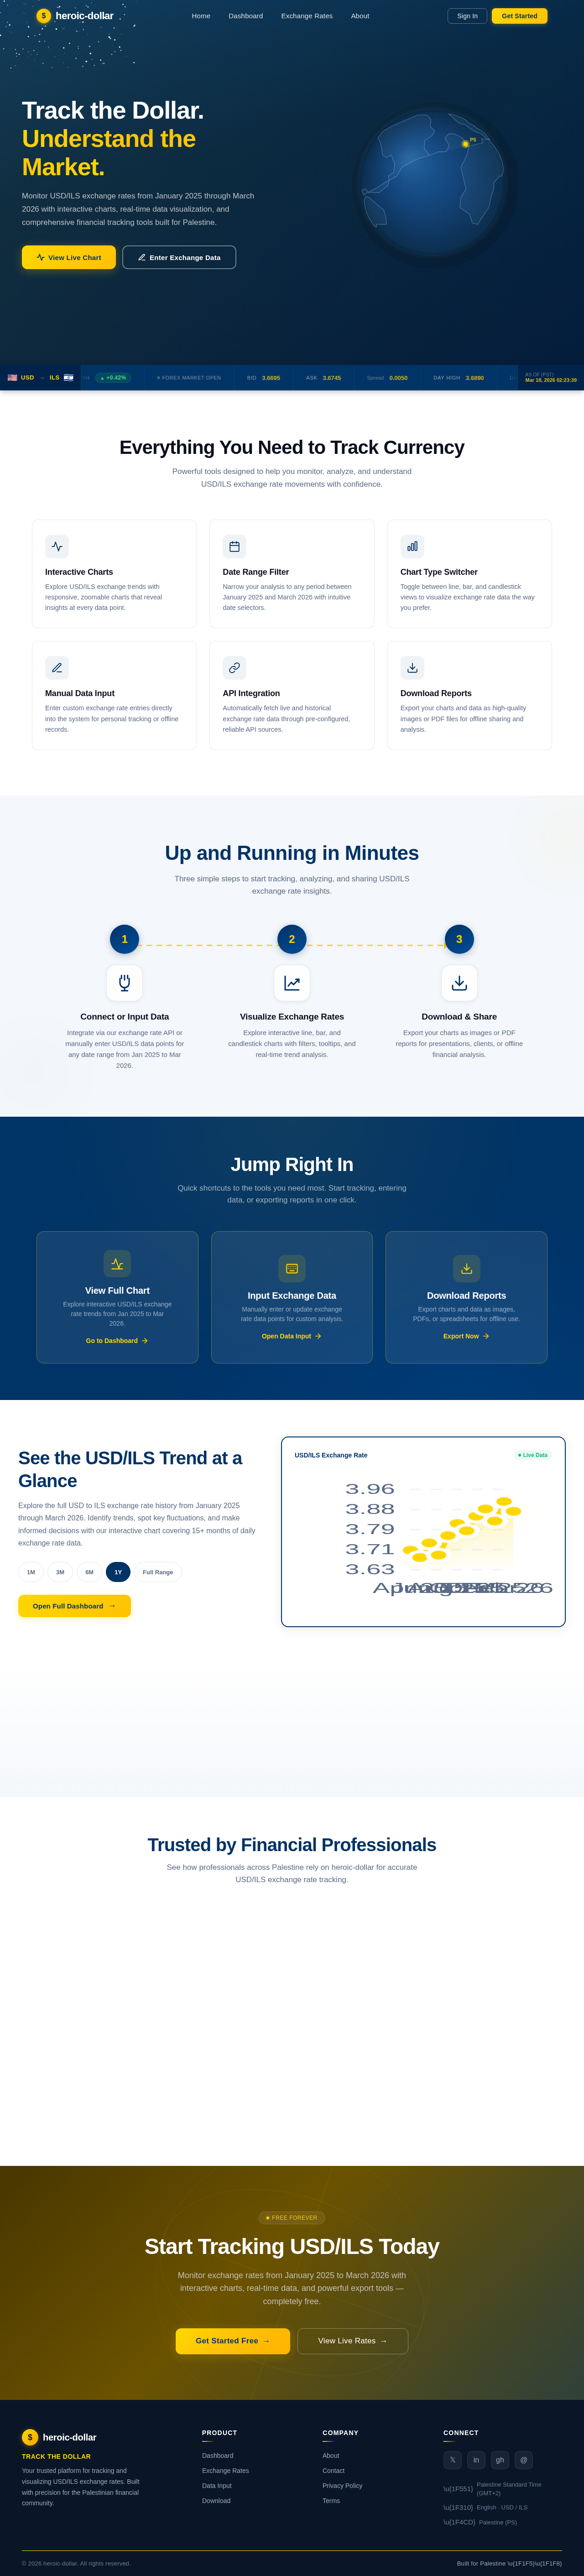
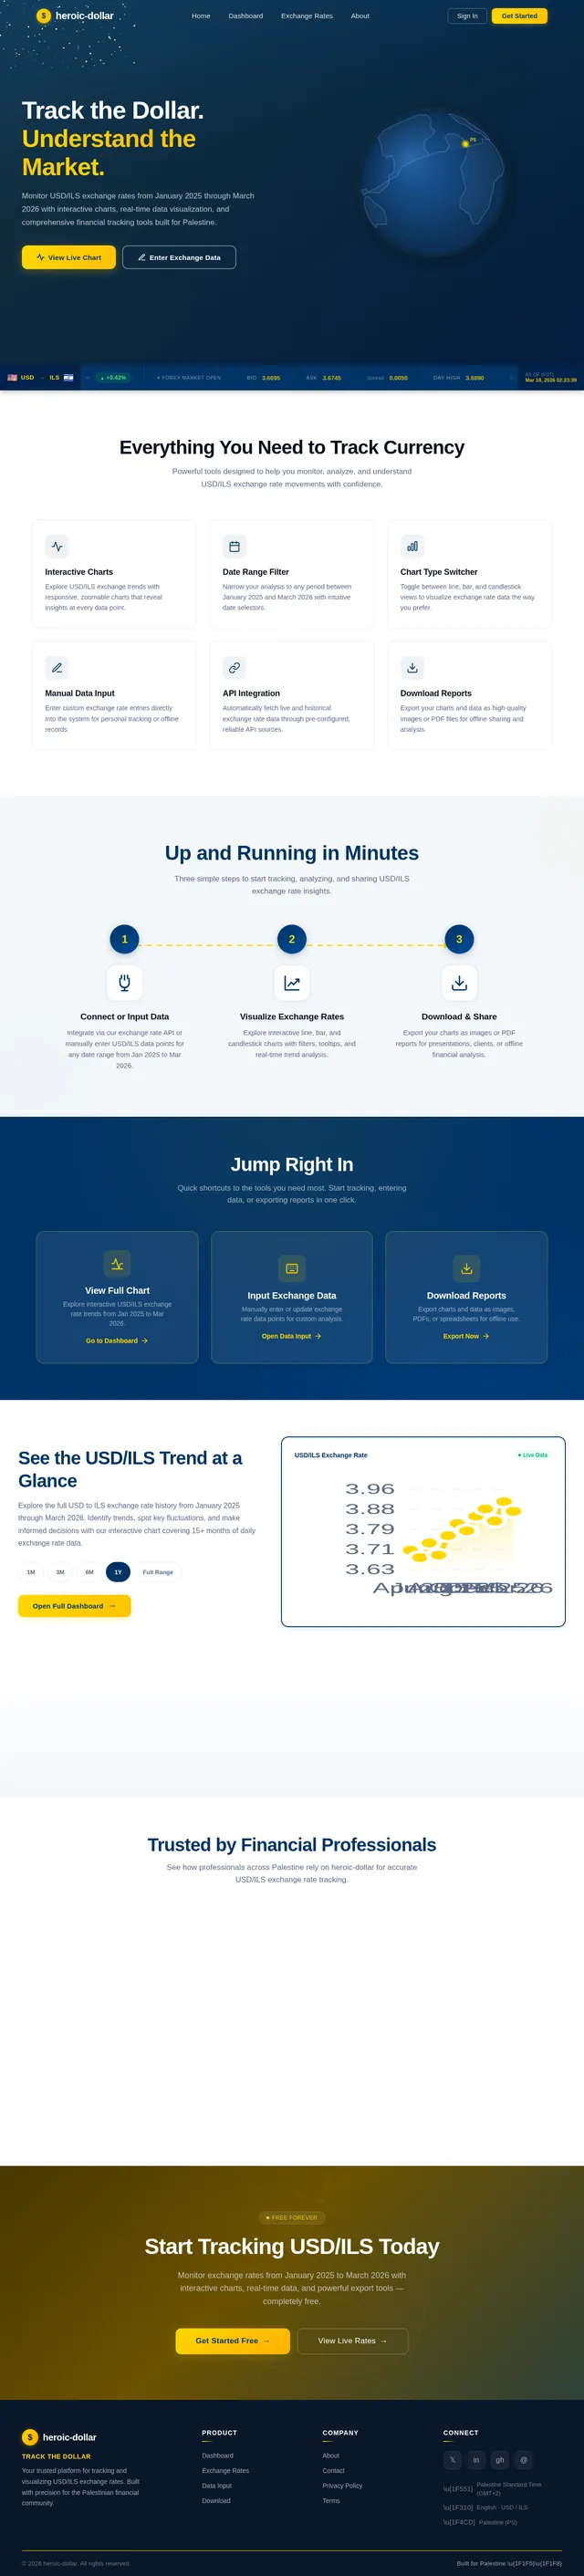
Track the Dollar. Understand the Market.
Monitor USD/ILS exchange rates from January 2025 through March 2026 with interactive charts, real-time data visualization, and comprehensive financial tracking tools built for Palestine.
Everything You Need to Track Currency
Powerful tools designed to help you monitor, analyze, and understand USD/ILS exchange rate movements with confidence.
Interactive Charts
Explore USD/ILS exchange trends with responsive, zoomable charts that reveal insights at every data point.
Date Range Filter
Narrow your analysis to any period between January 2025 and March 2026 with intuitive date selectors.
Chart Type Switcher
Toggle between line, bar, and candlestick views to visualize exchange rate data the way you prefer.
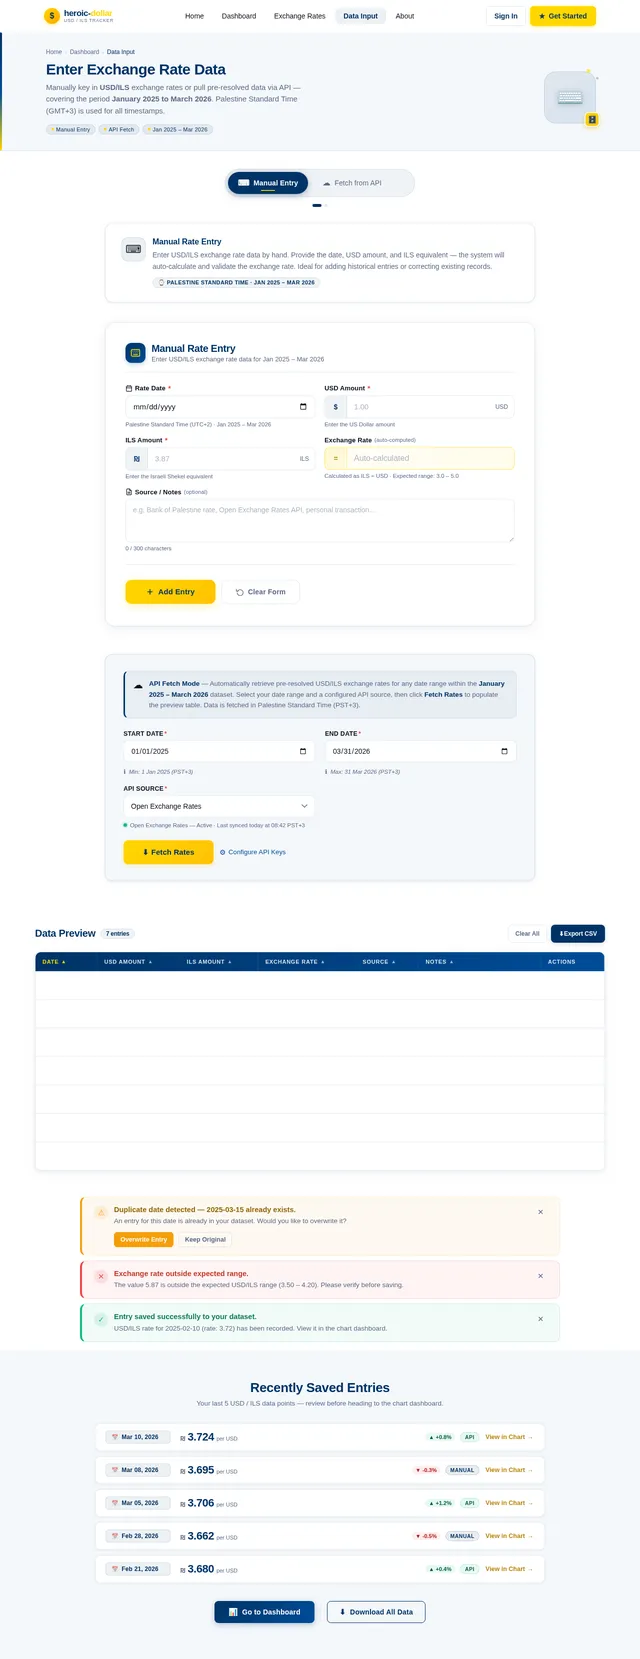
Manual Data Input
Enter custom exchange rate entries directly into the system for personal tracking or offline records.
API Integration
Automatically fetch live and historical exchange rate data through pre-configured, reliable API sources.
Download Reports
Export your charts and data as high-quality images or PDF files for offline sharing and analysis.
Up and Running in Minutes
Three simple steps to start tracking, analyzing, and sharing USD/ILS exchange rate insights.
Connect or Input Data
Integrate via our exchange rate API or manually enter USD/ILS data points for any date range from Jan 2025 to Mar 2026.
Visualize Exchange Rates
Explore interactive line, bar, and candlestick charts with filters, tooltips, and real-time trend analysis.
Download & Share
Export your charts as images or PDF reports for presentations, clients, or offline financial analysis.
Jump Right In
Quick shortcuts to the tools you need most. Start tracking, entering data, or exporting reports in one click.
View Full Chart
Explore interactive USD/ILS exchange rate trends from Jan 2025 to Mar 2026.
Go to DashboardInput Exchange Data
Manually enter or update exchange rate data points for custom analysis.
Open Data InputDownload Reports
Export charts and data as images, PDFs, or spreadsheets for offline use.
Export NowSee the USD/ILS Trend at a Glance
Explore the full USD to ILS exchange rate history from January 2025 through March 2026. Identify trends, spot key fluctuations, and make informed decisions with our interactive chart covering 15+ months of daily exchange rate data.
Trusted by Financial Professionals
See how professionals across Palestine rely on heroic-dollar for accurate USD/ILS exchange rate tracking.
heroic-dollar completely transformed how I track USD/ILS exchange rates. The interactive charts and date filtering make it effortless to spot trends across the entire Jan 2025 to March 2026 period.
As someone who deals with cross-border transactions daily, having real-time exchange data with multiple chart types is invaluable. The download feature saves me hours of manual reporting every week.
The API integration and manual data input options give me the flexibility I need. Being able to switch between line, bar, and candlestick charts helps me make better-informed exchange decisions.
Used By
Start Tracking USD/ILS Today
Monitor exchange rates from January 2025 to March 2026 with interactive charts, real-time data, and powerful export tools — completely free.
No comments yet. Be the first!