heroic-dollar
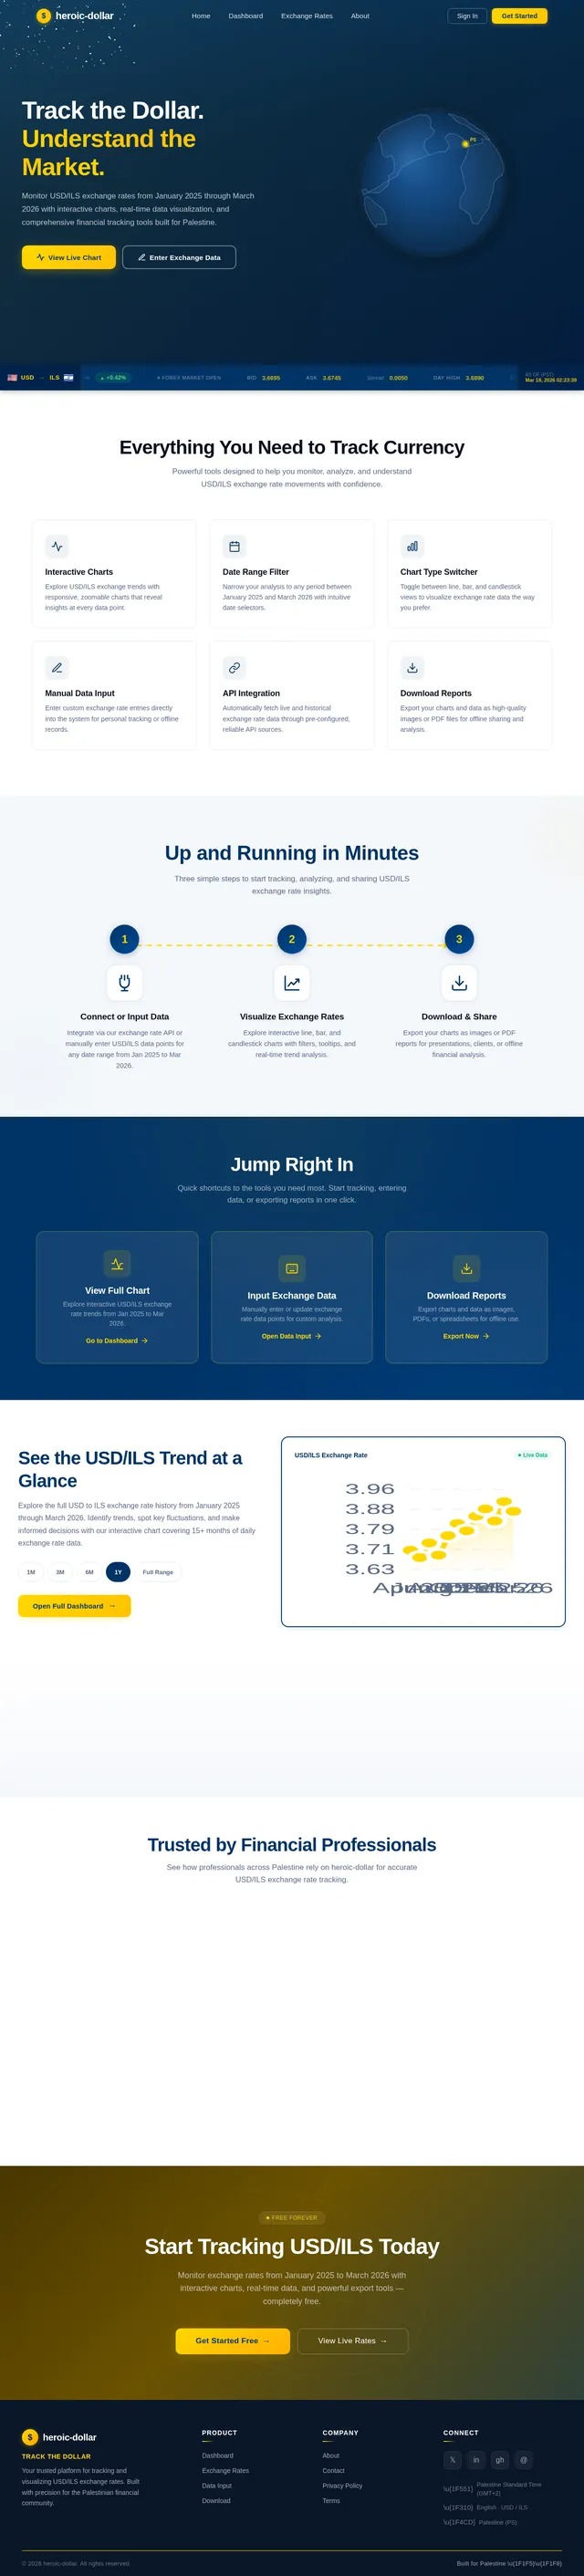
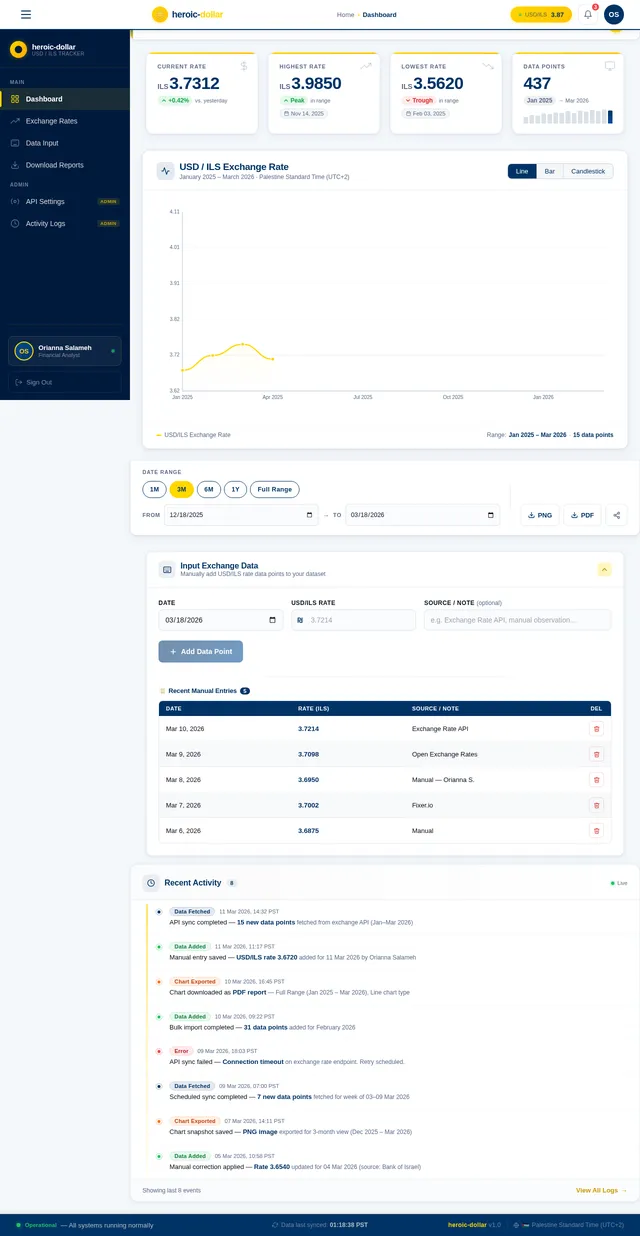
Dollar exchange rate to ils from jan 2025 to march 2026

Comments (0)
Sign in to leave a comment
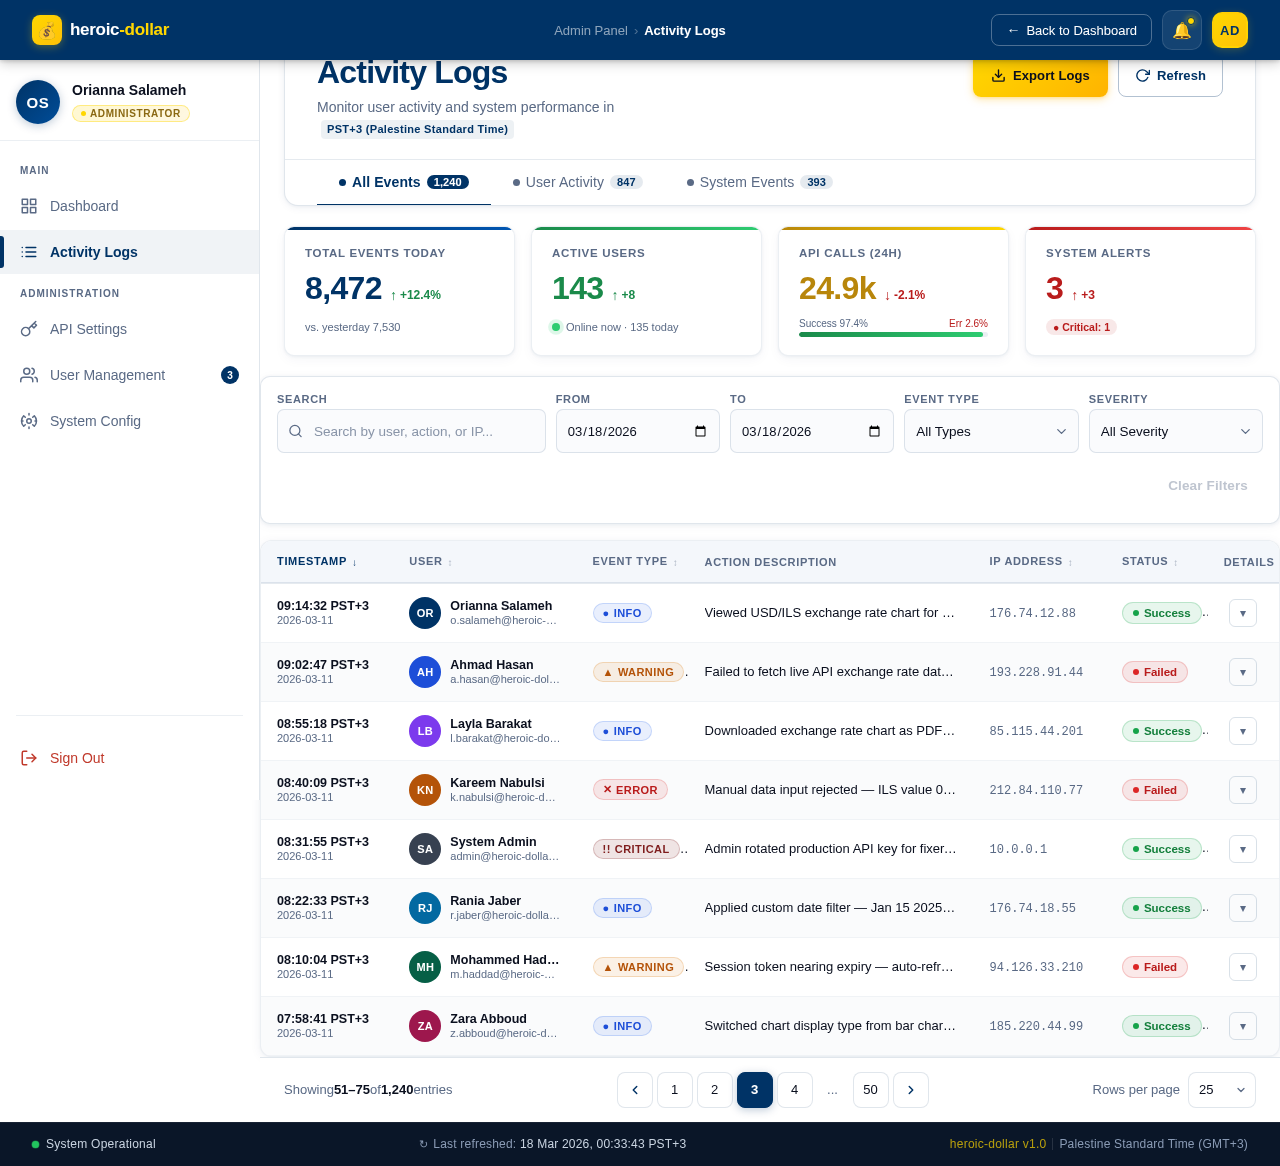
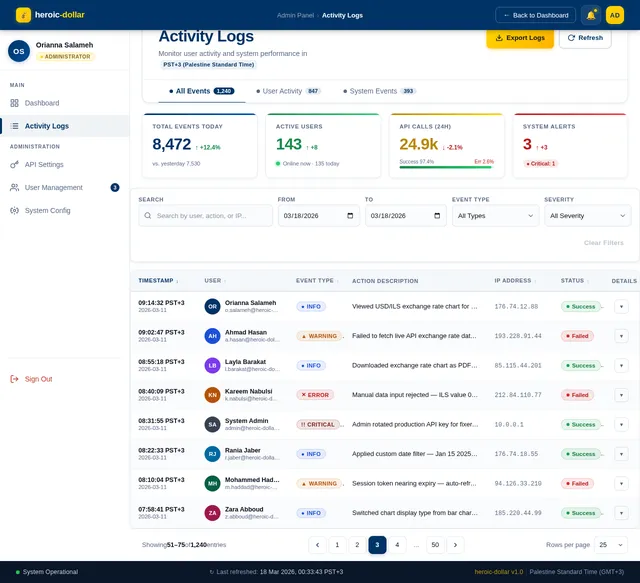
Activity Logs
Monitor user activity and system performance inPST+3 (Palestine Standard Time)
| Timestamp | User | Event Type | Action Description | IP Address | Status | Details |
|---|---|---|---|---|---|---|
| 09:14:32 PST+32026-03-11 | OR | ●Info | Viewed USD/ILS exchange rate chart for Q1 2026 date range with line chart display mode Viewed USD/ILS exchange rate chart for Q1 2026 date range with line chart display mode | 176.74.12.88 | Success | |
| 09:02:47 PST+32026-03-11 | AH | ▲Warning | Failed to fetch live API exchange rate data — external provider returned 429 Too Many Requests Failed to fetch live API exchange rate data — external provider returned 429 Too Many Requests | 193.228.91.44 | Failed | |
| 08:55:18 PST+32026-03-11 | LB | ●Info | Downloaded exchange rate chart as PDF for January–March 2026 with candlestick view Downloaded exchange rate chart as PDF for January–March 2026 with candlestick view | 85.115.44.201 | Success | |
| 08:40:09 PST+32026-03-11 | KN | ✕Error | Manual data input rejected — ILS value 0.00 is outside the accepted range (min: 0.01) Manual data input rejected — ILS value 0.00 is outside the accepted range (min: 0.01) | 212.84.110.77 | Failed | |
| 08:31:55 PST+32026-03-11 | SA | !!Critical | Admin rotated production API key for fixer.io data source — old key invalidated immediately Admin rotated production API key for fixer.io data source — old key invalidated immediately | 10.0.0.1 | Success | |
| 08:22:33 PST+32026-03-11 | RJ | ●Info | Applied custom date filter — Jan 15 2025 to Feb 28 2025 — on exchange rate dashboard Applied custom date filter — Jan 15 2025 to Feb 28 2025 — on exchange rate dashboard | 176.74.18.55 | Success | |
| 08:10:04 PST+32026-03-11 | MH | ▲Warning | Session token nearing expiry — auto-refresh attempted but encountered a network timeout Session token nearing expiry — auto-refresh attempted but encountered a network timeout | 94.126.33.210 | Failed | |
| 07:58:41 PST+32026-03-11 | ZA | ●Info | Switched chart display type from bar chart to line chart; applied 7-day moving average overlay Switched chart display type from bar chart to line chart; applied 7-day moving average overlay | 185.220.44.99 | Success |
Viewed USD/ILS exchange rate chart for Q1 2026 date range with line chart display mode
Failed to fetch live API exchange rate data — external provider returned 429 Too Many Requests
Downloaded exchange rate chart as PDF for January–March 2026 with candlestick view
Manual data input rejected — ILS value 0.00 is outside the accepted range (min: 0.01)
Admin rotated production API key for fixer.io data source — old key invalidated immediately
Applied custom date filter — Jan 15 2025 to Feb 28 2025 — on exchange rate dashboard
Session token nearing expiry — auto-refresh attempted but encountered a network timeout
Switched chart display type from bar chart to line chart; applied 7-day moving average overlay
No comments yet. Be the first!