forex-trading-scanner
 Mark Angel Ramos
Build a forex trading scanner that can scan and analyse the photo i upload that can mark the exact top and bottom level and make an indicator if i should go buy or sell based in the candle in the photo before it move with accuracy and confident live and real-time and will predict the candle and can give a sl, tp that will act like an professional bot chart scanner

Comments (0)
Sign in to leave a comment
System Requirements
System Requirements Document for forex-trading-scanner
1. Introduction
forex-trading-scanner is a photo-driven forex chart scanner. A trader uploads a photo (screenshot) of a forex chart, and the system scans and analyses that image to:
- mark the exact top and bottom level on the uploaded chart,
- produce a buy-or-sell indicator based on the candle shown in the photo, delivered before that candle moves,
- predict the candle,
- return stop-loss (SL) and take-profit (TP) levels,
- report the result with accuracy and confidence,
- operate live and in real-time,
- behave like a professional bot chart scanner.
The product is a decision instrument, not a brokerage. It reads a chart the trader already has and returns a calibrated readout: levels, direction, prediction, risk levels, and confidence. It does not place orders, connect to a broker, or manage funds.
Audience: retail forex traders who trade from chart screenshots on a phone, frequently at night, under time pressure, and who need a fast, trustworthy read of a single candle setup before it moves.
2. System Overview
The system is a first-party web application with an application-owned identity layer and a backend that performs image analysis, level detection, candle prediction, signal generation, and SL/TP computation.
Actors
- Forex Trader (human, sole active persona) — uploads chart photos, reads the analysis, acts on the signal and risk levels.
- Analysis backend (system actor) — performs the scan, level marking, prediction, signal, confidence scoring, and SL/TP derivation.
- AI analysis service (system actor) — the model-driven component that interprets the uploaded chart image and produces the prediction and confidence output.
Current delivery
- Anonymous public entry explaining the scanner and its outputs.
- Self-service enrollment and returning verification for the Forex Trader.
- Authenticated scanner workspace where a chart photo is uploaded and analysed.
- Durable scan results: levels, signals, predictions, risk levels, confidence, and live scan output, each resumable and revisitable by the owning trader.
Exclusions (narrow, source-bounded)
- No order placement, broker connection, account funding, or trade execution.
- No market-data feed subscription or live price ticker from an exchange; the analysis input is the uploaded chart photo.
- No social, copy-trading, or signal-sharing features.
- No portfolio, position, or P&L tracking.
2a. Product Interpretation and Delivery Boundary
The product's job is to read a chart photo the way a precision instrument reads a measurement. The trader supplies the image; the system returns a calibrated readout. Everything the trader sees — top level, bottom level, buy/sell signal, predicted candle, entry, SL, TP, and confidence — is derived from that uploaded photo and is presented as one instrument face.
Delivery ownership. The scanner, its results, and the trader's scan history are first-party application surfaces. The analysis itself is performed by the application's backend and its AI analysis component; the trader never leaves the product to obtain a result.
Access ownership. The public entry is anonymous and explains the product. Because scan results are durable and belong to a specific trader who must be able to resume and revisit them, the scanner and all result surfaces require an established identity. First-use enrollment is self-service; returning access is verified. There is no invitation, provisioning, or pre-existing account boundary in the source, so enrollment is open self-service.
Current vs. future. Everything in this document is current. No future-horizon capabilities are accepted; nothing in this document should be read as a roadmap commitment.
2b. Source Content Inventory
Not applicable. No reference directive in this project declares content_source authority, so no source content inventory is produced.
2c. Page Content and Component Coverage
The page inventory below is the final ordered page contract: Landing, Login, Sign Up, Scanner, Levels, Signals, Predictions, Risk Levels, Confidence, Live Scan.
Landing
- Purpose: Anonymous first impression explaining the forex chart scanner, its intended Forex Trader, and its photo-based scan, prediction, signal, and risk-level output.
- Information/state: Product name and one-line statement of what the scanner does; explanation that the input is an uploaded chart photo; the outputs the trader will receive (exact top and bottom levels, buy/sell indicator for the candle before it moves, predicted candle, SL and TP, confidence); access state is anonymous.
- Primary actions: Go to Sign Up; Go to Login.
- Supporting actions: Navigate to any explanatory section on the page.
- Domain entities: Product description, output capability list, access entry points.
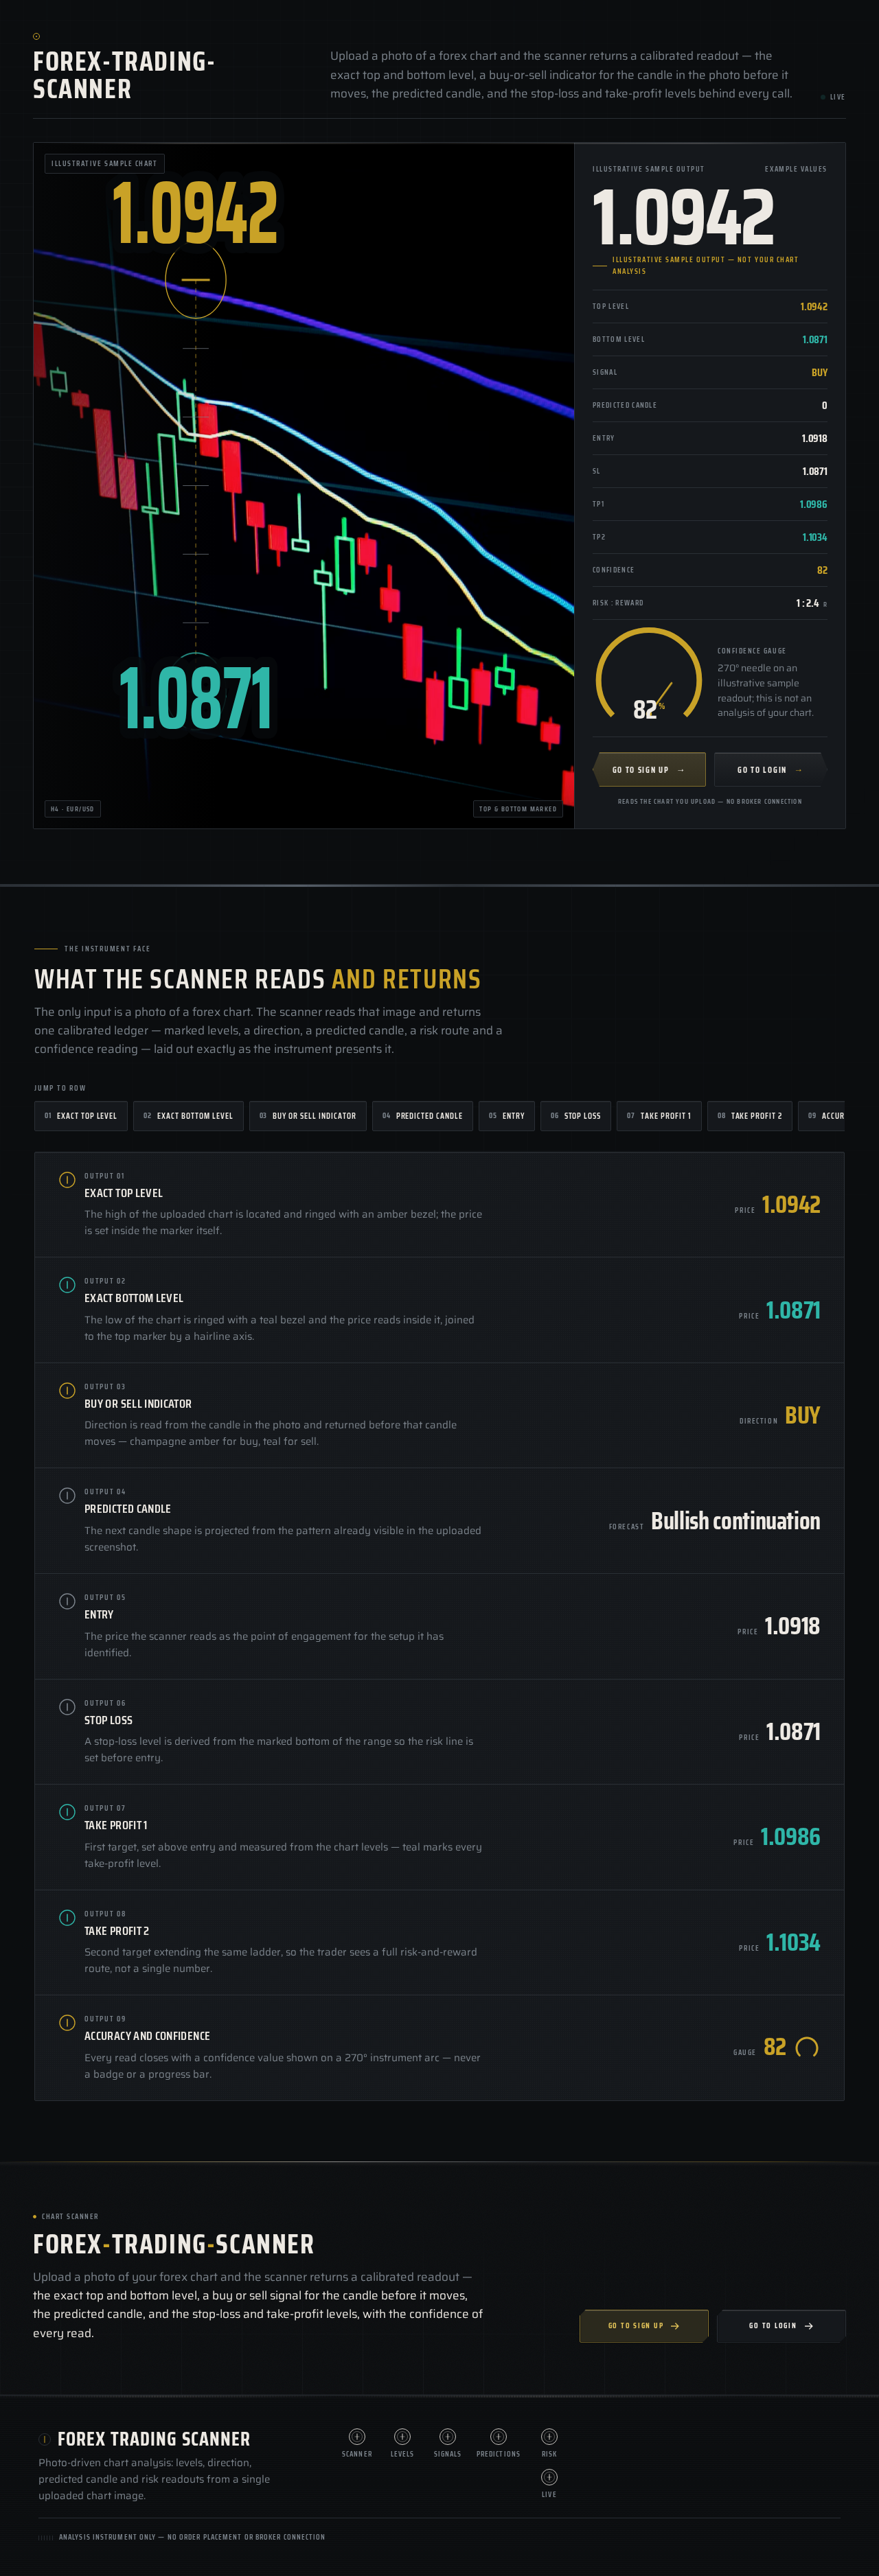
- Component responsibilities: Instrument-chassis hero (chart plate with amber TOP bezel and teal BOTTOM bezel joined by a hairline vertical axis with tick marks; ruled readout ledger with oversized condensed numeric display and stacked tabular rows for Signal, Predicted candle, Entry, SL, TP; 270° amber confidence arc with needle); faint topographic hairline grid behind the chart plate; access controls.
- States: Loading — static content, no data fetch required. Empty — not applicable. Success — page renders with hero composition and both access controls visible. Error — not applicable. Recovery — not applicable.
Login
- Purpose: Returning verification so the Forex Trader can resume access to the scanner and durable scan results.
- Information/state: Credential entry fields; anonymous access state; error state for failed verification.
- Primary actions: Submit credentials to verify identity and enter the scanner.
- Supporting actions: Navigate to Sign Up if the trader has no account.
- Domain entities: Trader identity, credential.
- Component responsibilities: Credential form; submit control; link to Sign Up; inline error region.
- States: Loading — submit control shows in-progress state during verification. Empty — fields render empty on first arrival. Success — verified trader is taken into the authenticated scanner. Error — invalid credentials show an inline message and the form remains usable. Recovery — trader can correct credentials and resubmit, or navigate to Sign Up.
Sign Up
- Purpose: First-use self-service enrollment for the Forex Trader, because no invitation, provisioning, or pre-existing account boundary is established.
- Information/state: Enrollment fields; anonymous access state; validation and error states.
- Primary actions: Submit enrollment to establish the trader's identity and enter the scanner.
- Supporting actions: Navigate to Login if the trader already has an account.
- Domain entities: Trader identity, credential.
- Component responsibilities: Enrollment form; submit control; link to Login; inline validation and error region.
- States: Loading — submit control shows in-progress state during enrollment. Empty — fields render empty on first arrival. Success — identity established and the trader enters the authenticated scanner. Error — invalid or incomplete input shows an inline message and the form remains usable. Recovery — trader can correct input and resubmit, or navigate to Login.
Scanner
- Purpose: Accepts the Forex Trader's uploaded forex chart photo as the input to a scan.
- Information/state: Upload control and selected-image state; the uploaded chart photo rendered as a full-bleed dark plate; scan-in-progress state; scan-complete state; scan-failure state; authenticated access state.
- Primary actions: Upload a chart photo; start the scan.
- Supporting actions: Replace the selected photo before scanning; retry a failed scan.
- Domain entities: Chart photo, scan, scan status.
- Component responsibilities: Upload control; chart plate; scan button as a machined bezel with a single 1.2s amber ring pulse during analysis; live
LIVEmicro-label with a 1s teal dot blink in the top rail; scan status region; failure region with retry. - States: Loading — scan button shows the amber ring pulse while analysis runs. Empty — no photo selected, upload control is the only active element. Success — scan resolves and the trader is offered the result surfaces. Error — unreadable or unsupported photo shows a failure message with a retry action. Recovery — trader replaces the photo or retries the scan.
Levels
- Purpose: Displays analysis of the uploaded chart with the exact top and bottom levels marked.
- Information/state: The uploaded chart with the exact top level and exact bottom level marked; the price value of each level; authenticated access state.
- Primary actions: Read the marked top and bottom levels on the chart.
- Supporting actions: Move between result surfaces for the same scan.
- Domain entities: Chart photo, top level, bottom level, level price.
- Component responsibilities: Chart plate with circular bezel level markers — an amber ring with a centre tick at the exact high and a teal ring at the exact low, each with the price in condensed tabular figures set inside the bezel; hairline vertical axis with tick marks; ruled data rows for Top level and Bottom level.
- States: Loading — level markers draw on as a 300ms hairline stroke from the candle to the axis. Empty — no scan selected shows a prompt to run a scan. Success — both levels marked with their prices. Error — if a level cannot be determined, the affected row states that it is unavailable rather than showing a fabricated value. Recovery — trader returns to Scanner to run a new scan.
Signals
- Purpose: Presents the buy-or-sell indicator for the candle in the uploaded photo before it moves.
- Information/state: The buy or sell indicator for the candle shown in the uploaded photo; the candle it applies to; authenticated access state.
- Primary actions: Read the buy-or-sell indicator.
- Supporting actions: Move between result surfaces for the same scan.
- Domain entities: Signal direction (BUY or SELL), source candle.
- Component responsibilities: Signal readout as a ruled data row, label-left and tabular-value-right; direction encoded as instrument colour — BUY in champagne amber
#C9A227, SELL in teal#2FB6A8; reference to the candle in the uploaded photo the indicator is based on. - States: Loading — value resolves with a 600ms digit count-up and no overshoot. Empty — no scan selected shows a prompt to run a scan. Success — indicator displayed for the candle in the uploaded photo. Error — if no indicator can be produced, the row states that it is unavailable rather than showing a fabricated direction. Recovery — trader returns to Scanner to run a new scan.
Predictions
- Purpose: Presents the predicted movement of the candle shown in the uploaded chart.
- Information/state: The predicted candle; the candle in the uploaded photo it corresponds to; authenticated access state.
- Primary actions: Read the predicted candle.
- Supporting actions: Move between result surfaces for the same scan.
- Domain entities: Predicted candle, source candle.
- Component responsibilities: Predicted candle readout as a ruled data row, label-left and tabular-value-right; visual correspondence to the candle in the uploaded chart plate.
- States: Loading — value resolves with a 600ms digit count-up and no overshoot. Empty — no scan selected shows a prompt to run a scan. Success — predicted candle displayed. Error — if no prediction can be produced, the row states that it is unavailable rather than showing a fabricated prediction. Recovery — trader returns to Scanner to run a new scan.
Risk Levels
- Purpose: Presents stop-loss and take-profit levels for the analysed trading setup.
- Information/state: Entry, SL, TP1, TP2, and R:R for the analysed setup; authenticated access state.
- Primary actions: Read the SL and TP levels.
- Supporting actions: Move between result surfaces for the same scan.
- Domain entities: Entry, stop-loss, take-profit targets, risk-to-reward ratio.
- Component responsibilities: Ruled data ledger rows for Entry, SL, TP1, TP2, and R:R, label-left and tabular-value-right, separated by hairlines; TP targets carried in teal
#2FB6A8as the secondary instrument colour. - States: Loading — values resolve with a 600ms digit count-up and no overshoot. Empty — no scan selected shows a prompt to run a scan. Success — SL and TP levels displayed for the analysed setup. Error — if risk levels cannot be derived, the affected rows state that they are unavailable rather than showing fabricated levels. Recovery — trader returns to Scanner to run a new scan.
Confidence
- Purpose: Communicates the scan result's accuracy and confidence indication.
- Information/state: The confidence value for the scan result; authenticated access state.
- Primary actions: Read the confidence indication.
- Supporting actions: Move between result surfaces for the same scan.
- Domain entities: Confidence value.
- Component responsibilities: 270° arc gauge with a needle and a counting numeral in the centre; needle sweeps once on scan resolution; amber instrument accent.
- States: Loading — needle sweeps once to its final position as the scan resolves. Empty — no scan selected shows a prompt to run a scan. Success — confidence value displayed on the gauge. Error — if confidence cannot be computed, the gauge states that it is unavailable rather than showing a fabricated value. Recovery — trader returns to Scanner to run a new scan.
Live Scan
- Purpose: Provides live, real-time scanning and analysis output for the trading setup.
- Information/state: Live scan activity and real-time analysis output for the current setup; authenticated access state.
- Primary actions: Observe live scan output as analysis runs.
- Supporting actions: Move between result surfaces for the same scan.
- Domain entities: Live scan session, real-time analysis output.
- Component responsibilities: Live output region;
LIVEmicro-label with a 1s teal dot blink as the only looping motion in the product; real-time update of the analysis readout. - States: Loading — live output streams as analysis runs. Empty — no active scan shows a prompt to run a scan. Success — live analysis output displayed for the current setup. Error — if the live session drops, the region states the interruption and offers to resume. Recovery — trader restarts the live scan from Scanner.
3. Functional Requirements
FR-1 — Upload a chart photo for scanning (explicit) As a Forex Trader, I should upload a photo of a forex chart so that the scanner can analyse it.
- Trigger/input: Trader selects a chart photo on Scanner.
- Observable result: The selected photo is displayed as a full-bleed dark plate and is ready to scan.
- Access state: Authenticated.
- Failure/recovery: An unreadable or unsupported photo shows a failure message with a retry action; the trader can replace the photo.
- Continuation: Trader starts the scan.
FR-2 — Scan and analyse the uploaded chart photo (explicit) As a Forex Trader, I should have the uploaded chart photo scanned and analysed so that I receive a complete read of the setup.
- Trigger/input: Trader starts the scan on Scanner.
- Observable result: The scan runs and resolves into the analysis outputs: levels, signal, prediction, risk levels, and confidence.
- Access state: Authenticated.
- Failure/recovery: A failed scan shows a failure state with a retry action; the trader can retry or replace the photo.
- Continuation: Trader reviews the result surfaces.
FR-3 — Mark the exact top and bottom level (explicit) As a Forex Trader, I should see the exact top level and exact bottom level marked on my uploaded chart so that I know precisely where the extremes are.
- Trigger/input: A completed scan of the uploaded chart photo.
- Observable result: On Levels, the exact top level and exact bottom level are marked on the chart with their prices.
- Access state: Authenticated.
- Failure/recovery: If a level cannot be determined, the affected row states that it is unavailable rather than showing a fabricated value.
- Continuation: Trader uses the marked levels alongside the signal and risk levels.
FR-4 — Buy-or-sell indicator for the candle in the photo, before it moves (explicit) As a Forex Trader, I should receive a buy-or-sell indicator based on the candle in the uploaded photo, produced before that candle moves, so that I can act ahead of the move.
- Trigger/input: A completed scan of the uploaded chart photo.
- Observable result: On Signals, a BUY or SELL indicator is displayed for the candle shown in the uploaded photo.
- Access state: Authenticated.
- Failure/recovery: If no indicator can be produced, the row states that it is unavailable rather than showing a fabricated direction.
- Continuation: Trader combines the indicator with the predicted candle and risk levels.
FR-5 — Predict the candle (explicit) As a Forex Trader, I should see the predicted candle so that I know what the scanner expects the candle in my photo to do.
- Trigger/input: A completed scan of the uploaded chart photo.
- Observable result: On Predictions, the predicted movement of the candle shown in the uploaded chart is displayed.
- Access state: Authenticated.
- Failure/recovery: If no prediction can be produced, the row states that it is unavailable rather than showing a fabricated prediction.
- Continuation: Trader compares the prediction with the signal and levels.
FR-6 — Stop-loss and take-profit levels (explicit) As a Forex Trader, I should receive stop-loss and take-profit levels so that I can size and protect the trade like a professional bot's output.
- Trigger/input: A completed scan of the uploaded chart photo.
- Observable result: On Risk Levels, SL and TP levels are displayed for the analysed setup.
- Access state: Authenticated.
- Failure/recovery: If risk levels cannot be derived, the affected rows state that they are unavailable rather than showing fabricated levels.
- Continuation: Trader acts on the setup with defined risk.
FR-7 — Accuracy and confidence indication (explicit) As a Forex Trader, I should see how accurate and confident the scan result is so that I can weigh the read before acting.
- Trigger/input: A completed scan of the uploaded chart photo.
- Observable result: On Confidence, the scan result's confidence indication is displayed.
- Access state: Authenticated.
- Failure/recovery: If confidence cannot be computed, the gauge states that it is unavailable rather than showing a fabricated value.
- Continuation: Trader weighs the confidence against the signal and risk levels.
FR-8 — Live and real-time scanning and analysis (explicit) As a Forex Trader, I should see scanning and analysis delivered live and in real time so that the read arrives while the setup is still actionable.
- Trigger/input: An active scan on Scanner.
- Observable result: On Live Scan, live, real-time scanning and analysis output is presented for the trading setup.
- Access state: Authenticated.
- Failure/recovery: If the live session drops, the region states the interruption and offers to resume.
- Continuation: Trader continues to the result surfaces.
FR-9 — Professional bot chart scanner behaviour (explicit) As a Forex Trader, I should experience the scanner as a professional bot chart scanner so that the output carries the authority of a calibrated instrument.
- Trigger/input: Any completed scan.
- Observable result: The full readout — levels, signal, prediction, risk levels, and confidence — is presented as one coherent instrument face with consistent, calibrated values.
- Access state: Authenticated.
- Failure/recovery: Any unavailable output is stated as unavailable rather than silently omitted or fabricated.
- Continuation: Trader acts on the complete readout.
FR-10 — Self-service enrollment (required_inference) As a Forex Trader, I should be able to enroll myself so that I can start using the scanner without an invitation or provisioning step.
- Trigger/input: Trader submits enrollment details on Sign Up.
- Observable result: The trader's identity is established and the trader enters the authenticated scanner.
- Access state: Anonymous entry.
- Failure/recovery: Invalid or incomplete input shows an inline message and the form remains usable; the trader can correct and resubmit or navigate to Login.
- Continuation: Trader uploads a chart photo on Scanner.
FR-11 — Returning verification (required_inference) As a Forex Trader, I should be able to verify my identity on return so that I can resume access to the scanner and my durable scan results.
- Trigger/input: Trader submits credentials on Login.
- Observable result: The trader is verified and enters the authenticated scanner with access to prior scan results.
- Access state: Anonymous entry.
- Failure/recovery: Invalid credentials show an inline message and the form remains usable; the trader can correct and resubmit or navigate to Sign Up.
- Continuation: Trader resumes scanning or revisits a prior result.
FR-12 — Authenticated access to protected scan workflows (required_inference) As a Forex Trader, I should be required to establish my identity before uploading a chart photo and using protected scan workflows so that my scan results remain bound to me and resumable.
- Trigger/input: An unauthenticated attempt to reach Scanner, Levels, Signals, Predictions, Risk Levels, Confidence, or Live Scan.
- Observable result: The protected surface is not available until identity is established; the trader is directed to Login or Sign Up.
- Access state: Protected surfaces require an established identity.
- Failure/recovery: If verification fails, the trader remains outside the protected surface and can retry or enroll.
- Continuation: After identity is established, the trader reaches the intended protected surface.
4. User Personas
Forex Trader
Product context. A retail forex trader who works from chart screenshots, typically on a phone, often during night sessions, and who is deciding on a single candle setup under time pressure with real money at stake. The trader already has the chart; what is missing is a fast, trustworthy read of it.
Primary goal. Get an accurate, confident read of an uploaded chart — the exact top and bottom levels, a buy-or-sell indicator for the candle in the photo before it moves, the predicted candle, and SL/TP levels — delivered live and in real time, with the authority of a professional bot chart scanner.
Distinct accepted responsibilities.
- Capture and upload the chart photo that drives the entire analysis.
- Start the scan and observe it run live and in real time.
- Read the exact top and bottom levels marked on the uploaded chart.
- Read the buy-or-sell indicator for the candle in the uploaded photo, produced before that candle moves.
- Read the predicted candle.
- Read the SL and TP levels for the analysed setup.
- Weigh the accuracy and confidence indication before acting.
- Resume and revisit prior scan results after returning.
Relevant inputs and decisions. The trader supplies the chart photo and decides when to scan. The trader decides whether the readout is trustworthy enough to act on, weighing the signal, the predicted candle, the marked levels, the SL/TP levels, and the confidence indication together.
Interactions with other accepted participants. The Forex Trader is the sole active human persona. The trader interacts with the analysis backend and the AI analysis service only through the product's surfaces; those are system actors, not participants the trader negotiates with. The trader's own identity is the only other party in the lifecycle — established at enrollment, verified on return, and the binding that keeps scan results resumable.
Observable success. The trader uploads a chart photo and receives a complete, internally consistent readout — exact top and bottom levels marked on the chart, a buy-or-sell indicator for the candle in the photo delivered before it moves, a predicted candle, SL and TP levels, and a confidence indication — presented live and in real time as one instrument face.
Source-backed constraints. Analysis is driven by the chart photo the trader uploads. The buy/sell indicator must be based on the candle in the uploaded photo and produced before that candle moves. Top and bottom levels must be marked exactly. Output must be accurate and confident. Scanning and analysis must be live and real-time. The scanner must act like a professional bot chart scanner.
5. Core User Flows
Flow 1 — First-time enrollment and first scan
- The Forex Trader arrives at Landing anonymously and reads what the scanner does: it analyses an uploaded chart photo and returns exact top and bottom levels, a buy-or-sell indicator for the candle before it moves, a predicted candle, SL and TP levels, and a confidence indication.
- The trader selects the Sign Up action and lands on Sign Up.
- The trader submits enrollment details. On success, identity is established and the trader enters the authenticated scanner.
- On Scanner, the trader uploads a photo of a forex chart. The photo renders as a full-bleed dark plate.
- The trader starts the scan. The scan button shows a single 1.2s amber ring pulse while analysis runs, and the
LIVEmicro-label blinks in the top rail. - On Live Scan, the trader observes live, real-time scanning and analysis output for the setup as it is produced.
- The scan resolves. The trader moves to Levels and sees the exact top level marked with an amber bezel and the exact bottom level marked with a teal bezel, each carrying its price in condensed tabular figures, joined by a hairline vertical axis with tick marks.
- The trader moves to Signals and reads the buy-or-sell indicator for the candle in the uploaded photo, produced before that candle moves.
- The trader moves to Predictions and reads the predicted candle.
- The trader moves to Risk Levels and reads Entry, SL, TP1, TP2, and R:R for the analysed setup.
- The trader moves to Confidence and reads the confidence indication on the 270° needle gauge.
- Next step: the trader weighs the complete readout and acts on the setup.
Failure/recovery: If the uploaded photo is unreadable or unsupported, Scanner shows a failure message with a retry action and the trader replaces the photo or retries. If enrollment input is invalid, Sign Up shows an inline message and the form remains usable.
Flow 2 — Returning trader resumes and revisits a scan
- The Forex Trader arrives at Landing and selects the Login action.
- On Login, the trader submits credentials.
- On success, the trader enters the authenticated scanner with access to prior scan results.
- The trader revisits a prior scan's result surfaces — Levels, Signals, Predictions, Risk Levels, Confidence — and re-reads the marked levels, indicator, predicted candle, SL/TP levels, and confidence.
- Next step: the trader either acts on the revisited readout or returns to Scanner to run a new scan.
Failure/recovery: If credentials are invalid, Login shows an inline message and the form remains usable; the trader corrects and resubmits, or navigates to Sign Up. If the trader has no account, the Sign Up link on Login takes them to enrollment.
Flow 3 — Running a new scan on a fresh chart photo
- The authenticated Forex Trader is on Scanner.
- The trader uploads a new chart photo, replacing any previously selected image.
- The trader starts the scan and watches the amber ring pulse once around the scan button.
- On Live Scan, the trader observes the live, real-time analysis output for the new setup.
- The scan resolves and the trader moves through Levels, Signals, Predictions, Risk Levels, and Confidence to read the new readout.
- Next step: the trader acts on the new setup or uploads another chart photo.
Failure/recovery: If the scan fails, Scanner shows a failure state with a retry action; the trader retries or replaces the photo. If the live session drops during analysis, Live Scan states the interruption and offers to resume; the trader restarts the live scan from Scanner.
Flow 4 — Acting on a completed readout
- The authenticated Forex Trader has a completed scan with all result surfaces populated.
- On Levels, the trader confirms the exact top and bottom levels marked on the chart.
- On Signals, the trader reads the buy-or-sell indicator for the candle in the uploaded photo.
- On Predictions, the trader reads the predicted candle.
- On Risk Levels, the trader reads Entry, SL, TP1, TP2, and R:R.
- On Confidence, the trader reads the confidence indication and weighs it against the rest of the readout.
- Next step: the trader acts on the setup outside the product, or returns to Scanner to scan another chart.
Failure/recovery: If any individual output is unavailable, its row or gauge states that it is unavailable rather than showing a fabricated value, and the trader can still read the remaining outputs or return to Scanner to run a new scan.
6. Visuals Colors and Theme
Muse and headline. MARQ by Garmin — luxury instrument aesthetic. Instrument-grade precision for a chart scanner: titanium dark, amber needle, dial readouts. The register is cockpit, not friendly SaaS: a precision instrument that reads a chart the way a depth gauge reads water. Emotional target: the calm of a well-machined tool that tells you exactly where the top and bottom are.
Colour tokens (dark mode).
| Role | Hex | Use |
|---|---|---|
| Background | #0B0D0F | Graphite-titanium dark ground; charts and uploaded photos sit here so the image is the brightest object in the frame |
| Surface | #15181C | Raised brushed panels |
| Hairline rule | #2A2F35 | Panel separation and ruled data rows |
| Text | #EDE9E3 | Warm off-white body text (~15:1 contrast on ground) |
| Primary | #C9A227 | Champagne-amber instrument needle: BUY signals, active scan ring, level markers, the single saturated accent |
| Accent | #2FB6A8 | Teal secondary instrument colour: SELL signals and TP targets — never decorative, always semantic |
| Muted | #7C848C | Labels, units, and timestamps only |
Red is deliberately not used. Direction is encoded amber versus teal so the UI never looks like a loss screen.
Typography.
- Headings: Saira Condensed — uppercase, 600–700 weight, tracking +0.04em on labels, tight −0.01em on big numbers.
- Body: Saira, 400/500, 1.6 line-height, generous measure.
- Numerals: Prices, levels, and confidence percentages set in tabular figures at 700 weight so digits align in ruled rows like a dial face.
- Scale: 1.25 modular on a 4/8pt rhythm — display 44px mobile → 96px desktop (clamp); hero numeric readout 56 → 128px; section heading 28 → 40px; panel title 18 → 22px; body 16 → 17px; label/micro 11 → 12px uppercase tracked; data row 15 → 16px tabular.
Shape language. Engineered circles and ruled rectangles. Level markers are circular bezels with a 1px hairline ring and a filled centre tick; confidence is a 270° arc gauge with a needle, not a progress bar. Panels are squared with 2px radius only — machined, not soft — separated by hairline rules rather than shadows. Buttons are chamfered rectangles with a 1px inner top highlight that reads as brushed metal. No pills, no blobs, no soft 24px radii anywhere.
Layout. Edge-to-edge dark instrument chassis. Left rail is a narrow vertical tool strip (Scanner, Levels, Signals, Predictions, Risk, Live) with circular icon bezels and 11px uppercase labels. Main area is a strict 12-column grid: the uploaded chart occupies columns 1–8 as a full-bleed dark plate; the readout column 9–12 stacks ruled data rows — Top level, Bottom level, Signal, Predicted candle, Entry, SL, TP1/TP2, Confidence arc. Every row is label-left / value-right tabular with a hairline between, like a watch dial's data. On mobile the readout column drops below the chart as a ruled ledger; the tool rail becomes a bottom dock of circular bezels.
Imagery. The uploaded chart photo is the hero and the only photographic content — presented as a dark plate with a subtle topographic hairline grid behind it, cropped edge-to-edge, never in a rounded card. Supporting imagery is diagrammatic: ruler ticks, topographic contour lines, bezel rings, a small titanium-grain noise texture at 3% opacity on panels. No stock traders, no phone mockups, no glowing orbs. Macro material detail (brushed metal, sapphire edge) appears only as thin decorative strips at section boundaries.
Readable text and controls. Headlines, wordmarks, labels, numbers, card text, and controls stay entirely inside the viewport and their container at 375px, 768px, and 1280px, wrapping or scaling (for example font-size: clamp(...) with its mobile size) to fit, and no other element covers any part of them. Imagery, decoration, and motion may be cropped, bled off an edge, rotated, overlapped, or cut as the direction asks, as long as they cover no readable text or control.
7. Signature Design Concept
The instrument face. The public entry is not a centred SaaS hero. It is a dark instrument chassis that shows the product's defining state before the trader ever signs up.
On the left, a 7-column full-bleed chart plate — a real forex screenshot, dark-rendered — already annotated with an amber TOP bezel at the high and a teal BOTTOM bezel at the low, joined by a hairline vertical axis with tick marks. Behind the plate, a faint topographic hairline grid. The chart is the only bright object on screen.
On the right, a 4-column ruled readout ledger. At its head sits an oversized condensed numeric display — a 56px mobile / 128px desktop price for the marked top level. Below it, stacked tabular rows for Signal, Predicted candle, Entry, SL, and TP, each label-left and value-right with a hairline between, so digits align vertically down the column. The ledger is capped by a 270° amber confidence arc with a needle.
The whole composition reads as a cockpit gauge cluster, not a web page. The signature moves carry it: circular bezel level markers where the marker is the readout rather than a label beside it; confidence as a 270° needle gauge with a counting numeral in the centre instead of a percentage badge; the ruled data ledger that makes the entire analysis read as one instrument face; the scan button as a machined bezel with a single 1.2s amber ring pulse; and the LIVE micro-label with its 1s teal dot blink as the only looping motion in the product. Direction is encoded as instrument colour — BUY in champagne amber #C9A227, SELL in teal #2FB6A8 — so a sell signal never reads as an error state.
This concept recomposes only accepted content, states, and controls. It introduces no new behaviour, page, or destination.
8. Interaction Model & Motion Direction
Interaction Model: Animated Motion Tempo: restrained Hero Dimensionality: dimensional_css
Landing Hero Motion Brief
- Focal subject: The uploaded chart plate with its amber TOP bezel and teal BOTTOM bezel, joined by a hairline vertical axis with tick marks, and the ruled readout ledger beside it capped by the 270° amber confidence arc.
- Input → transformation → outcome thesis: The trader's chart photo is the input; the instrument reads it and resolves into a calibrated readout. On the entry, the level markers draw on as a 300ms hairline stroke from the candle to the axis, the ledger digits count up to their final values in 600ms with no overshoot, and the confidence needle sweeps once to its position. The outcome is a complete instrument face — levels, signal, predicted candle, entry, SL, TP, and confidence — presented as one coherent read.
- Motion vocabulary: Precise instrument motion only. A slow needle sweep on the confidence gauge when a scan resolves; digits counting up to their final value in 600ms with no overshoot; a 1.2s amber ring pulsing once around the scan button while analysis runs; level markers drawing on as a 300ms hairline stroke from the candle to the axis. Everything uses a mechanical ease —
cubic-bezier(0.2, 0.8, 0.2, 1)— at 120–300ms. No bounce, no particles, no gradient drift. - Composed first frame: The chart plate already annotated with both bezels and the hairline axis, the ledger rows at their final values, and the confidence needle at rest — a still instrument face that reads as a finished measurement.
- Reduced-motion state: Values appear instantly at their final state, the gauge needle jumps to position, and level markers render as static lines. The
LIVEteal dot blink stops. The static arrangement remains fully readable and usable.
9. Non-Functional Requirements
NFR-1 — Real-time delivery (explicit) Scanning and analysis must be delivered live and in real time, so the read arrives while the setup is still actionable. Rationale: the buy/sell indicator must be produced before the candle in the uploaded photo moves.
NFR-2 — Accuracy and confidence (explicit) The analysis output must be accurate and confident, and the confidence indication must be presented as part of the readout. Rationale: the trader is betting real money on the read.
NFR-3 — Exact level marking (explicit) Top and bottom levels must be marked exactly on the uploaded chart. Rationale: the marked levels are the trader's reference points for the setup.
NFR-4 — Professional bot chart scanner behaviour (explicit) The scanner must behave like a professional bot chart scanner: consistent, calibrated output presented as one coherent instrument face. Rationale: the trader needs the authority of a calibrated instrument, not a casual estimate.
NFR-5 — Durable scan state (required_inference) Scan results must persist so the owning trader can resume and revisit them after returning. Rationale: the trader must be able to return to a prior readout; without durable state, the returning-verification journey has nothing to resume.
NFR-6 — Identity-bound results (required_inference) Scan results must remain bound to the trader who created them, so that a returning trader resumes their own results. Rationale: the protected scan workflows require an established identity, and results must remain attributable to the correct participant.
NFR-7 — Readable text and controls at every viewport (explicit, from the creative direction) Headlines, wordmarks, labels, numbers, card text, and controls must stay entirely inside the viewport and their container at 375px, 768px, and 1280px, wrapping or scaling to fit, with no other element covering any part of them. Imagery, decoration, and motion may be cropped, bled, rotated, overlapped, or cut as the direction asks, as long as they cover no readable text or control.
NFR-8 — Reduced-motion support (explicit, from the creative direction)
With prefers-reduced-motion, the product must provide a usable static arrangement: values appear instantly at their final state, the gauge needle jumps to position, level markers render as static lines, and the LIVE teal dot blink stops.
10. Tech Stack
- Frontend: React — a single-page application rendering the ten contracted pages, the instrument-chassis layout, the chart plate with bezel level markers, the ruled data ledger, and the 270° confidence gauge.
- Backend: Python / FastAPI — a single shared backend process serving the application's routes and modules: identity (enrollment, verification), scan intake and storage, and the analysis orchestration that produces levels, signal, prediction, risk levels, and confidence.
- AI analysis: A model-driven analysis component invoked by the backend to interpret the uploaded chart image and produce the predicted candle, the buy-or-sell indicator, and the confidence value. Required by the accepted scope (
ai_required). - Storage: Persistent storage for trader identity and durable scan results, including the uploaded chart photo and its derived outputs, so results can be resumed and revisited.
- Containerization: Docker / docker-compose — the frontend and the shared backend as the runnable services. The analysis work runs inside the existing backend process; no separate container or ingress route is introduced for it.
11. Assumptions and Constraints
Assumptions
- A-1 (required_inference) — The Forex Trader is the sole active human persona; the analysis backend and AI analysis service are system actors, not participants the trader negotiates with.
- A-2 (required_inference) — Enrollment is open self-service, because the source establishes no invitation, provisioning, or pre-existing account boundary.
- A-3 (required_inference) — Scan results are durable and bound to the trader who created them, because the returning-verification journey requires something to resume.
- A-4 (required_inference) — The protected surfaces (Scanner, Levels, Signals, Predictions, Risk Levels, Confidence, Live Scan) require an established identity; Landing, Login, and Sign Up are anonymously reachable.
- A-5 (required_inference) — The analysis input is the uploaded chart photo; no external market-data feed is required to produce the readout.
Constraints
- C-1 (explicit) — Analysis is driven by a chart photo uploaded by the user.
- C-2 (explicit) — The buy/sell indicator must be based on the candle in the uploaded photo and be produced before that candle moves.
- C-3 (explicit) — Top and bottom levels must be marked exactly.
- C-4 (explicit) — Output must be accurate and confident.
- C-5 (explicit) — Scanning and analysis must be live and real-time.
- C-6 (explicit) — The scanner must act like a professional bot chart scanner.
- C-7 (explicit, from the creative direction) — The generic indigo/blue-on-white SaaS template is forbidden for this project. No
#2563EB,#4F46E5, or bootstrap-blue buttons anywhere. - C-8 (explicit, from the creative direction) — Direction is encoded as instrument colour, never red/green: BUY is champagne amber
#C9A227, SELL is teal#2FB6A8. - C-9 (explicit, from the creative direction) — Confidence is expressed as a 270° needle gauge, never as a percentage badge or progress bar.
- C-10 (explicit, from the creative direction) — Typography stays condensed and technical: Saira Condensed for headings and numeric readouts, Saira for body. Inter, Roboto, Poppins, and neutral geometric sans are excluded.
- C-11 (explicit, from the creative direction) — No rounded 16–24px cards with hover-lift shadows, no grid of identical tiles, no crypto-glow aesthetics (neon violet gradients, particle fields, glassmorphism panels), no stock photography of traders, laptops, or city skylines, and no bouncy or springy micro-interactions.
Out of scope (narrow, source-bounded)
- Order placement, broker connection, account funding, and trade execution.
- External market-data feed subscription or live exchange price ticker.
- Social, copy-trading, or signal-sharing features.
- Portfolio, position, or P&L tracking.
12. Glossary
- Chart photo — The image of a forex chart that the Forex Trader uploads; the sole input to a scan.
- Scan — The act of analysing an uploaded chart photo to produce levels, signal, prediction, risk levels, and confidence.
- Top level — The exact high marked on the uploaded chart.
- Bottom level — The exact low marked on the uploaded chart.
- Signal — The buy-or-sell indicator for the candle in the uploaded photo, produced before that candle moves.
- Predicted candle — The scanner's prediction of what the candle shown in the uploaded chart will do.
- Entry — The price level at which the analysed setup would be entered.
- SL (stop-loss) — The protective exit level for the analysed setup.
- TP (take-profit) — The target exit level for the analysed setup; TP1 and TP2 denote successive targets.
- R:R — The risk-to-reward ratio of the analysed setup.
- Confidence — The accuracy and confidence indication for a scan result, presented on a 270° needle gauge.
- Live Scan — The live, real-time scanning and analysis output for the current trading setup.
- Forex Trader — The sole active human persona: a retail forex trader who uploads chart photos and acts on the scanner's readout.
- Instrument face — The unified presentation of the complete readout — levels, signal, predicted candle, entry, SL, TP, and confidence — as one coherent calibrated display.
forex-trading-scanner
Upload a photo of a forex chart and the scanner returns a calibrated readout — the exact top and bottom level, a buy-or-sell indicator for the candle in the photo before it moves, the predicted candle, and the stop-loss and take-profit levels behind every call.
Live Illustrative sample chart
Reads the chart you upload — no broker connection
What the scanner reads and returns
The only input is a photo of a forex chart. The scanner reads that image and returns one calibrated ledger — marked levels, a direction, a predicted candle, a risk route and a confidence reading — laid out exactly as the instrument presents it.
- OUTPUT 01Exact top level
The high of the uploaded chart is located and ringed with an amber bezel; the price is set inside the marker itself.
PRICE1.0942 - OUTPUT 02Exact bottom level
The low of the chart is ringed with a teal bezel and the price reads inside it, joined to the top marker by a hairline axis.
PRICE1.0871 - OUTPUT 03Buy or sell indicator
Direction is read from the candle in the photo and returned before that candle moves — champagne amber for buy, teal for sell.
DIRECTIONBUY - OUTPUT 04Predicted candle
The next candle shape is projected from the pattern already visible in the uploaded screenshot.
FORECASTBullish continuation - OUTPUT 05Entry
The price the scanner reads as the point of engagement for the setup it has identified.
PRICE1.0918 - OUTPUT 06Stop loss
A stop-loss level is derived from the marked bottom of the range so the risk line is set before entry.
PRICE1.0871 - OUTPUT 07Take profit 1
First target, set above entry and measured from the chart levels — teal marks every take-profit level.
PRICE1.0986 - OUTPUT 08Take profit 2
Second target extending the same ladder, so the trader sees a full risk-and-reward route, not a single number.
PRICE1.1034 - OUTPUT 09Accuracy and confidence
Every read closes with a confidence value shown on a 270° instrument arc — never a badge or a progress bar.
GAUGE82
Chart scanner
forex-trading-scanner
Upload a photo of your forex chart and the scanner returns a calibrated readout — the exact top and bottom level, a buy or sell signal for the candle before it moves, the predicted candle, and the stop-loss and take-profit levels, with the confidence of every read.
forex-trading-scanner
Upload a photo of a forex chart and the scanner returns a calibrated readout — the exact top and bottom level, a buy-or-sell indicator for the candle in the photo before it moves, the predicted candle, and the stop-loss and take-profit levels behind every call.
LiveIllustrative sample chartReads the chart you upload — no broker connection
What the scanner reads and returns
The only input is a photo of a forex chart. The scanner reads that image and returns one calibrated ledger — marked levels, a direction, a predicted candle, a risk route and a confidence reading — laid out exactly as the instrument presents it.
- OUTPUT 01Exact top level
The high of the uploaded chart is located and ringed with an amber bezel; the price is set inside the marker itself.
PRICE1.0942 - OUTPUT 02Exact bottom level
The low of the chart is ringed with a teal bezel and the price reads inside it, joined to the top marker by a hairline axis.
PRICE1.0871 - OUTPUT 03Buy or sell indicator
Direction is read from the candle in the photo and returned before that candle moves — champagne amber for buy, teal for sell.
DIRECTIONBUY - OUTPUT 04Predicted candle
The next candle shape is projected from the pattern already visible in the uploaded screenshot.
FORECASTBullish continuation - OUTPUT 05Entry
The price the scanner reads as the point of engagement for the setup it has identified.
PRICE1.0918 - OUTPUT 06Stop loss
A stop-loss level is derived from the marked bottom of the range so the risk line is set before entry.
PRICE1.0871 - OUTPUT 07Take profit 1
First target, set above entry and measured from the chart levels — teal marks every take-profit level.
PRICE1.0986 - OUTPUT 08Take profit 2
Second target extending the same ladder, so the trader sees a full risk-and-reward route, not a single number.
PRICE1.1034 - OUTPUT 09Accuracy and confidence
Every read closes with a confidence value shown on a 270° instrument arc — never a badge or a progress bar.
GAUGE82
Chart scanner
forex-trading-scanner
Upload a photo of your forex chart and the scanner returns a calibrated readout — the exact top and bottom level, a buy or sell signal for the candle before it moves, the predicted candle, and the stop-loss and take-profit levels, with the confidence of every read.
No comments yet. Be the first!