forex-trading-scanner
 Mark Angel Ramos
Build a forex trading scanner that can scan and analyse the photo i upload that can mark the exact top and bottom level and make an indicator if i should go buy or sell based in the candle in the photo before it move with accuracy and confident live and real-time and will predict the candle and can give a sl, tp that will act like an professional bot chart scanner

Comments (0)
Sign in to leave a comment
forex-trading-scanner
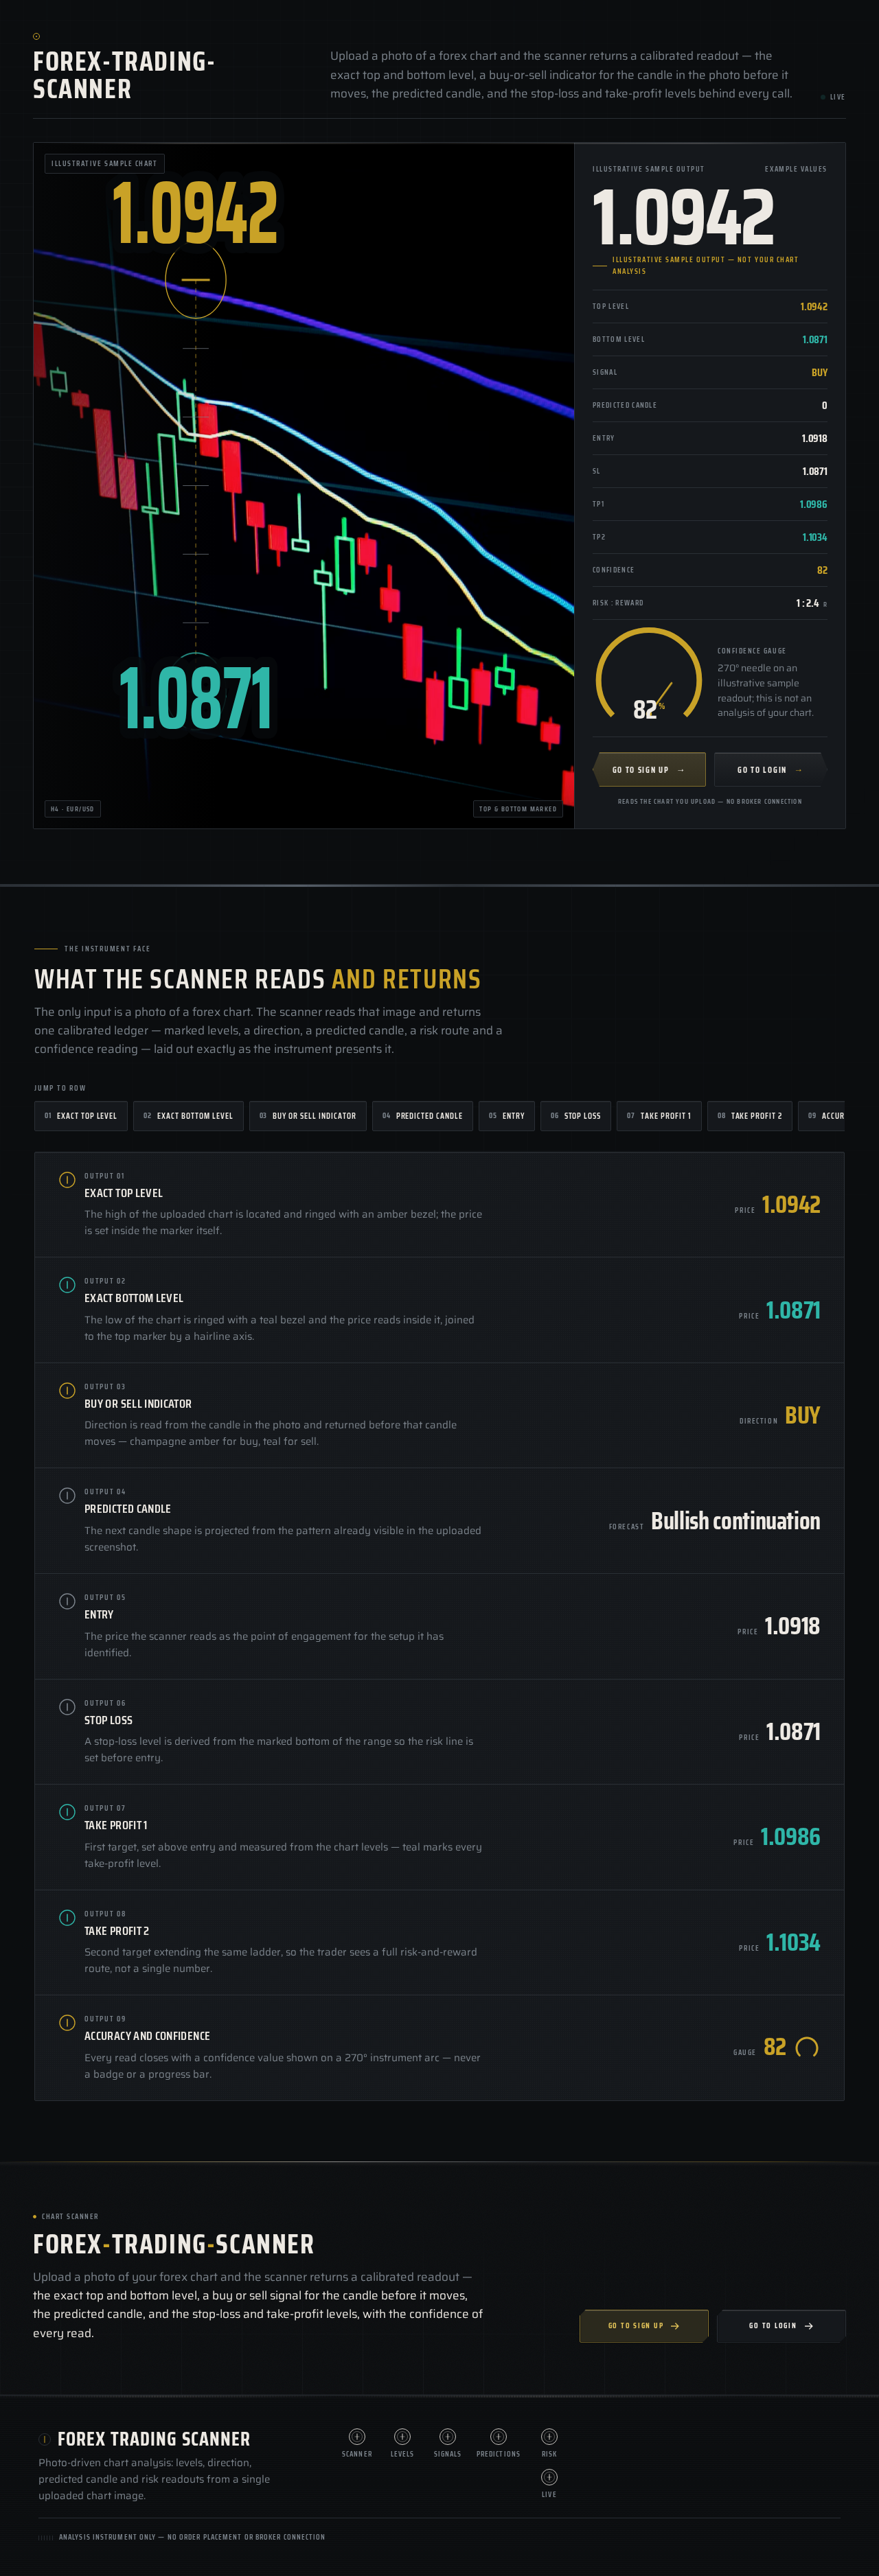
Upload a photo of a forex chart and the scanner returns a calibrated readout — the exact top and bottom level, a buy-or-sell indicator for the candle in the photo before it moves, the predicted candle, and the stop-loss and take-profit levels behind every call.
Live Illustrative sample chart
Reads the chart you upload — no broker connection
What the scanner reads and returns
The only input is a photo of a forex chart. The scanner reads that image and returns one calibrated ledger — marked levels, a direction, a predicted candle, a risk route and a confidence reading — laid out exactly as the instrument presents it.
- OUTPUT 01Exact top level
The high of the uploaded chart is located and ringed with an amber bezel; the price is set inside the marker itself.
PRICE1.0942 - OUTPUT 02Exact bottom level
The low of the chart is ringed with a teal bezel and the price reads inside it, joined to the top marker by a hairline axis.
PRICE1.0871 - OUTPUT 03Buy or sell indicator
Direction is read from the candle in the photo and returned before that candle moves — champagne amber for buy, teal for sell.
DIRECTIONBUY - OUTPUT 04Predicted candle
The next candle shape is projected from the pattern already visible in the uploaded screenshot.
FORECASTBullish continuation - OUTPUT 05Entry
The price the scanner reads as the point of engagement for the setup it has identified.
PRICE1.0918 - OUTPUT 06Stop loss
A stop-loss level is derived from the marked bottom of the range so the risk line is set before entry.
PRICE1.0871 - OUTPUT 07Take profit 1
First target, set above entry and measured from the chart levels — teal marks every take-profit level.
PRICE1.0986 - OUTPUT 08Take profit 2
Second target extending the same ladder, so the trader sees a full risk-and-reward route, not a single number.
PRICE1.1034 - OUTPUT 09Accuracy and confidence
Every read closes with a confidence value shown on a 270° instrument arc — never a badge or a progress bar.
GAUGE82
Chart scanner
forex-trading-scanner
Upload a photo of your forex chart and the scanner returns a calibrated readout — the exact top and bottom level, a buy or sell signal for the candle before it moves, the predicted candle, and the stop-loss and take-profit levels, with the confidence of every read.
forex-trading-scanner
Upload a photo of a forex chart and the scanner returns a calibrated readout — the exact top and bottom level, a buy-or-sell indicator for the candle in the photo before it moves, the predicted candle, and the stop-loss and take-profit levels behind every call.
LiveIllustrative sample chartReads the chart you upload — no broker connection
What the scanner reads and returns
The only input is a photo of a forex chart. The scanner reads that image and returns one calibrated ledger — marked levels, a direction, a predicted candle, a risk route and a confidence reading — laid out exactly as the instrument presents it.
- OUTPUT 01Exact top level
The high of the uploaded chart is located and ringed with an amber bezel; the price is set inside the marker itself.
PRICE1.0942 - OUTPUT 02Exact bottom level
The low of the chart is ringed with a teal bezel and the price reads inside it, joined to the top marker by a hairline axis.
PRICE1.0871 - OUTPUT 03Buy or sell indicator
Direction is read from the candle in the photo and returned before that candle moves — champagne amber for buy, teal for sell.
DIRECTIONBUY - OUTPUT 04Predicted candle
The next candle shape is projected from the pattern already visible in the uploaded screenshot.
FORECASTBullish continuation - OUTPUT 05Entry
The price the scanner reads as the point of engagement for the setup it has identified.
PRICE1.0918 - OUTPUT 06Stop loss
A stop-loss level is derived from the marked bottom of the range so the risk line is set before entry.
PRICE1.0871 - OUTPUT 07Take profit 1
First target, set above entry and measured from the chart levels — teal marks every take-profit level.
PRICE1.0986 - OUTPUT 08Take profit 2
Second target extending the same ladder, so the trader sees a full risk-and-reward route, not a single number.
PRICE1.1034 - OUTPUT 09Accuracy and confidence
Every read closes with a confidence value shown on a 270° instrument arc — never a badge or a progress bar.
GAUGE82
Chart scanner
forex-trading-scanner
Upload a photo of your forex chart and the scanner returns a calibrated readout — the exact top and bottom level, a buy or sell signal for the candle before it moves, the predicted candle, and the stop-loss and take-profit levels, with the confidence of every read.
No comments yet. Be the first!