bright-sky
 Mr Nobody
build this app


Comments (0)
Sign in to leave a comment
Architecture
No Services Diagrams Yet
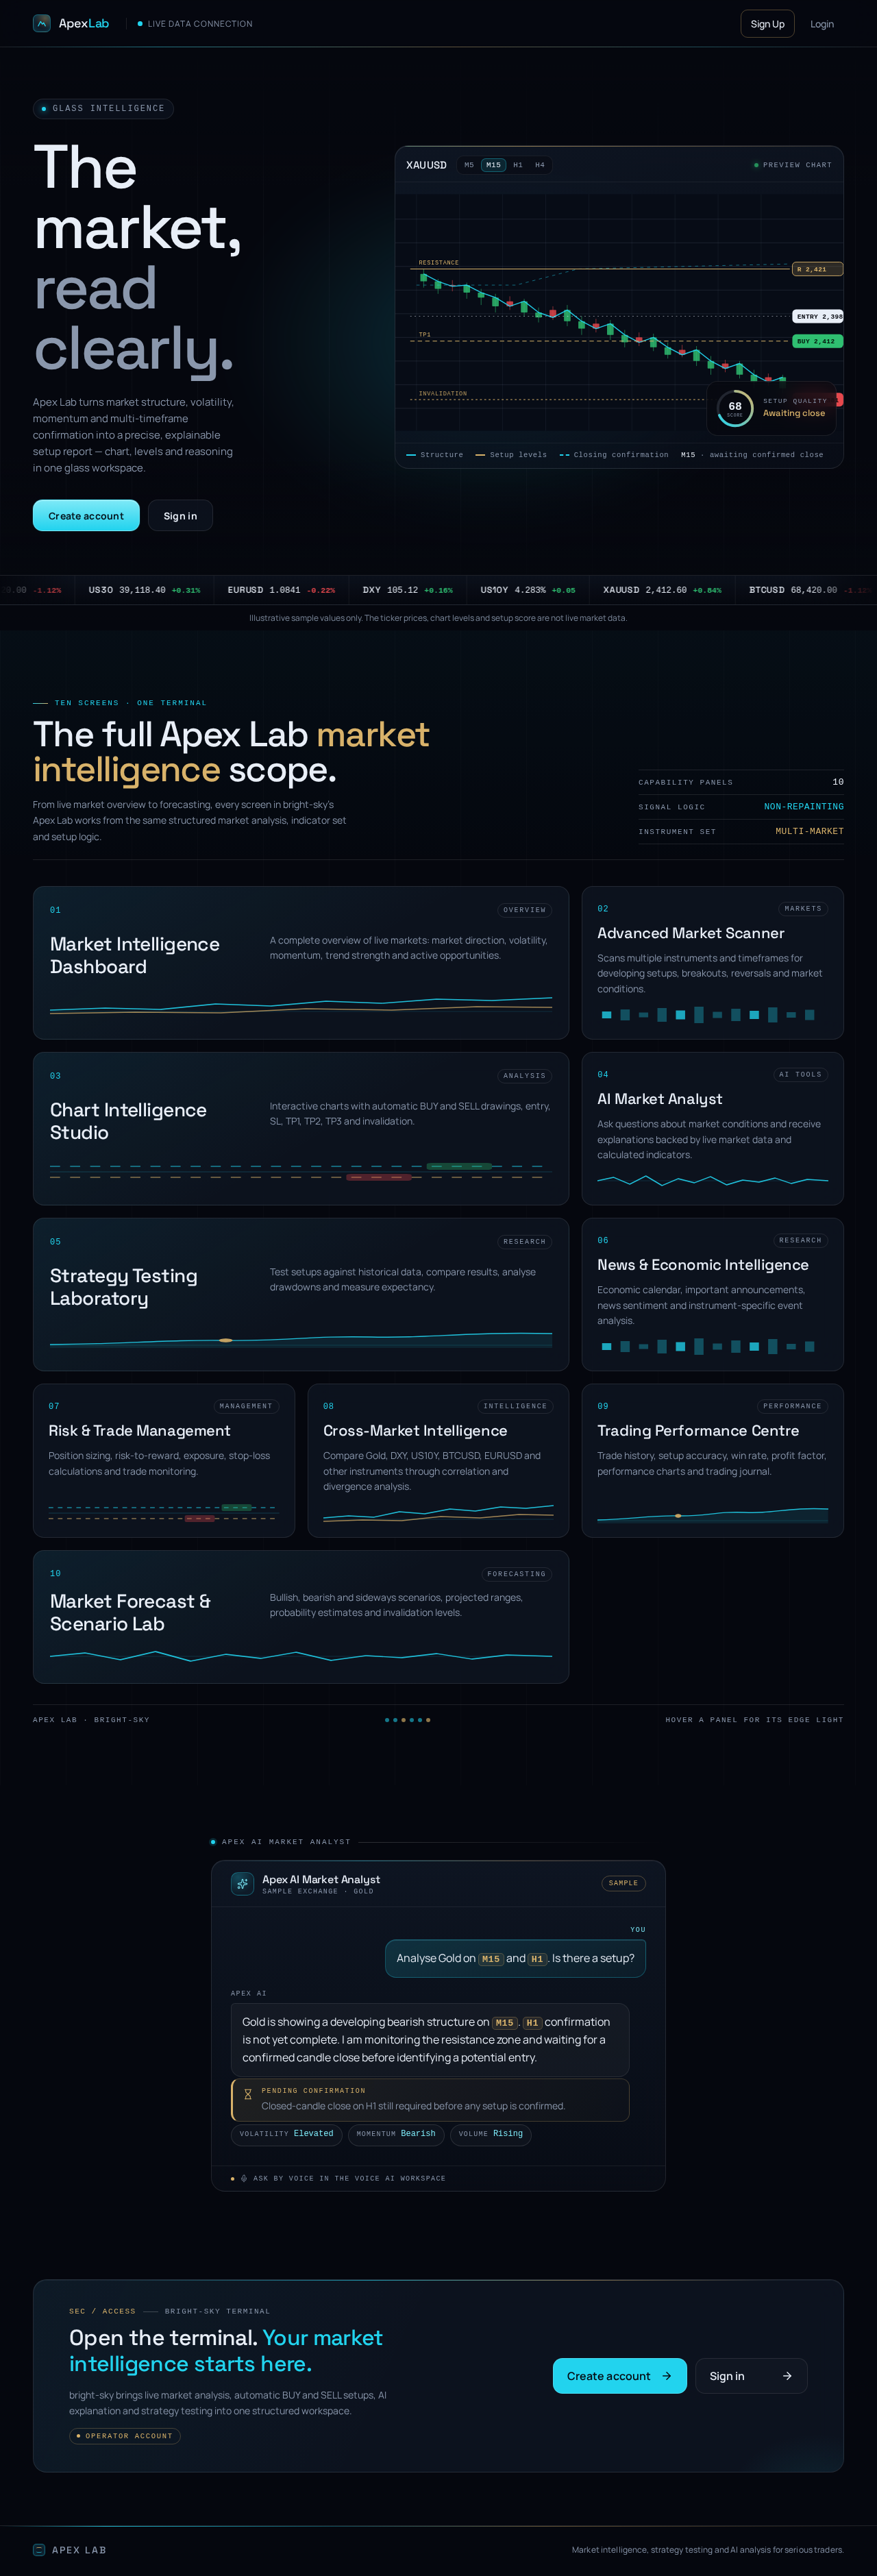
The market, read clearly.
Apex Lab turns market structure, volatility, momentum and multi-timeframe confirmation into a precise, explainable setup report — chart, levels and reasoning in one glass workspace.
Illustrative sample values only. The ticker prices, chart levels and setup score are not live market data.
The full Apex Lab market intelligence scope.
From live market overview to forecasting, every screen in bright-sky's Apex Lab works from the same structured market analysis, indicator set and setup logic.
- 01Overview
Market Intelligence Dashboard
A complete overview of live markets: market direction, volatility, momentum, trend strength and active opportunities.
- 02Markets
Advanced Market Scanner
Scans multiple instruments and timeframes for developing setups, breakouts, reversals and market conditions.
- 03Analysis
Chart Intelligence Studio
Interactive charts with automatic BUY and SELL drawings, entry, SL, TP1, TP2, TP3 and invalidation.
- 04AI Tools
AI Market Analyst
Ask questions about market conditions and receive explanations backed by live market data and calculated indicators.
- 05Research
Strategy Testing Laboratory
Test setups against historical data, compare results, analyse drawdowns and measure expectancy.
- 06Research
News & Economic Intelligence
Economic calendar, important announcements, news sentiment and instrument-specific event analysis.
- 07Management
Risk & Trade Management
Position sizing, risk-to-reward, exposure, stop-loss calculations and trade monitoring.
- 08Intelligence
Cross-Market Intelligence
Compare Gold, DXY, US10Y, BTCUSD, EURUSD and other instruments through correlation and divergence analysis.
- 09Performance
Trading Performance Centre
Trade history, setup accuracy, win rate, profit factor, performance charts and trading journal.
- 10Forecasting
Market Forecast & Scenario Lab
Bullish, bearish and sideways scenarios, projected ranges, probability estimates and invalidation levels.
Analyse Gold on M15 and H1. Is there a setup?
Gold is showing a developing bearish structure on M15. H1 confirmation is not yet complete. I am monitoring the resistance zone and waiting for a confirmed candle close before identifying a potential entry.
Open the terminal. Your market intelligence starts here.
bright-sky brings live market analysis, automatic BUY and SELL setups, AI explanation and strategy testing into one structured workspace.
Operator accountThe market, read clearly.
Apex Lab turns market structure, volatility, momentum and multi-timeframe confirmation into a precise, explainable setup report — chart, levels and reasoning in one glass workspace.
Illustrative sample values only. The ticker prices, chart levels and setup score are not live market data.
The full Apex Lab market intelligence scope.
From live market overview to forecasting, every screen in bright-sky's Apex Lab works from the same structured market analysis, indicator set and setup logic.
- 01Overview
Market Intelligence Dashboard
A complete overview of live markets: market direction, volatility, momentum, trend strength and active opportunities.
- 02Markets
Advanced Market Scanner
Scans multiple instruments and timeframes for developing setups, breakouts, reversals and market conditions.
- 03Analysis
Chart Intelligence Studio
Interactive charts with automatic BUY and SELL drawings, entry, SL, TP1, TP2, TP3 and invalidation.
- 04AI Tools
AI Market Analyst
Ask questions about market conditions and receive explanations backed by live market data and calculated indicators.
- 05Research
Strategy Testing Laboratory
Test setups against historical data, compare results, analyse drawdowns and measure expectancy.
- 06Research
News & Economic Intelligence
Economic calendar, important announcements, news sentiment and instrument-specific event analysis.
- 07Management
Risk & Trade Management
Position sizing, risk-to-reward, exposure, stop-loss calculations and trade monitoring.
- 08Intelligence
Cross-Market Intelligence
Compare Gold, DXY, US10Y, BTCUSD, EURUSD and other instruments through correlation and divergence analysis.
- 09Performance
Trading Performance Centre
Trade history, setup accuracy, win rate, profit factor, performance charts and trading journal.
- 10Forecasting
Market Forecast & Scenario Lab
Bullish, bearish and sideways scenarios, projected ranges, probability estimates and invalidation levels.
Analyse Gold on M15 and H1. Is there a setup?
Gold is showing a developing bearish structure on M15. H1 confirmation is not yet complete. I am monitoring the resistance zone and waiting for a confirmed candle close before identifying a potential entry.
Open the terminal. Your market intelligence starts here.
bright-sky brings live market analysis, automatic BUY and SELL setups, AI explanation and strategy testing into one structured workspace.
Operator account
No comments yet. Be the first!