WorkForce_Hub
 Meet Kanteliya
Build a full-stack HR Management System (HRMS) web application with the following complete specifications: === PROJECT OVERVIEW === A modern, production-grade HRMS SaaS platform with 4 role-based portals: Super Admin, HR, Manager, and Employee. Dark + light mode. Premium UI feel like Linear.app meets Rippling. === TECH STACK === Frontend: Next.js 14, Tailwind CSS, Shadcn UI, Framer Motion, Recharts, React Hook Form Backend: FastAPI (Python), PostgreSQL, Redis Auth: JWT with refresh token rotation Deployment: Docker Compose + Nginx === ROLES & PERMISSIONS === SUPER ADMIN: - Manage entire organization - Create/delete HR and Manager accounts - View all analytics and reports - System settings and configuration - Audit logs of all actions HR: - Add/edit/offboard employees - Approve or reject leave requests - Run payroll for all employees - Generate HR reports - Manage departments and positions - Send announcements MANAGER: - View their team members only - Approve/reject team leave requests - Assign and track tasks for team - Write performance reviews - View team attendance EMPLOYEE: - View own profile and payslips - Apply for leaves - View assigned tasks - Check attendance history - View team announcements === CORE MODULES === 1. AUTH MODULE - Login page with smooth animation - JWT access + refresh token - Role-based redirect after login - Forgot password flow 2. DASHBOARD (role-specific) - Admin: org stats, headcount, payroll summary, recent activity - HR: pending leaves, new joiners, payroll status, department chart - Manager: team attendance today, pending approvals, task progress - Employee: my leaves balance, upcoming tasks, recent payslip 3. EMPLOYEE MANAGEMENT - Employee list with search, filter, sort by department/role/status - Employee profile page: personal info, documents, employment history - Add employee form with validation - Soft delete / offboarding flow - Export employee data as CSV 4. LEAVE MANAGEMENT - Employee applies for leave with date range + reason - Manager/HR approves or rejects - Leave balance tracker (casual, sick, earned) - Leave calendar view - Email notification on status change 5. ATTENDANCE - Daily attendance log per employee - Clock in / clock out (manual) - Monthly attendance summary table - Absent / present / late status - Manager can view full team 6. PAYROLL - HR inputs salary components: base, HRA, bonus, deductions - Auto calculate net salary - Generate payslip PDF per employee - Payroll history by month - Export payroll report 7. TASK MANAGEMENT - Manager assigns tasks to employees - Task: title, description, due date, priority, status - Employee updates task status - Kanban board view (Todo / In Progress / Done) - Task completion analytics 8. PERFORMANCE REVIEW - Manager writes quarterly review - Rating system (1-5) per skill - Employee views their review - Historical review archive 9. ANNOUNCEMENTS - HR posts company announcements - All employees see in dashboard - Filter by department 10. REPORTS & ANALYTICS - Headcount by department (bar chart) - Monthly attendance rate (line chart) - Leave utilization (pie chart) - Payroll cost over time (area chart) - Export reports as PDF/CSV === UI/UX REQUIREMENTS === - Dark mode default, light mode toggle - Sidebar navigation with icons - Smooth page transitions (Framer Motion) - Skeleton loading states - Toast notifications for actions - Responsive — works on mobile - Empty states with illustration - Consistent color system: Primary #6366F1 (indigo) Success #10B981 Warning #F59E0B Error #EF4444 Background dark: #0F0F0F Card dark: #1A1A1A === DATABASE SCHEMA === Tables needed: - users (id, name, email, password_hash, role, is_active) - employees (id, user_id, department_id, manager_id, position, salary, join_date, status) - departments (id, name, manager_id) - leaves (id, employee_id, type, start_date, end_date, reason, status, approved_by) - attendance (id, employee_id, date, clock_in, clock_out, status) - payroll (id, employee_id, month, basic, hra, bonus, deductions, net_salary, generated_at) - tasks (id, title, description, assigned_to, assigned_by, due_date, priority, status) - performance_reviews (id, employee_id, reviewer_id, quarter, year, ratings_json, comments) - announcements (id, title, content, department_id, created_by, created_at) === API ENDPOINTS === /auth/login POST /auth/refresh POST /employees GET POST PUT DELETE /employees/{id}/profile GET /leaves GET POST /leaves/{id}/approve PUT /leaves/{id}/reject PUT /attendance GET POST /payroll GET POST /payroll/{id}/payslip GET /tasks GET POST PUT DELETE /performance GET POST /announcements GET POST /reports/headcount GET /reports/attendance GET /reports/payroll GET === DEPLOYMENT === Docker Compose with: - frontend (Next.js) container - backend (FastAPI) container - postgres container - redis container - nginx reverse proxy Include .env.example file Include README with setup steps


Comments (0)
Sign in to leave a comment
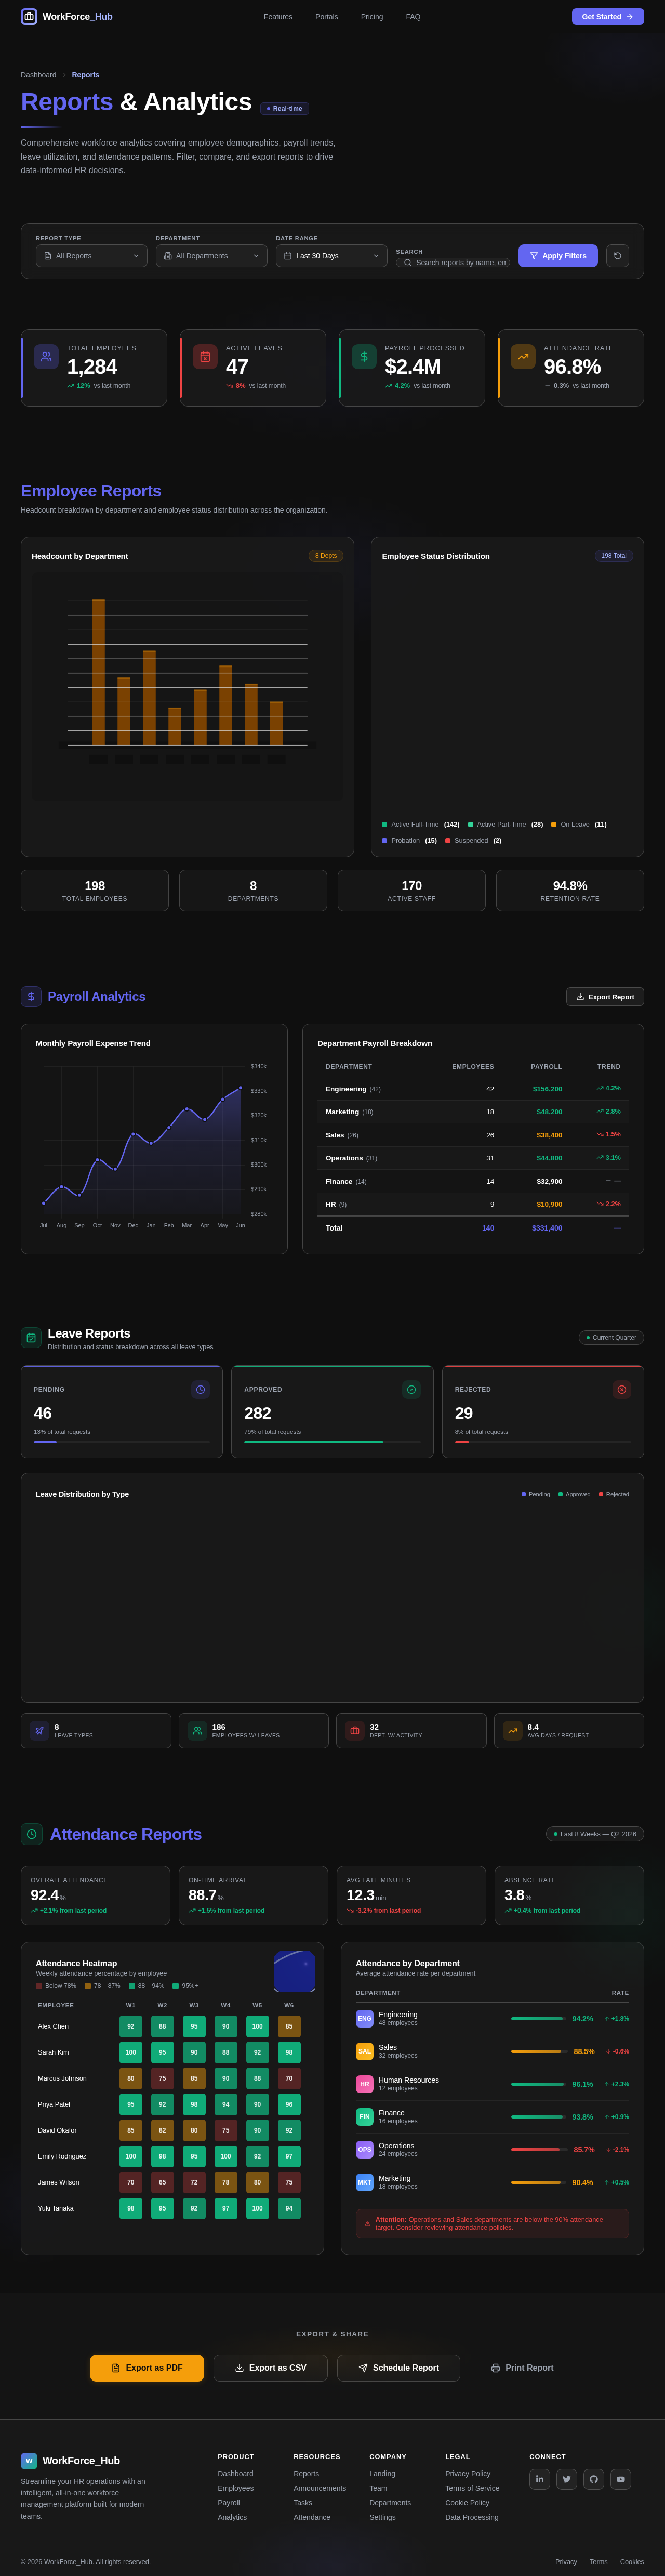
Reports & Analytics
Real-timeComprehensive workforce analytics covering employee demographics, payroll trends, leave utilization, and attendance patterns. Filter, compare, and export reports to drive data-informed HR decisions.
Total Employees
1,284
12%vs last monthActive Leaves
47
8%vs last monthPayroll Processed
$2.4M
4.2%vs last monthAttendance Rate
96.8%
0.3%vs last monthEmployee Reports
Headcount breakdown by department and employee status distribution across the organization.
Headcount by Department
8 DeptsEmployee Status Distribution
198 Total198
Total Employees
8
Departments
170
Active Staff
94.8%
Retention Rate
Payroll Analytics
Monthly Payroll Expense Trend
Department Payroll Breakdown
| Department | Employees | Payroll | Trend |
|---|---|---|---|
| Engineering(42) | 42 | $156,200 | 4.2% |
| Marketing(18) | 18 | $48,200 | 2.8% |
| Sales(26) | 26 | $38,400 | 1.5% |
| Operations(31) | 31 | $44,800 | 3.1% |
| Finance(14) | 14 | $32,900 | — |
| HR(9) | 9 | $10,900 | 2.2% |
| Total | 140 | $331,400 | — |
Leave Reports
Distribution and status breakdown across all leave types
Attendance Reports
Attendance Heatmap
Weekly attendance percentage by employee
| Employee | W1 | W2 | W3 | W4 | W5 | W6 | W7 | W8 |
|---|---|---|---|---|---|---|---|---|
| Alex Chen | 92 | 88 | 95 | 90 | 100 | 85 | 92 | 97 |
| Sarah Kim | 100 | 95 | 90 | 88 | 92 | 98 | 94 | 100 |
| Marcus Johnson | 80 | 75 | 85 | 90 | 88 | 70 | 65 | 78 |
| Priya Patel | 95 | 92 | 98 | 94 | 90 | 96 | 93 | 95 |
| David Okafor | 85 | 82 | 80 | 75 | 90 | 92 | 88 | 85 |
| Emily Rodriguez | 100 | 98 | 95 | 100 | 92 | 97 | 100 | 96 |
| James Wilson | 70 | 65 | 72 | 78 | 80 | 75 | 82 | 68 |
| Yuki Tanaka | 98 | 95 | 92 | 97 | 100 | 94 | 96 | 99 |
Attendance by Department
Average attendance rate per department
| Department | Rate |
|---|---|
ENG Engineering 48 employees | 94.2%+1.8% |
SAL Sales 32 employees | 88.5%-0.6% |
HR Human Resources 12 employees | 96.1%+2.3% |
FIN Finance 16 employees | 93.8%+0.9% |
OPS Operations 24 employees | 85.7%-2.1% |
MKT Marketing 18 employees | 90.4%+0.5% |

Your Entire HR Operation, One Hub
Streamline hiring, payroll, attendance, performance reviews, and team management in a single powerful platform built for modern workplaces.
Everything You Need to Manage Your Workforce
From onboarding to offboarding, WorkForce_Hub gives your HR team the tools to handle every people operation in one place.
Employee Management
Add, edit, and offboard employees with full lifecycle tracking across departments and positions.
Leave & Attendance
Streamline leave requests with multi-level approvals and real-time attendance monitoring.
Payroll & Payslips
Run automated payroll, generate digital payslips, and maintain transparent salary records.
Performance Reviews
Conduct structured 360-degree reviews with goal tracking and competency-based evaluations.
Task Management
Assign, prioritize, and track team tasks with deadlines, statuses, and workload visibility.
Announcements & Reports
Broadcast organization-wide announcements and generate detailed HR analytics reports on demand.
Four Portals, One Platform
Every team member gets a tailored experience. From full system oversight to focused daily tasks, WorkForce_Hub adapts to your role.
Super Admin
Full organizational control at your fingertips.
- ▸Manage and configure the entire organization
- ▸Create and delete HR & Manager accounts
- ▸View comprehensive analytics and reports
- ▸Access full audit logs of all system actions
HR
Streamline the employee lifecycle end-to-end.
- ▸Add, edit, and offboard employees seamlessly
- ▸Approve or reject leave requests
- ▸Run payroll for all employees
- ▸Manage departments, positions, and announcements
Manager
Lead your team with clarity and insight.
- ▸View and manage your team members
- ▸Approve or reject team leave requests
- ▸Assign and track tasks for your team
- ▸Write performance reviews and view attendance
Employee
Everything you need, right where you work.
- ▸View your profile, payslips, and attendance
- ▸Apply for leaves and track approval status
- ▸View assigned tasks and deadlines
- ▸Stay updated with team announcements
Up and Running in Minutes
Three simple steps to transform your HR operations. No complex setup, no steep learning curve.
Create Your Workspace
Set up your organization in minutes. Configure departments, define roles, and establish your company hierarchy with an intuitive setup wizard.
Invite Your Team
Bulk import employees via CSV or invite them individually. Automatic onboarding emails get everyone set up without IT bottlenecks.
Start Managing
Go live with payroll processing, leave management, task tracking, and real-time attendance — all from a single dashboard.
Simple, Transparent Pricing
Choose the plan that fits your team. Start free and scale as you grow.
- Up to 10 employees
- Basic attendance tracking
- Leave management
- Employee directory
- Email support
- Payroll processing
- Advanced analytics
- Priority support
- Unlimited employees
- Full attendance & shifts
- Leave & holiday management
- Payroll processing & payslips
- Performance reviews
- Advanced analytics & reports
- Priority email & chat support
- Custom departments & roles
- Unlimited employees
- All Professional features
- Single Sign-On (SSO/SAML)
- Dedicated account manager
- Custom SLA guarantee
- On-premise deployment option
- API access & integrations
- 24/7 phone & chat support
Ready to Transform Your HR Workflow?
Join thousands of teams streamlining their people operations with WorkForce_Hub — set up in minutes, no credit card required.
No comments yet. Be the first!