Jk patel .in
 Jk patel jk
BUILD A PROFESSIONAL STOCK MARKET WEB APPLICATION CALLED "PAISA BANAO STRATEGY PRO" GOAL: Create a fully automated intraday cash-market stock scanner based on the Paisa Banao Strategy. The system must scan NSE stocks in real time and generate Buy/Sell setups automatically. DATA SOURCE: * Real-time NSE stock data * Real-time volume data * Market breadth data (Advance / Decline) * Historical 5-minute candle data * Auto-refresh every 10 seconds DASHBOARD LAYOUT: SECTION 1: MARKET SENTIMENT * Show Advance Count * Show Decline Count * Show Advance/Decline Ratio * Market Status: * Bullish (Green) * Bearish (Red) * Neutral (Yellow) RULE: If Advances > Declines: Show only BUY candidates If Declines > Advances: Show only SELL candidates SECTION 2: 09:25 AUTO SCANNER At exactly 09:25 AM: If Market Bullish: * Scan Top 20 Gainers * Display Top 5 strongest candidates If Market Bearish: * Scan Top 20 Losers * Display Top 5 strongest candidates Show: * Symbol * Sector * LTP * Gap % * Volume * Relative Volume * Strength Score SECTION 3: PAISA BANAO SETUP DETECTION TIMEFRAME: 5 Minutes BUY LOGIC: 1. First candle (09:15) must be Green. 2. Ignore first 3 candles. 3. After 09:30 look for Red candle. 4. That Red candle must have lowest volume among recent candles. 5. Entry = Break of High. 6. Stop Loss = Low of Signal Candle. 7. If new lower volume Red candle appears before trigger: Update Entry and SL automatically. 8. Setup valid till 11:00 AM only. SELL LOGIC: 1. First candle (09:15) must be Red. 2. Ignore first 3 candles. 3. Look for Green candle. 4. Green candle volume must be lowest. 5. Entry below Low. 6. SL above High. 7. Update if lower volume candle appears. 8. Valid till 11:00 AM. INVALID CONDITIONS: * Volume increasing continuously * Entry not triggered before 11:00 AM * Opposite structure break SECTION 4: LIVE SIGNAL TABLE Columns: * Symbol * Direction * Entry * Stop Loss * Risk * Target 1 (1:2 RR) * Quantity Size * Volume Score * Setup Quality * Status Status: * Waiting * Triggered * Target Hit * Breakeven * Closed SECTION 5: CHART ANALYSIS When user clicks any stock: Open full screen chart. Display: * Signal Candle * Entry Line * Stop Loss Line * Target Line * Volume Histogram * Market Breadth Data * Setup Explanation AUTO GENERATE TEXT: Example: "BUY setup detected because first candle was bullish. Lowest volume red candle formed at 10:05 AM. Smart Money accumulation suspected. Entry above 1250.50 with stop loss at 1241.20. Risk Reward 1:2." SECTION 6: RISK MANAGEMENT Capital Input Box Default: ₹100000 Risk: 0.20% per trade Auto calculate: Position Size Risk Amount Reward Amount Daily Rules: Max Trades: 4 Daily Max Loss: 1% SECTION 7: TRADE MANAGEMENT When 1:2 RR achieved: * Book 50% automatically * Move SL to Breakeven * Hold remaining quantity Display: Live RR Profit Loss Open PNL SECTION 8: SECTOR ANALYSIS Show: * Sector Name * Stocks Advancing * Stocks Declining * Sector Strength % Highlight strongest sector. SECTION 9: TOP GAINERS & TOP LOSERS Separate panels: Top 5 Gainers Top 5 Losers Show: * Volume Spike % * Relative Strength * Setup Availability SECTION 10: ALERTS Telegram Alerts WhatsApp Alerts Browser Notifications Send alert when: * Setup Found * Entry Triggered * Target Hit * SL Hit * Breakeven Activated SECTION 11: AI SCORE Generate score from: * Volume Pattern * Market Breadth * Relative Strength * Gap % * Sector Strength Final Score: 0-100 Only show setups above 80 score. SECTION 12: BACKTEST ENGINE Allow testing: Last 1 Month Last 3 Months Last 6 Months Last 1 Year Display: Win Rate Profit Factor Max Drawdown Average RR Total Trades SECTION 13: UI FEATURES * Dark Mode * Mobile Responsive * Dashboard Hide/Show Button * Fast Loading * Real-Time Updates * Full Screen Charts * Search Stock * Export Signals to CSV * Export Signals to Google Sheets IMPORTANT: Use only real-time data. No dummy data. No placeholder charts. No fake signals. All calculations must be automatic. Optimize for Indian stock market and NSE cash stocks.


Comments (0)
Sign in to leave a comment
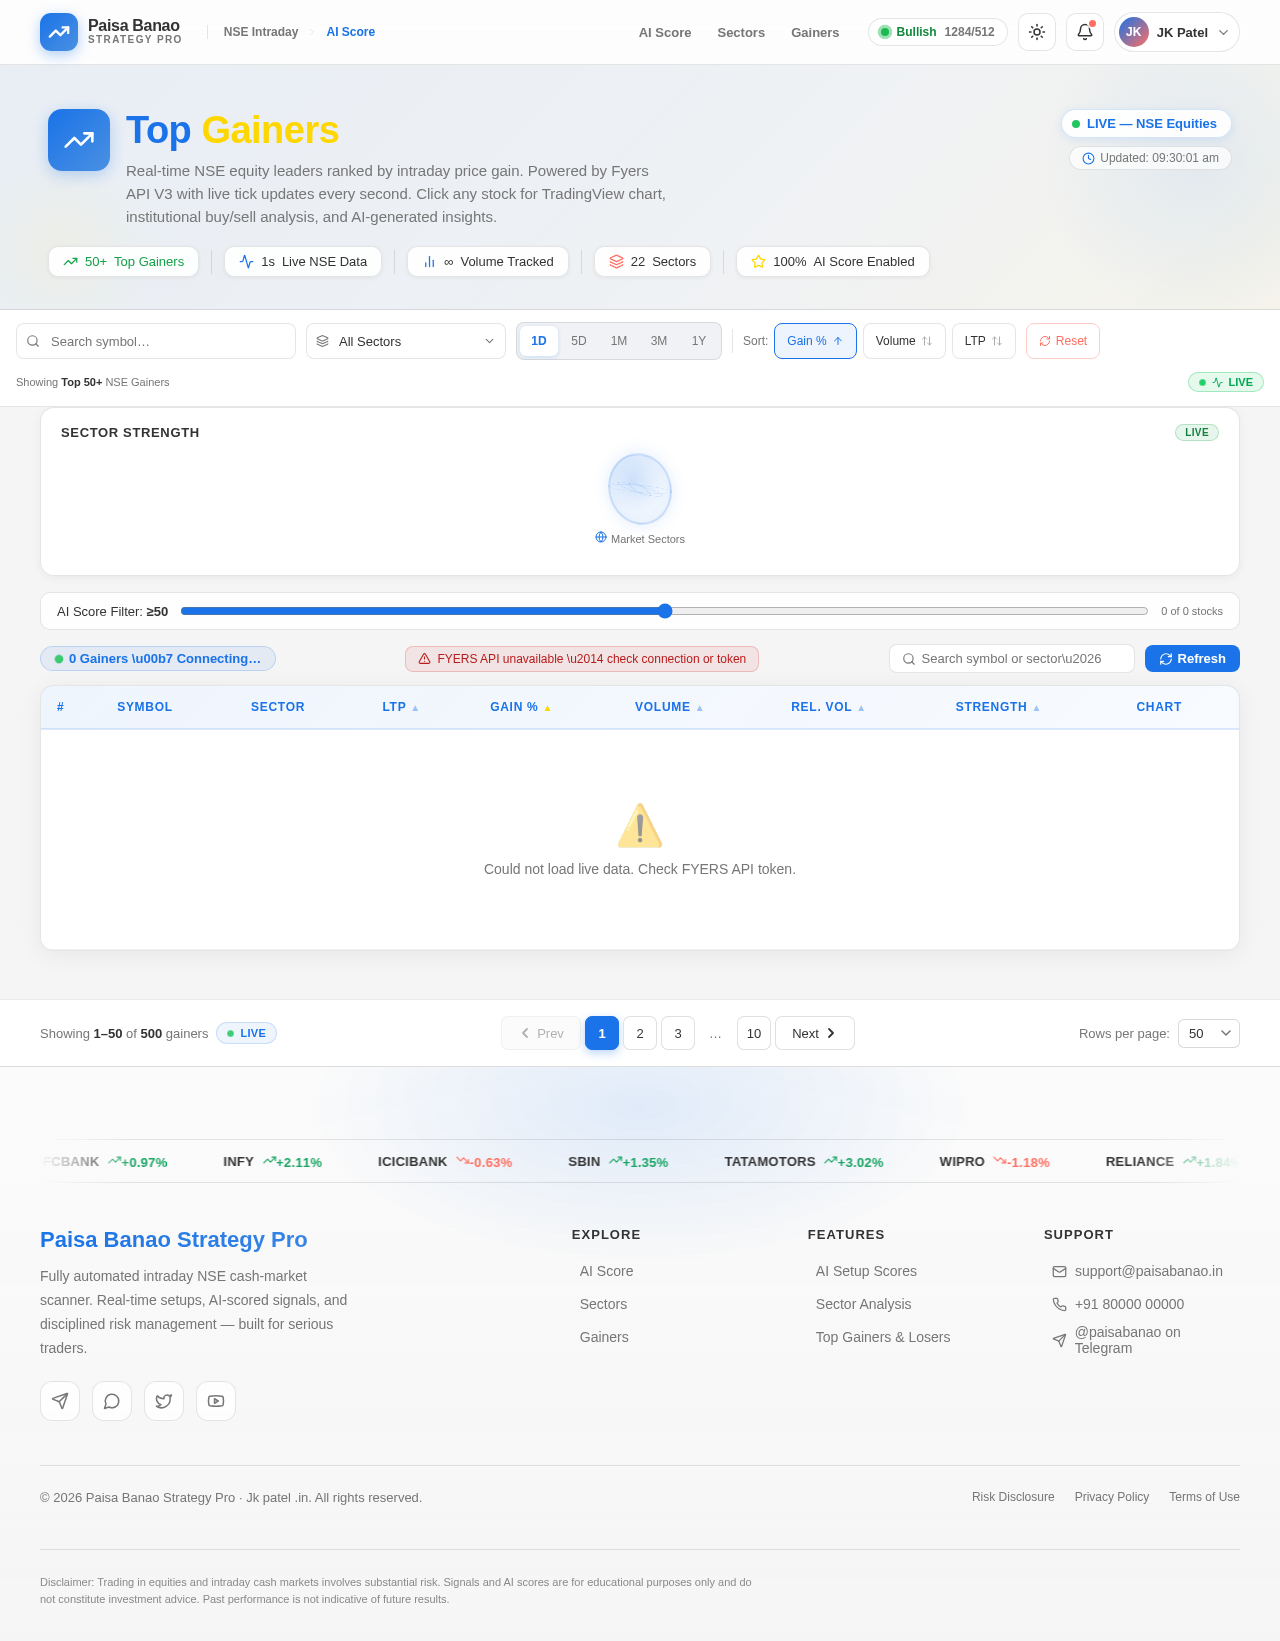
Top Gainers
Real-time NSE equity leaders ranked by intraday price gain. Powered by Fyers API V3 with live tick updates every second. Click any stock for TradingView chart, institutional buy/sell analysis, and AI-generated insights.
| # | Symbol | Sector | LTP | Gain % | Volume | Rel. Vol | Strength | Chart |
|---|---|---|---|---|---|---|---|---|
Could not load live data. Check FYERS API token. | ||||||||
No comments yet. Be the first!