super-production
 Dipesh Mishra
Here's your full Assembly Line Production Tracker — two views in one app: Employee Side: Fill in a start form with product name, category, expected duration, tools (with autocomplete + tags), and work station A live timer runs with a progress bar — it turns amber/red if the run exceeds the expected time On stopping, a completion form captures units produced, quality result, and logbook notes If the run ran over expected time, a mandatory delay justification comment box appears before submission Admin Dashboard: 4 metric cards: total runs, delayed runs, units produced, average duration A filterable table by date range, category, on-time/delayed status, and search — with delay comments visible inline 3 charts: actual vs expected duration (bar), on-time vs delayed split (doughnut), and daily unit output (line) Download CSV button exports filtered data with the date range in the filename
Comments (0)
Sign in to leave a comment
System Requirements
System Requirements Document (SRD)
Project Name: super-production
1. Introduction
The super-production project is an advanced Assembly Line Production Tracker designed to enhance efficiency, accountability, and transparency in manufacturing environments. Developed with scalability in mind, this system supports multiple stations and teams across a factory, enabling detailed insights into station-specific performance and delays.
This document outlines the system requirements for super-production, tailored to meet the needs of Dipesh Mishra's production setup in India. Locale-specific defaults, such as IST (Indian Standard Time) and INR (Indian Rupee), will be assumed where relevant.
2. System Overview
The super-production system consists of two primary components:
-
Employee Side:
A user-friendly interface for employees to log production runs, track progress, and report outcomes. -
Admin Dashboard:
A powerful analytics and management tool for administrators to monitor performance, analyze delays, and make data-driven decisions.
The system is designed to support multiple stations, with distinct logins for each station and an overarching admin role to view and manage data across all stations.
3. Functional Requirements
Employee Side
- As an Employee, I should be able to fill in a start form with product name, category, expected duration, tools (with autocomplete + tags), and work station.
- As an Employee, I should see a live timer with a progress bar that turns amber/red if the run exceeds the expected time.
- As an Employee, I should be able to stop the timer and fill in a completion form capturing units produced, quality result, and logbook notes.
- As an Employee, I should see a mandatory delay justification comment box if the run exceeds the expected time before submission.
Admin Dashboard
- As an Admin, I should see 4 metric cards: total runs, delayed runs, units produced, and average duration.
- As an Admin, I should be able to view a filterable table by date range, category, on-time/delayed status, and search — with delay comments visible inline.
- As an Admin, I should see 3 charts: actual vs expected duration (bar), on-time vs delayed split (doughnut), and daily unit output (line).
- As an Admin, I should be able to download filtered data as a CSV file, with the date range included in the filename.
- As an Admin, I should be able to view data aggregated across all stations or filter it by specific stations.
4. User Personas
1. Employee
- Role: Operates at a specific station, logs production runs, and reports outcomes.
- Needs: Simple and intuitive interface to track and report production efficiently.
2. Admin
- Role: Oversees multiple stations, analyzes performance metrics, and makes operational decisions.
- Needs: Comprehensive dashboard with actionable insights and the ability to manage data across stations.
5. Visuals Colors and Theme
Color Palette
The super-production project will use a modern, industrial-inspired color palette to reflect its focus on manufacturing efficiency:
- Background: #F5F5F5 (Light Gray)
- Surface: #FFFFFF (White)
- Text: #333333 (Dark Gray)
- Accent: #FF6F00 (Amber Orange)
- Muted Tones: #B0BEC5 (Steel Blue)
6. Signature Design Concept
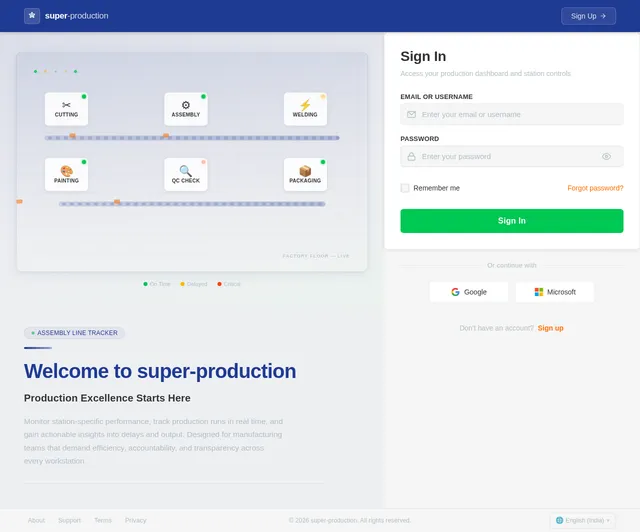
The super-production homepage will feature an interactive factory floor visualization.
Concept Details:
- Visual Layout: The homepage will display a 3D-rendered factory floor with animated workstations. Each station will be clickable, revealing real-time metrics such as active runs, delays, and units produced.
- Animations: Conveyor belts will move subtly in the background, and machinery will have animated blinking lights to create a dynamic, immersive experience.
- Transitions: Smooth zoom-in and zoom-out effects will allow users to navigate between the factory overview and specific station details.
- Micro-Interactions: Hovering over a station will display a tooltip with key stats, and clicking will open a detailed view.
- Color Shifts: The factory floor will use the color palette, with amber/red highlights for delayed stations and green for on-time stations.
This design will make the system visually engaging and provide an intuitive way to access station-specific data.
7. Non-Functional Requirements
- The system must support concurrent users across multiple stations without performance degradation.
- The system should ensure data security and role-based access control.
- The system must be optimized for both desktop and mobile devices.
- The system should support IST (Indian Standard Time) for all timestamps.
- The system must handle up to 500 concurrent users and scale to support additional stations as needed.
8. Tech Stack
Frontend
- React for Web
- React Native for Mobile App
Backend
- Python
- FastAPI
Database
- MySQL (with Alembic for migrations)
AI Models
- GPT 5.4 for user-friendly responses
AI Tools
- Langchain
Local Orchestration
- Docker
- docker-compose
Server-Side Orchestration
- Kubernetes
9. Assumptions and Constraints
- Each station will have a distinct login to ensure data segregation.
- The admin role will have access to all stations' data for comprehensive oversight.
- The system will be deployed in a factory environment with stable internet connectivity.
- The system will be designed to handle up to 500 concurrent users initially, with scalability options for future growth.
10. Glossary
- Station: A specific work area in the factory where production runs are logged.
- Run: A production session logged by an employee, including start and stop times, units produced, and quality results.
- Delay Justification: A mandatory comment explaining why a production run exceeded its expected duration.
- Admin Dashboard: The interface used by administrators to monitor and analyze production data.
- IST: Indian Standard Time, the time zone used for all timestamps in the system.
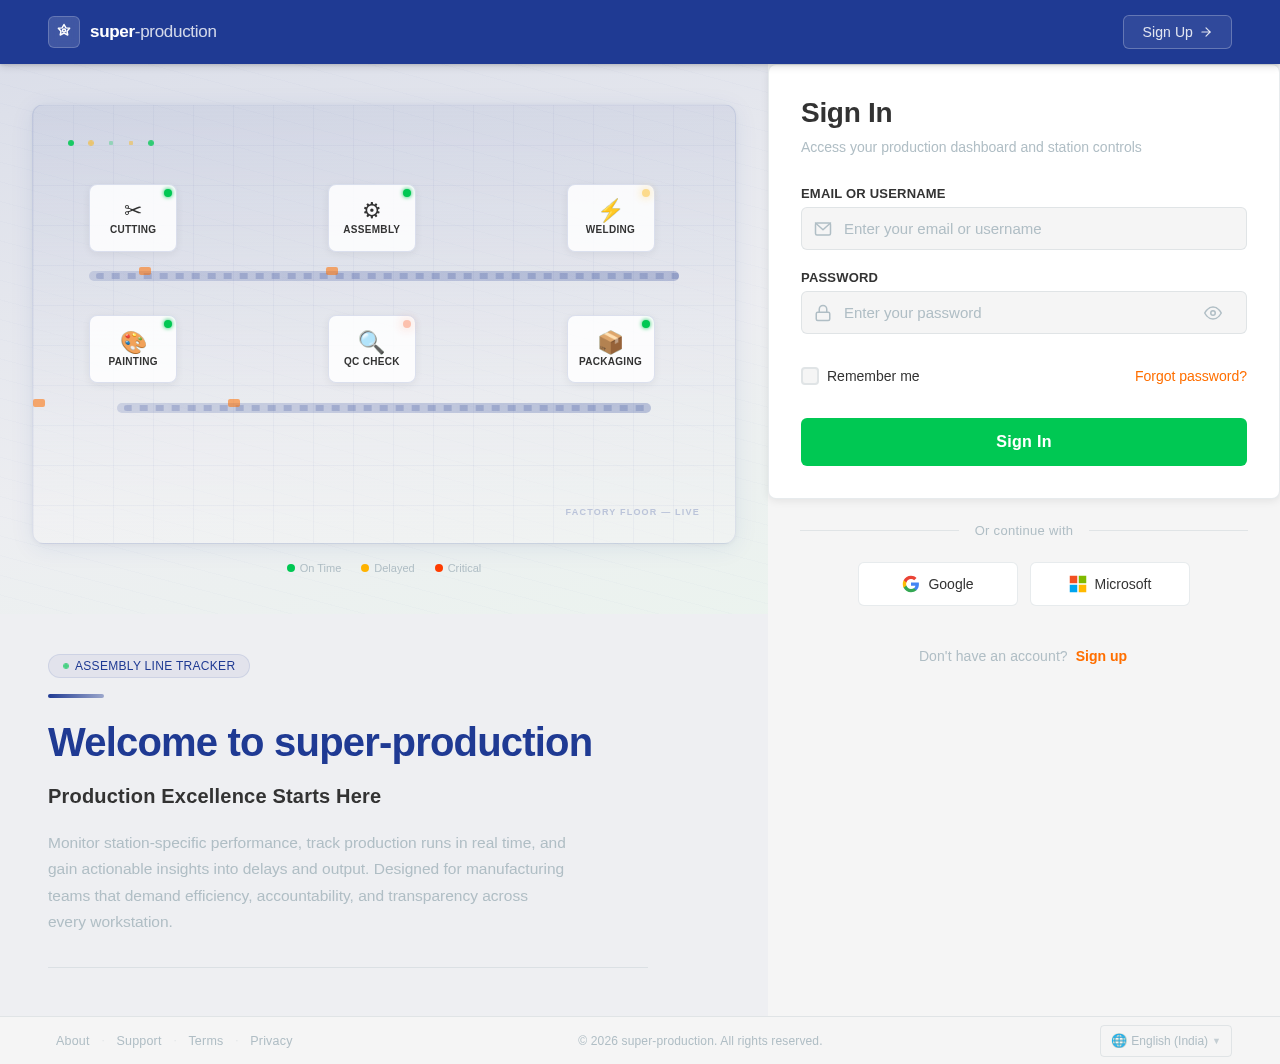
Welcome to super-production
Production Excellence Starts Here
Monitor station-specific performance, track production runs in real time, and gain actionable insights into delays and output. Designed for manufacturing teams that demand efficiency, accountability, and transparency across every workstation.
Sign In
Access your production dashboard and station controls
No comments yet. Be the first!