
simple-premium

byBOOPATHI M

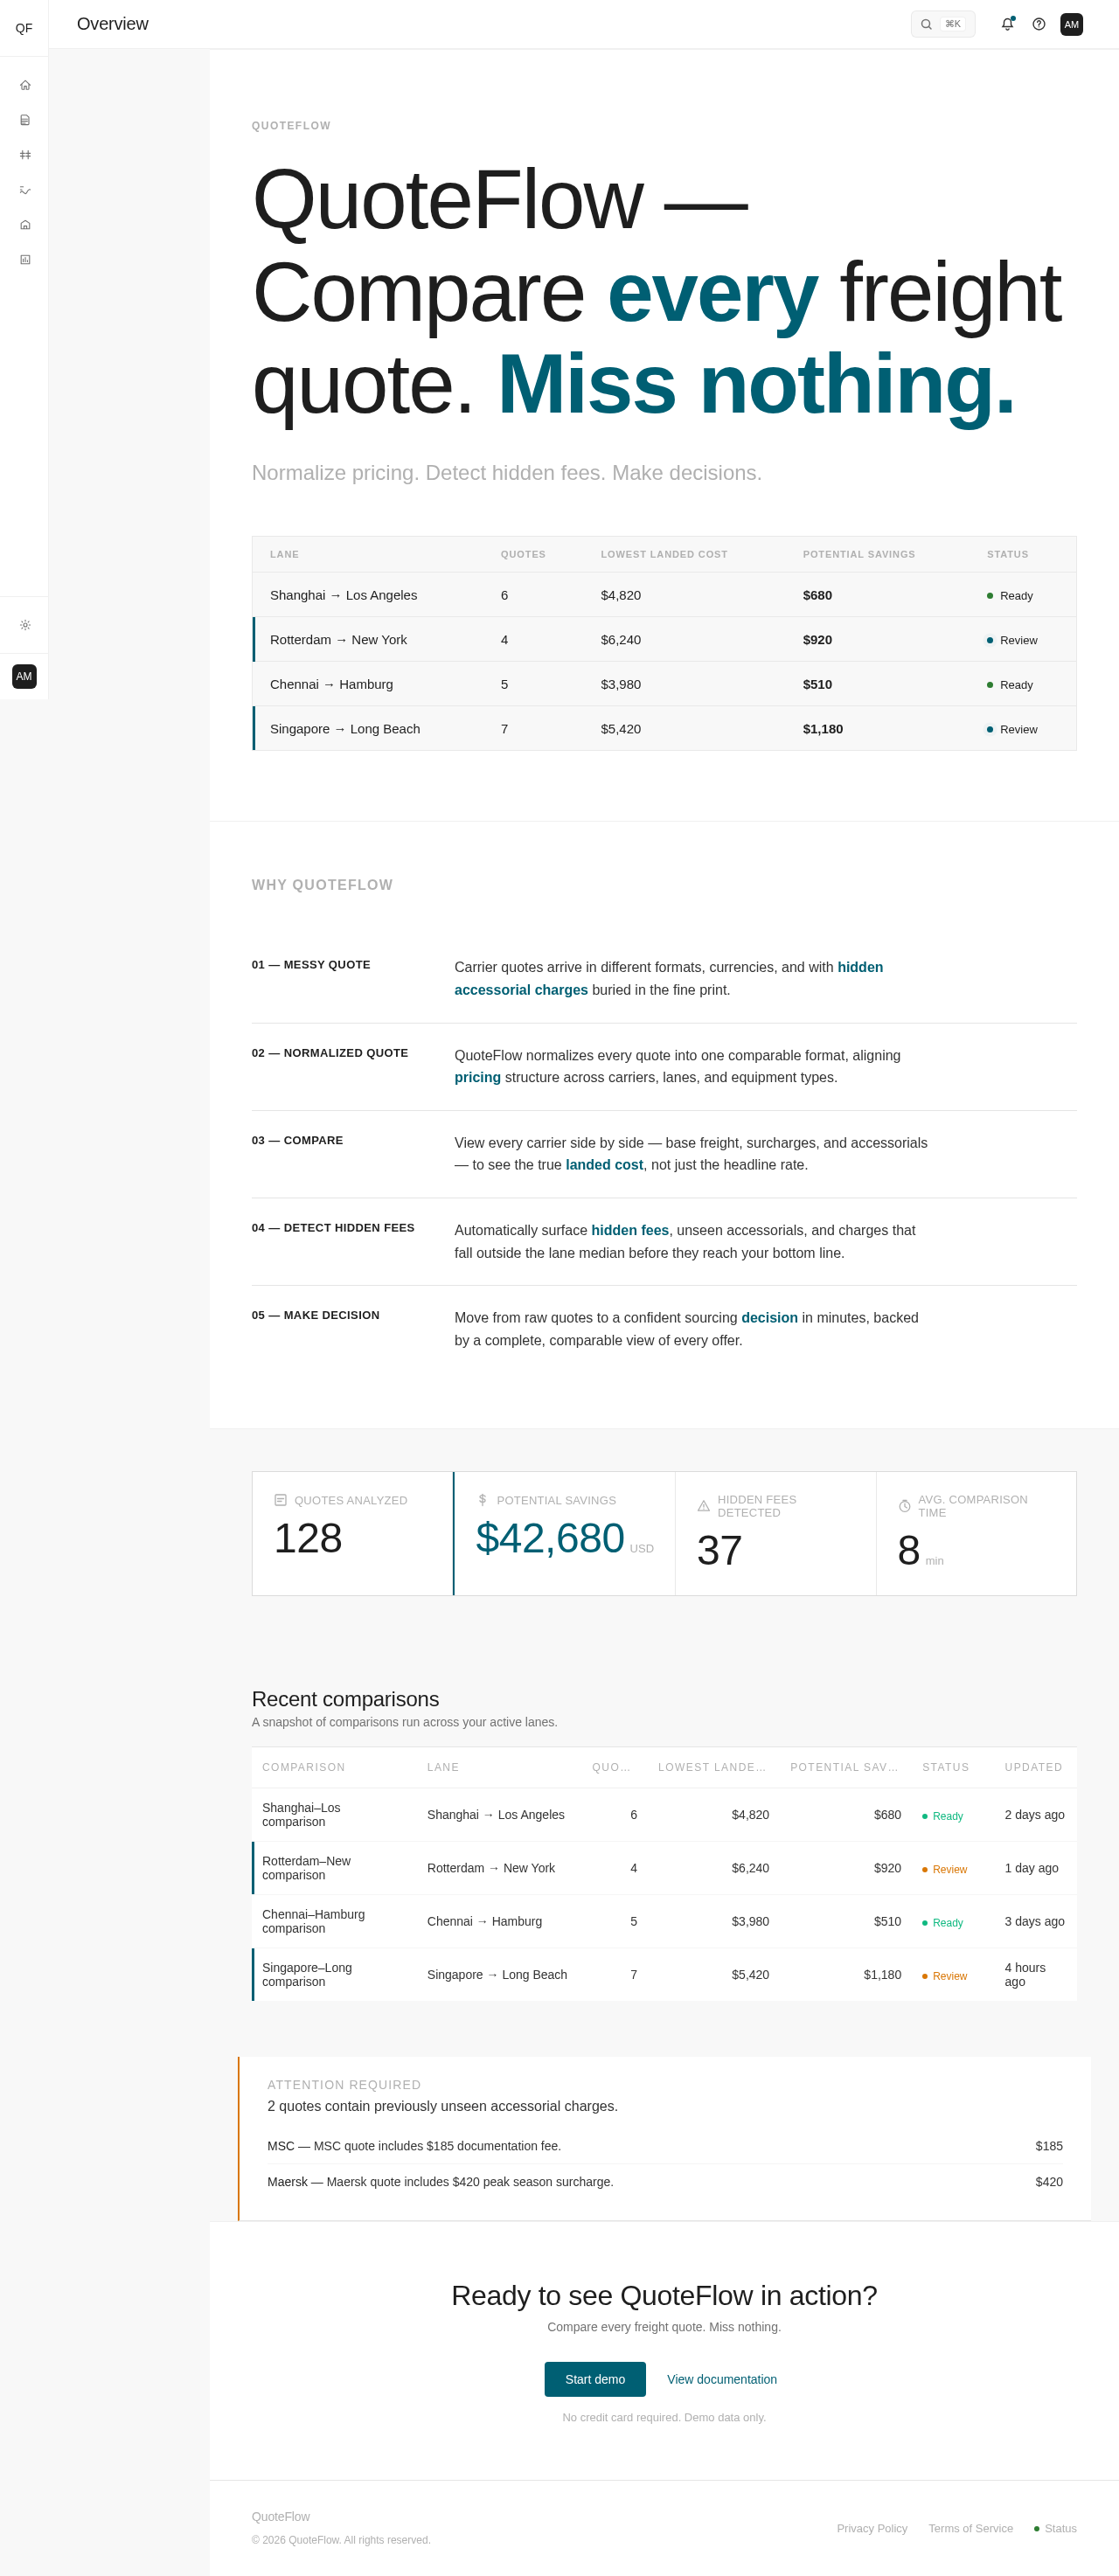
Build a **premium, production-quality SaaS DEMO UI** for a product called **QuoteFlow**. ## IMPORTANT — UI ONLY This is a **visual/product-design demo**, not a functional application. DO NOT build: * backend * database * authentication * real PDF/Excel/email parsing * real file processing * real API integrations * real exports * real AI * real business logic Use realistic static/mock data. Buttons, filters, navigation and interactions may visually work, but functionality is NOT the priority. The goal is to make QuoteFlow look like an expensive enterprise SaaS product that could realistically sell for **$299–$799/month**. --- # PRODUCT **QuoteFlow** **Tagline:** Compare every freight quote. Miss nothing. QuoteFlow helps freight forwarders, procurement teams and 3PLs compare carrier quotes, normalize pricing and identify hidden fees. Core workflow: **Messy quote → Normalized quote → Compare → Detect hidden fees → Make decision** The UI should immediately communicate this value. --- # VISUAL DIRECTION Design quality inspired by: **Linear × Stripe × Ramp × Vercel × Bloomberg Terminal** Do NOT copy their interfaces or branding. The product should feel: * premium * sophisticated * minimal * enterprise-grade * trustworthy * precise * data-dense * calm * operational * extremely polished Avoid the typical AI-generated SaaS appearance. DO NOT use: * excessive gradients * giant hero sections * cartoon illustrations * excessive glassmorphism * excessive shadows * rainbow colors * huge rounded cards * unnecessary icons * decorative elements without purpose * generic dashboard templates Use **typography, spacing, hierarchy and excellent data presentation** to create the premium feeling. --- # DESIGN SYSTEM Create a consistent design system across every screen. ### Typography Use a modern premium sans-serif. Strong hierarchy: * page title * section title * body * metadata Use **tabular numerals** for pricing and financial figures. ### Colors Primary appearance: sophisticated light enterprise UI. Use: * off-white/neutral background * white surfaces * near-black primary text * muted gray secondary text * subtle borders * restrained blue/indigo accent * subtle green for positive * amber for warnings * restrained red for critical issues Do not make the interface colorful. Create a polished dark-mode version using the same design system. --- # APPLICATION SHELL Desktop-first at approximately **1440 × 900**. Create a compact left sidebar. Logo: **QuoteFlow** Navigation: Overview Quotes Comparisons Lanes Suppliers Reports Bottom: Settings User: Alex Morgan Operations Active navigation should be subtle and elegant. Top bar: Page title Search ⌘ K Notifications Help Profile --- # SCREEN 1 — OVERVIEW Header: **Good morning, Alex** "Here's what's happening across your freight quotes." Actions: **+ New comparison** Import quotes ### Metrics Quotes analyzed **128** Potential savings **$42,680** Hidden fees detected **37** Avg. comparison time **8 min** Use compact premium metric presentation rather than giant cards. ### Recent comparisons Create a highly polished table: Comparison | Lane | Quotes | Lowest landed cost | Potential savings | Status | Updated Example: Shanghai → Los Angeles | 6 | $4,820 | $680 | Ready Rotterdam → New York | 4 | $6,240 | $920 | Review Chennai → Hamburg | 5 | $3,980 | $510 | Ready Singapore → Long Beach | 7 | $5,420 | $1,180 | Review ### Attention panel **Attention required** "3 quotes contain previously unseen accessorial charges." Examples: MSC quote includes $185 documentation fee. Maersk quote includes $420 peak season surcharge. --- # SCREEN 2 — QUOTES Header: **Quotes** "All freight quotes in one place." Controls: Search Filter Date Carrier Lane Status Button: **+ Add quote** Create a premium data table. Columns: Quote Carrier Origin Destination Equipment Base rate Surcharges Accessorials Total Validity Status Example carriers: Maersk CMA CGM MSC Hapag-Lloyd ONE Evergreen Use realistic freight pricing. Make table alignment, spacing, typography and hover states exceptionally polished. --- # SCREEN 3 — QUOTE DETAIL Header: **MSC — Shanghai → Los Angeles** Status: **Needs review** Actions: Compare quote More Show: Base freight — $2,650 Fuel surcharge — $310 Peak season surcharge — $230 Documentation — $150 Terminal handling — $240 Other accessorials — $0 Total landed cost: **$3,580** Create a beautiful fee breakdown visualization. ### Detected issues **3 pricing anomalies detected** Documentation fee — $150 "Not present in 4 competing quotes." Peak season surcharge — $230 "22% higher than the lane median." Terminal handling — $240 "Missing validity conditions." Make these warnings highly readable but visually restrained. --- # SCREEN 4 — COMPARISON This is the **hero screen** of QuoteFlow. Make it the most polished screen in the application. Header: **Shanghai → Los Angeles** 40HC · 6 carrier quotes · USD Action: **Export comparison** Create an exceptional side-by-side comparison table. Columns: Maersk MSC CMA CGM Hapag-Lloyd ONE Evergreen Rows: Base freight Fuel surcharge Peak season surcharge Documentation Terminal handling Other fees Total landed cost Validity Transit time Highlight intelligently: **Lowest total** **Highest total** **Missing fee** **Unusually high fee** **Best value** Do not overuse colors. Below the table: ### Best quote isn't always the cheapest quote. Example insight: "MSC has the lowest base freight, but additional charges make CMA CGM $150 cheaper on total landed cost." Make this insight visually compelling. --- # SCREEN 5 — HIDDEN FEES Header: **Hidden fee detection** "Find charges that disappear inside the fine print." Metrics: **37** Fees detected **$18,420** Potential overcharges **14** New fee types Create table: Fee Carrier Lane Amount Compared with Severity Reason Examples: Documentation fee | MSC | Shanghai → LA | $150 | 4 competitors | High Peak season surcharge | Maersk | Shanghai → LA | $420 | Lane median | Medium Handling fee | CMA CGM | Rotterdam → NY | $185 | 3 competitors | High --- # SCREEN 6 — LANES Header: **Lanes** Show lane intelligence: Shanghai → Los Angeles Rotterdam → New York Chennai → Hamburg Singapore → Long Beach Metrics: Quote count Average landed cost Lowest cost Highest cost Median Potential savings Include a subtle cost trend visualization. --- # SCREEN 7 — SUPPLIERS Header: **Suppliers** Table: Supplier Quotes Avg. landed cost Avg. variance Hidden fees Reliability Suppliers: Maersk CMA CGM MSC Hapag-Lloyd ONE Evergreen Create an elegant supplier detail view. --- # SCREEN 8 — REPORTS Header: **Reports** Create premium report previews: Monthly freight savings Supplier comparison Lane cost analysis Accessorial fee report Quote variance report Make these feel like enterprise intelligence reports. --- # MICRO-INTERACTIONS Even though this is only a demo, visually include: * subtle hover states * focus states * button press states * table row hover * dropdown transitions * modal transitions * tab transitions * sidebar transitions * skeleton loading * toast notifications * success states * warning states * empty states * error states Animations should be subtle and fast. --- # COMMAND PALETTE Create a polished ⌘K command palette. Commands: Search quotes Create comparison Search lane Search supplier Open reports Settings Visual demo only. --- # EMPTY STATES Create elegant empty states for: No quotes No comparisons No hidden fees No reports Each should explain the situation and show the next logical action. --- # DATA VISUALIZATION Use charts sparingly. Include: * landed cost trend * supplier price distribution * savings opportunity * fee composition Charts should look like enterprise analytics, not colorful BI dashboards. --- # PREMIUM UX RULES 1. Prioritize information hierarchy over decoration. 2. Use whitespace intelligently. 3. Keep tables dense but highly readable. 4. Align all financial numbers precisely. 5. Use consistent spacing throughout. 6. Use subtle borders instead of excessive shadows. 7. Avoid unnecessary cards. 8. Avoid excessive rounded corners. 9. Avoid visual noise. 10. Every screen must feel like part of the same product. 11. Make the comparison screen exceptional. 12. Make warnings immediately understandable. 13. Make the product feel fast even though data is static. 14. Design for executive-level credibility. 15. Nothing should look like a generic AI-generated dashboard. --- # FINAL DESIGN REVIEW Before finishing, inspect every screen as a **world-class SaaS product designer**. Remove anything that looks: * generic * amateur * template-like * AI-generated * overly colorful * unnecessarily complicated * inconsistent Improve: * typography * spacing * alignment * table density * hierarchy * interaction states * consistency * visual polish The final UI should look credible enough to demo to a **freight-forwarding company executive** and communicate why QuoteFlow could be worth hundreds of dollars per month. **The UI is the product. Prioritize visual quality and UX polish over functionality.**

Landing
Landing

Comments (0)

No comments yet. Be the first!

Preview dataChanges stay in this preview.
Landing design preview
Landing: View product intro
Overview: Monitor quote activity
Lanes: Evaluate lane cost metrics
Suppliers: Assess supplier reliability
Comparison: Review carrier comparison
Hidden fee detection: Review fee exposure
Reports: Preview savings report
Reports: Preview supplier comparison report
Settings: Adjust display settings
Preview dataChanges stay in this preview.
Landing design preview
Landing: View product intro
Overview: Monitor quote activity
Lanes: Evaluate lane cost metrics
Suppliers: Assess supplier reliability
Comparison: Review carrier comparison
Hidden fee detection: Review fee exposure
Reports: Preview savings report
Reports: Preview supplier comparison report
Settings: Adjust display settings