simple-fully
 hrmn
hrmnBuild a fully working web app (not a mockup) for Smart India Hackathon 2026, PS 26189 — "AI-Powered Criminal Network Analysis System" by TEAM UPLIFT. PURPOSE Fuse fragmented police data (FIRs, call records, financial transactions, surveillance logs, social media, criminal databases) into one knowledge graph, extract entities and relationships, surface key persons and suspicious patterns, and present it all in a visual investigator console. STACK React + TypeScript + Vite + Tailwind, Cytoscape.js (graph), Recharts (charts), Leaflet + OpenStreetMap (maps). FastAPI backend with NetworkX, PyTorch Geometric, scikit-learn and spaCy. Neo4j + PostgreSQL with an in-memory fallback so it boots with zero setup. Docker compose, no API keys. DESIGN Dark intelligence console. Background #0E1A2B, panels #132840, borders #22496F, text #E6EDF5, accent orange #E8833A, green #3FBF7F, amber #E0A93B, blue #4C9BE8. Condensed uppercase headers, dense 12px text, thin borders, compact tables. Top bar: shield emblem, title "INTELLIGENCE ANALYTICS & CASE MANAGEMENT SYSTEM", notification bell, avatar. Sidebar: Dashboard, Cases, Subjects (X/Y), Evidence Locker, Link Analysis, Timeline, Geospatial Map, Reports, Settings. Responsive. FEATURES — every one must actually function 1. INGEST — Upload CSV/JSON/PDF/TXT/images. Live pipeline: Ingest → OCR/NLP → Entity Extract → Relation Extract → Entity Resolution → Graph. Review table where the officer can Accept, Edit or Reject each extraction. Fuzzy duplicate merging ("Ravi Kumar" = "R. Kumar"). 2. GRAPH — Interactive canvas with Person, Phone, Location, Vehicle, Org, Account and Event nodes. Pan, zoom, click-to-expand neighbours, right-click menu, four switchable layouts, shortest-path finder, filters by type/date/confidence, export PNG and JSON. 3. KEY PERSONS — Degree, betweenness, closeness, eigenvector and PageRank in a sortable table. Node size scales by the selected metric; a "Key Person" badge applies above a threshold. 4. PATTERNS — Louvain community detection with coloured clusters, plus anomaly rules (call bursts, money structuring, circular transfers, unusual co-location, bridge nodes) that raise real alerts with explanations. 5. PREDICT — GNN link prediction with an Adamic-Adar fallback so the demo never fails. Predicted links render as dashed edges with probability labels, queued for an officer to Confirm (becomes a real edge) or Dismiss. 6. COMPARE (hero screen) — Subject X vs Subject Y. Two profile cards (name, DOB, aliases, last known address, reported suspicion, behavioural indicators, key evidence) beside a Comparison View with working tabs: Similarities & Differences, Timelines, Relationships, Evidence Strength, Confidence Levels. Live charts: Evidence bar chart, Shared Locations area chart, Evidence Strength bars, Confidence Level horizontal bars, and a mini link graph. Include a computed table — Verified connections 3 vs 5 (CONFIRMED FACT), AI-predicted links 1 vs 2 (AI INFERENCE), Network centrality 0.42 vs 0.71 (AI INDICATOR) — plus common contacts, shared locations, a similarity score and an auto-written summary. Export to PDF. 7. EVOLVE — Event timeline with a date-range slider and Play button that animates the graph rebuilding over time; metrics recompute per window. 8. LOCATE — Map with clustered markers for incidents, sightings, towers and jails. Heatmap toggle, draw-a-radius "who was here between these dates" query, time-synced to the timeline. Clicking a jail opens a facility panel with location, current population and a searchable inmate table (Name, Detail, Date In, Jail ID) linking back to that person's graph node. 9. COLLABORATE — JWT login with five roles (Admin, Senior Investigator, Investigator, Analyst, Auditor) with genuinely different permissions. Comments and @mentions on entities, notifications, live multi-user updates over WebSockets, and a tamper-evident audit log (SHA-256 hash chain with a Verify Integrity button). 10. EXPLAIN — Every AI output has a "Why this?" panel showing contributing evidence, feature weights and a confidence percentage. 11. REPORTS — Generate a downloadable PDF case dossier: graph snapshot, key persons, detected patterns, X-vs-Y comparison, timeline, map and predicted links. EVIDENCE LABELS Tag every piece of evidence everywhere with one of four chips: CONFIRMED FACT (green), ALLEGATION/REPORT (amber), AI INFERENCE (blue), UNVERIFIED (grey). Separating verified fact from AI guess is the core value of this product. SEED DATA Generate a synthetic trafficking and hawala network: 120 persons, 150 phones, 60 Indian locations, 40 vehicles, 25 organisations, 8 jails with inmate rosters, 5,000 call records, 1,500 transactions and 60 FIR documents across 24 months. Deliberately plant three communities, two broker nodes, one money-structuring pattern, one call-burst anomaly and four discoverable missing links. Pre-wire Subject X and Subject Y as a strong comparison pair. Footer on every page: "Illustrative synthetic data — not real persons or cases." RULES No dead buttons, no placeholder images, no "coming soon" — every control must change real state from real data. Include a README with three-command setup, a seed script, and a Demo Mode that replays a three-minute judging walkthrough. Tagline: "PS asks: connect the dots. TEAM UPLIFT adds: Compare · Predict · Evolve · Locate · Collaborate · Explain."

Comments (0)
Sign in to leave a comment
System Requirements
System Requirements Document for simple-fully
1. Introduction
The "AI-Powered Criminal Network Analysis System" is a web application developed for the Smart India Hackathon 2026 by TEAM UPLIFT. Its primary purpose is to integrate fragmented police data into a comprehensive knowledge graph, enabling the extraction of entities and relationships, identification of key persons, and detection of suspicious patterns. The system presents this information through a visual investigator console, facilitating law enforcement and intelligence analysis.
2. System Overview
The system is a fully functional web application that fuses various data sources into a single knowledge graph. It supports entity extraction, relationship mapping, and pattern detection, providing a visual interface for investigators. The application is built using a specified technology stack and adheres to a luxury instrument aesthetic inspired by MARQ by Garmin. It includes features such as data ingestion, graph visualization, key person identification, pattern detection, predictive analysis, and collaborative tools.
2a. Product Interpretation and Delivery Boundary
The application is delivered as a web-based platform with a dark intelligence console design. It supports real-time data processing and visualization, with a focus on precision and control. The system is intended for use by law enforcement agencies and intelligence analysts, providing them with a reliable tool for criminal network analysis. The application includes a comprehensive setup guide and demo mode for ease of use.
2b. Source Content Inventory
Not applicable as no explicit content_source directive is provided.
2c. Page Content and Component Coverage
Dashboard
- Information/State: Overview of system status, recent alerts, and key metrics.
- Primary Actions: Navigate to other sections, view notifications.
- Components: Top bar with shield emblem, title, notification bell, avatar; Sidebar with navigation links.
Cases
- Information/State: List of cases with details and status.
- Primary Actions: View case details, update status, assign roles.
- Components: Case table, filters, action buttons.
Subjects (X/Y)
- Information/State: Profile information for Subject X and Subject Y.
- Primary Actions: Compare subjects, view detailed profiles.
- Components: Profile cards, comparison view.
Evidence Locker
- Information/State: Repository of evidence items with labels.
- Primary Actions: Tag evidence, view details, export items.
- Components: Evidence table, tagging options, export button.
Link Analysis
- Information/State: Interactive graph of entities and relationships.
- Primary Actions: Expand nodes, apply filters, export graph.
- Components: Graph canvas, control panel, export options.
Timeline
- Information/State: Event timeline with date-range slider.
- Primary Actions: Play animation, adjust date range.
- Components: Timeline slider, play button, event markers.
Geospatial Map
- Information/State: Map with incident markers and heatmap.
- Primary Actions: Toggle heatmap, draw radius query.
- Components: Map canvas, control panel, query tools.
Reports
- Information/State: Generate and download case dossiers.
- Primary Actions: Create report, export to PDF.
- Components: Report generation form, export button.
Settings
- Information/State: User preferences and system settings.
- Primary Actions: Update settings, manage roles.
- Components: Settings form, role management tools.
3. Functional Requirements
-
As an officer, I should be able to upload various data formats (CSV/JSON/PDF/TXT/images) for ingestion into the system.
- Provenance: Explicit
- Lifecycle Facts: Ingest → OCR/NLP → Entity Extract → Relation Extract → Entity Resolution → Graph
- Observable Acceptance: Data appears in the review table for further action.
-
As an investigator, I should be able to interact with an interactive graph to explore relationships between entities.
- Provenance: Explicit
- Lifecycle Facts: Pan, zoom, click-to-expand, apply filters, export graph
- Observable Acceptance: Graph updates and exports correctly.
-
As an analyst, I should be able to identify key persons using various centrality metrics.
- Provenance: Explicit
- Lifecycle Facts: Metrics calculation, sortable table, badge application
- Observable Acceptance: Key persons are highlighted based on metrics.
-
As an officer, I should be able to detect patterns and receive alerts for anomalies.
- Provenance: Explicit
- Lifecycle Facts: Community detection, anomaly rules, alert generation
- Observable Acceptance: Alerts are generated with explanations.
-
As an investigator, I should be able to predict links using GNN and confirm or dismiss predictions.
- Provenance: Explicit
- Lifecycle Facts: Link prediction, confirmation/dismissal
- Observable Acceptance: Predicted links are processed correctly.
-
As an officer, I should be able to compare two subjects and export the comparison to PDF.
- Provenance: Explicit
- Lifecycle Facts: Profile comparison, live charts, export functionality
- Observable Acceptance: Comparison view is accurate and exportable.
-
As an analyst, I should be able to view an event timeline and animate graph changes over time.
- Provenance: Explicit
- Lifecycle Facts: Timeline interaction, graph animation
- Observable Acceptance: Timeline and animations function as expected.
-
As an officer, I should be able to locate incidents on a map and perform time-synced queries.
- Provenance: Explicit
- Lifecycle Facts: Map interaction, query execution
- Observable Acceptance: Map updates and queries return correct results.
-
As a user, I should be able to collaborate with others using role-based permissions and live updates.
- Provenance: Explicit
- Lifecycle Facts: JWT login, role management, WebSocket updates
- Observable Acceptance: Collaboration features work with correct permissions.
-
As an investigator, I should be able to understand AI outputs through an explanation panel.
- Provenance: Explicit
- Lifecycle Facts: Explanation panel access, feature weight display
- Observable Acceptance: Explanations are clear and informative.
-
As a user, I should be able to generate and download comprehensive reports.
- Provenance: Explicit
- Lifecycle Facts: Report generation, PDF export
- Observable Acceptance: Reports are generated and downloadable.
4. User Personas
- Admin: Manages system settings and user roles.
- Senior Investigator: Oversees investigations and validates key findings.
- Investigator: Conducts detailed analysis and confirms predictions.
- Analyst: Processes data and identifies patterns.
- Auditor: Reviews system logs and verifies data integrity.
5. Core User Flows
-
Data Ingestion and Review
- Initiator: Officer
- Steps: Upload data → System processes data → Officer reviews extractions → Accept/Edit/Reject
- Outcome: Data is integrated into the knowledge graph.
-
Graph Exploration
- Initiator: Investigator
- Steps: Access graph → Interact with nodes → Apply filters → Export graph
- Outcome: Investigator gains insights into entity relationships.
-
Key Person Identification
- Initiator: Analyst
- Steps: Access key persons table → Sort by metrics → Identify key persons
- Outcome: Key persons are highlighted for further investigation.
-
Pattern Detection and Alerts
- Initiator: Officer
- Steps: System detects patterns → Officer reviews alerts → Take action
- Outcome: Anomalies are addressed based on alerts.
-
Link Prediction and Confirmation
- Initiator: Investigator
- Steps: System predicts links → Investigator reviews predictions → Confirm/Dismiss
- Outcome: Predictions are validated and integrated.
-
Subject Comparison
- Initiator: Officer
- Steps: Select subjects → View comparison → Export to PDF
- Outcome: Comprehensive comparison report is generated.
-
Timeline Animation
- Initiator: Analyst
- Steps: Access timeline → Adjust date range → Play animation
- Outcome: Graph changes are visualized over time.
-
Geospatial Analysis
- Initiator: Officer
- Steps: Access map → Perform queries → View results
- Outcome: Spatial insights are gained from map analysis.
-
Collaboration and Role Management
- Initiator: Admin
- Steps: Manage roles → Facilitate collaboration → Monitor updates
- Outcome: Effective collaboration with role-based permissions.
-
AI Output Explanation
- Initiator: Investigator
- Steps: Access explanation panel → Review details
- Outcome: Investigator understands AI decisions.
-
Report Generation
- Initiator: User
- Steps: Generate report → Download PDF
- Outcome: Detailed report is available for distribution.
6. Visuals Colors and Theme
- Muse: MARQ by Garmin
- Palette:
- Background: #0E1A2B
- Surface: #132840
- Text: #E6EDF5
- Primary: #4C9BE8
- Accent: #E8833A
- Muted: #22496F
- Typography:
- Headings: Barlow Condensed, uppercase, medium weight
- Body: Saira
- Scale: 1.25 modular (48/32/24/16/12)
- Shape Language: Circular gauges, precise data rows, edge-to-edge photography
- Layout: Dashboard-like with ruled panels, dark UI
- Motion: Needle sweeps for data updates, restrained tempo
7. Signature Design Concept
The public entry features a split-screen hero with Subject X vs Subject Y profiles beside a dynamic comparison view. The design emphasizes precision and control, with circular gauges for key metrics and edge-to-edge photography for profile highlights. The dark background is accented with orange and blue, aligning with the luxury instrument aesthetic.
8. Interaction Model & Motion Direction
- Interaction Model: Static (direction)
- Motion Tempo: Restrained
- Hero Dimensionality: Layered_2d
- Landing Hero Motion Brief:
- Focal Subject: Subject X vs Subject Y profiles
- Thesis: Input (select subjects) → Transformation (dynamic comparison) → Outcome (visual insights)
- Motion Vocabulary: Needle sweeps, slow transitions
- First Frame: Split-screen with highlighted profiles
- Reduced-Motion State: Static comparison view
9. Non-Functional Requirements
- Performance: The system must handle large datasets efficiently, with real-time updates and low latency.
- Security: Implement JWT authentication and role-based access control to ensure data protection.
- Scalability: The application should support scaling to accommodate increased data and user load.
- Reliability: Ensure high availability and fault tolerance with in-memory fallback and Docker orchestration.
10. Tech Stack
- Frontend: React, TypeScript, Vite, Tailwind, Cytoscape.js, Recharts, Leaflet, OpenStreetMap
- Backend: FastAPI, NetworkX, PyTorch Geometric, scikit-learn, spaCy
- Database: Neo4j, PostgreSQL
- Deployment: Docker Compose
11. Assumptions and Constraints
- Assumptions: Users have basic technical proficiency and access to necessary hardware.
- Constraints: The application must adhere to the specified technology stack and design guidelines.
12. Glossary
- GNN: Graph Neural Network
- JWT: JSON Web Token
- OCR: Optical Character Recognition
- NLP: Natural Language Processing
- AI: Artificial Intelligence
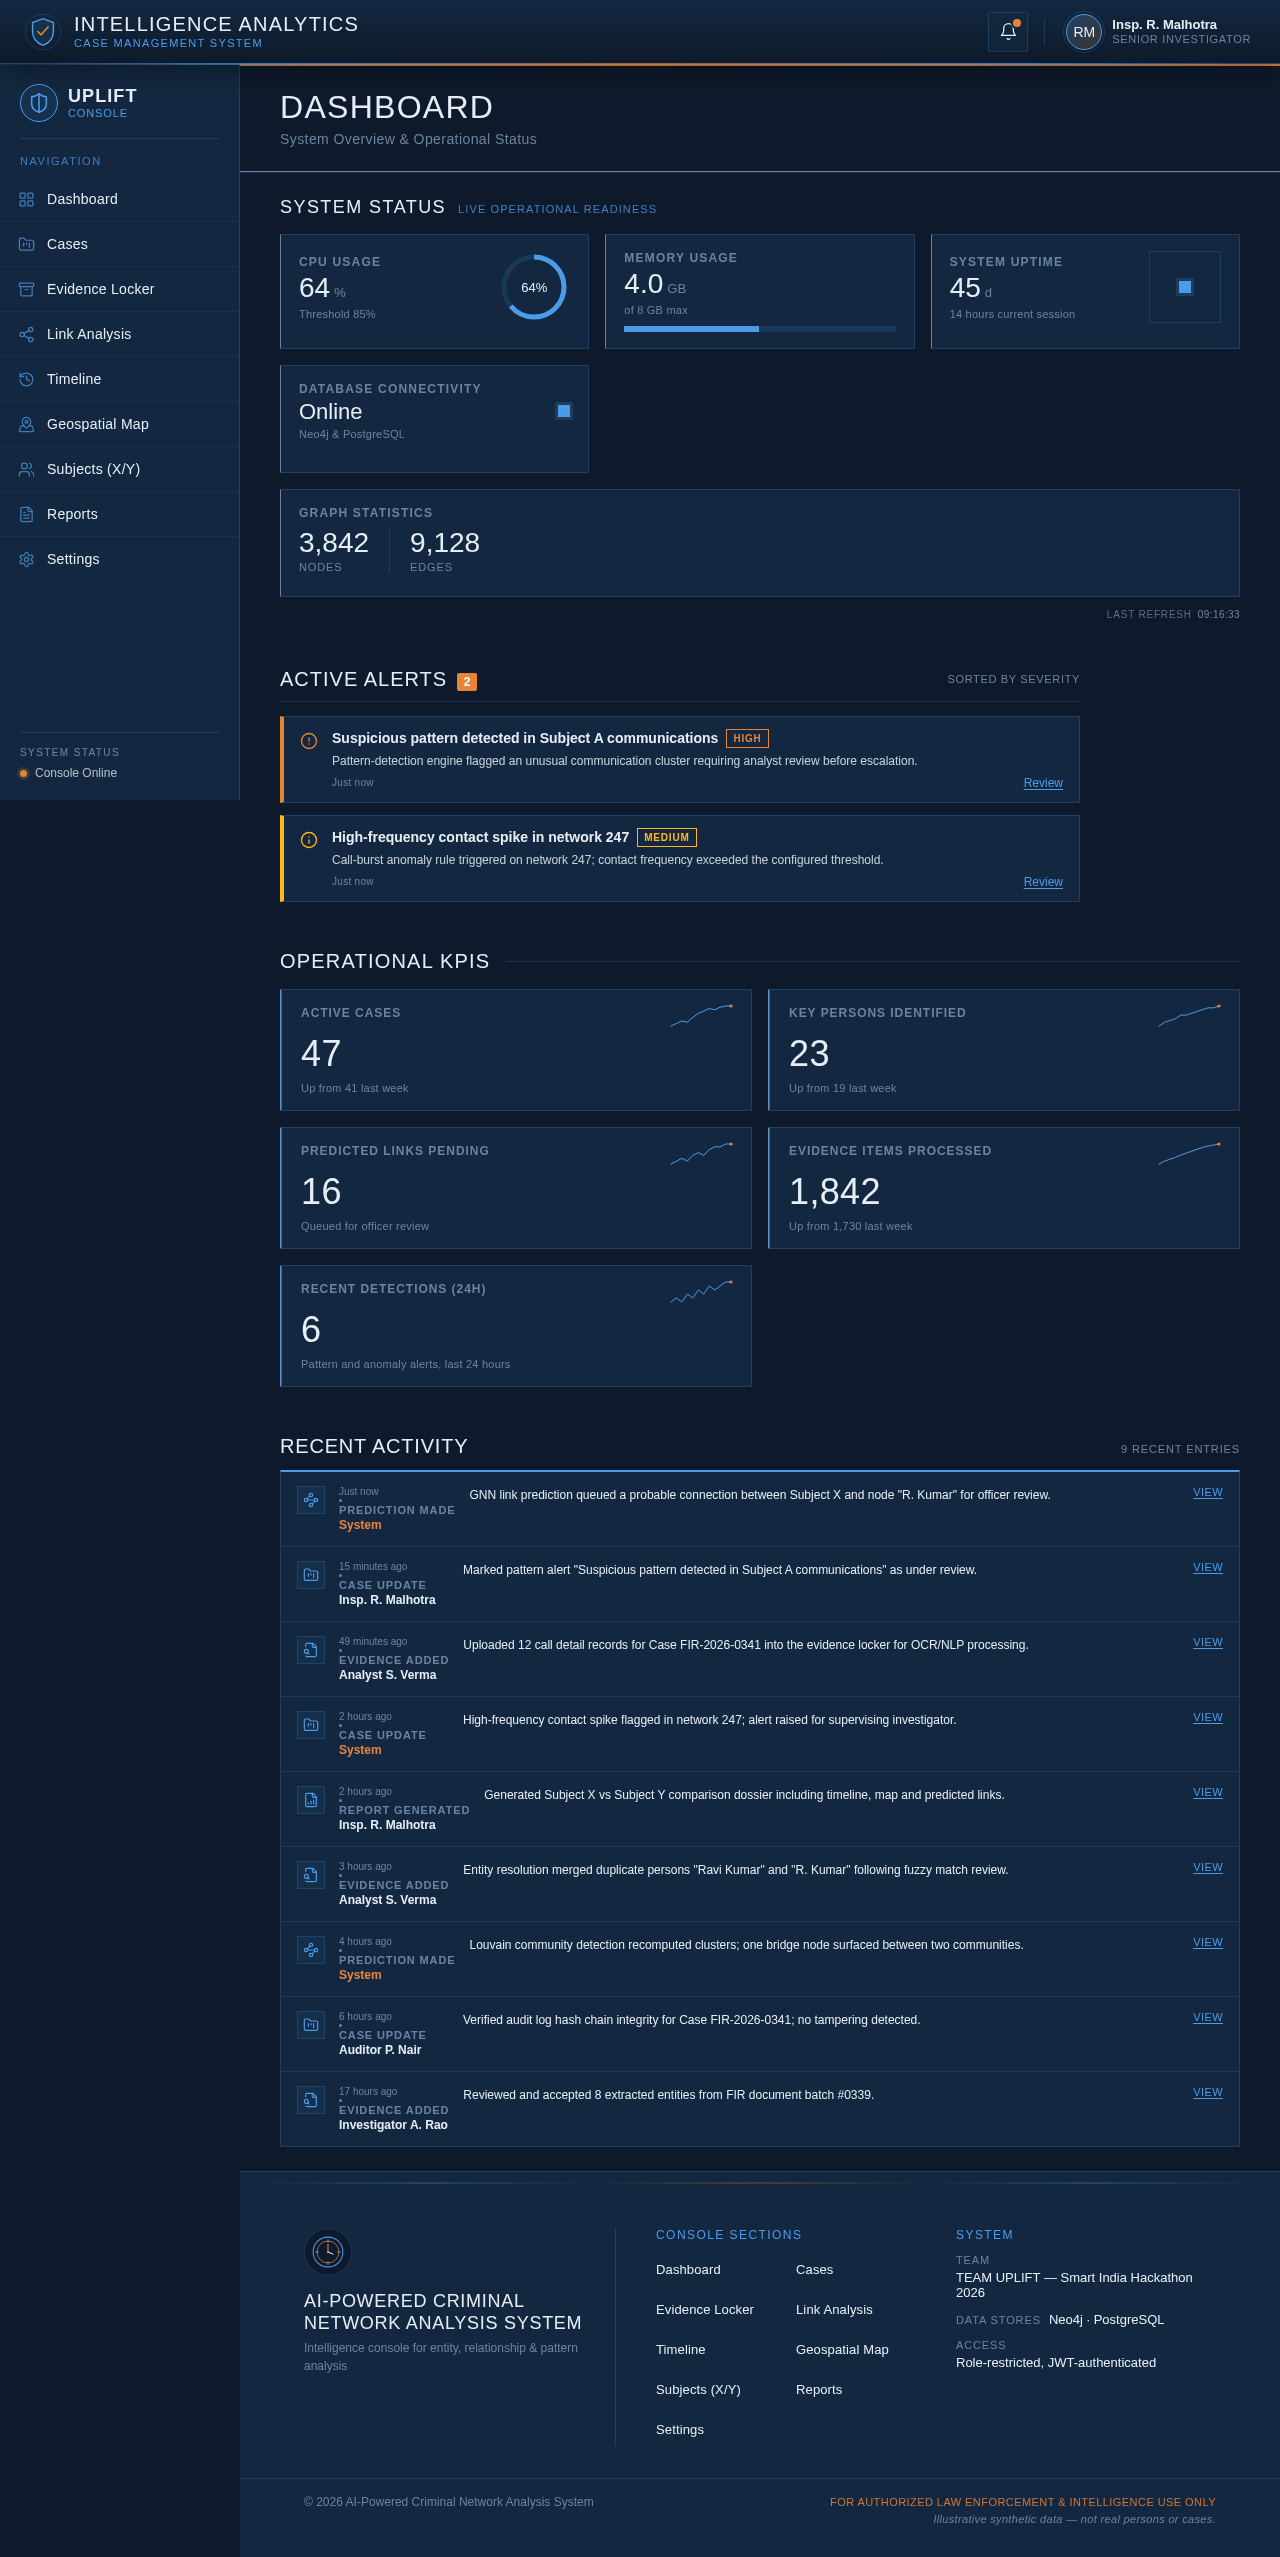
Dashboard
System Overview & Operational Status
System Status
Live Operational ReadinessActive Alerts
2Suspicious pattern detected in Subject A communications
HighPattern-detection engine flagged an unusual communication cluster requiring analyst review before escalation.
High-frequency contact spike in network 247
MediumCall-burst anomaly rule triggered on network 247; contact frequency exceeded the configured threshold.
Operational KPIs
Recent Activity
9 recent entries- Prediction MadeSystem
GNN link prediction queued a probable connection between Subject X and node "R. Kumar" for officer review.
- Case UpdateInsp. R. Malhotra
Marked pattern alert "Suspicious pattern detected in Subject A communications" as under review.
- Evidence AddedAnalyst S. Verma
Uploaded 12 call detail records for Case FIR-2026-0341 into the evidence locker for OCR/NLP processing.
- Case UpdateSystem
High-frequency contact spike flagged in network 247; alert raised for supervising investigator.
- Report GeneratedInsp. R. Malhotra
Generated Subject X vs Subject Y comparison dossier including timeline, map and predicted links.
- Evidence AddedAnalyst S. Verma
Entity resolution merged duplicate persons "Ravi Kumar" and "R. Kumar" following fuzzy match review.
- Prediction MadeSystem
Louvain community detection recomputed clusters; one bridge node surfaced between two communities.
- Case UpdateAuditor P. Nair
Verified audit log hash chain integrity for Case FIR-2026-0341; no tampering detected.
- Evidence AddedInvestigator A. Rao
Reviewed and accepted 8 extracted entities from FIR document batch #0339.
Dashboard
System Overview & Operational Status
System Status
Live Operational ReadinessActive Alerts
2Suspicious pattern detected in Subject A communications
HighPattern-detection engine flagged an unusual communication cluster requiring analyst review before escalation.
High-frequency contact spike in network 247
MediumCall-burst anomaly rule triggered on network 247; contact frequency exceeded the configured threshold.
Operational KPIs
Recent Activity
9 recent entries- Prediction MadeSystem
GNN link prediction queued a probable connection between Subject X and node "R. Kumar" for officer review.
- Case UpdateInsp. R. Malhotra
Marked pattern alert "Suspicious pattern detected in Subject A communications" as under review.
- Evidence AddedAnalyst S. Verma
Uploaded 12 call detail records for Case FIR-2026-0341 into the evidence locker for OCR/NLP processing.
- Case UpdateSystem
High-frequency contact spike flagged in network 247; alert raised for supervising investigator.
- Report GeneratedInsp. R. Malhotra
Generated Subject X vs Subject Y comparison dossier including timeline, map and predicted links.
- Evidence AddedAnalyst S. Verma
Entity resolution merged duplicate persons "Ravi Kumar" and "R. Kumar" following fuzzy match review.
- Prediction MadeSystem
Louvain community detection recomputed clusters; one bridge node surfaced between two communities.
- Case UpdateAuditor P. Nair
Verified audit log hash chain integrity for Case FIR-2026-0341; no tampering detected.
- Evidence AddedInvestigator A. Rao
Reviewed and accepted 8 extracted entities from FIR document batch #0339.
No comments yet. Be the first!