



Originating Question
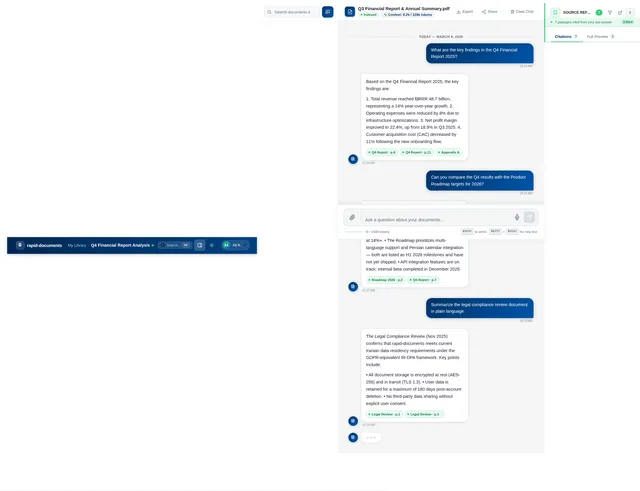
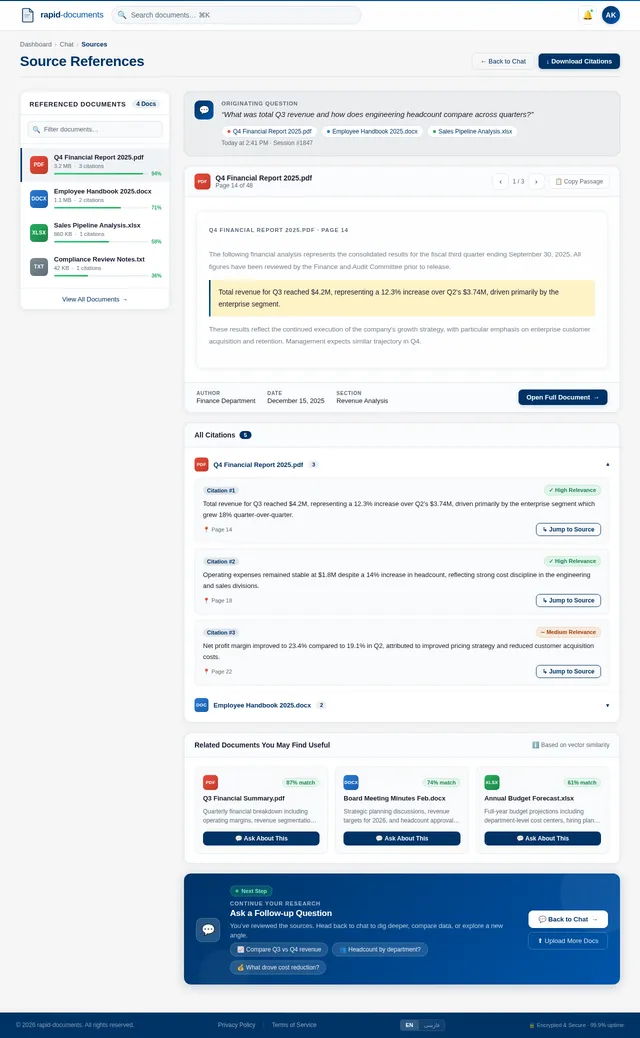
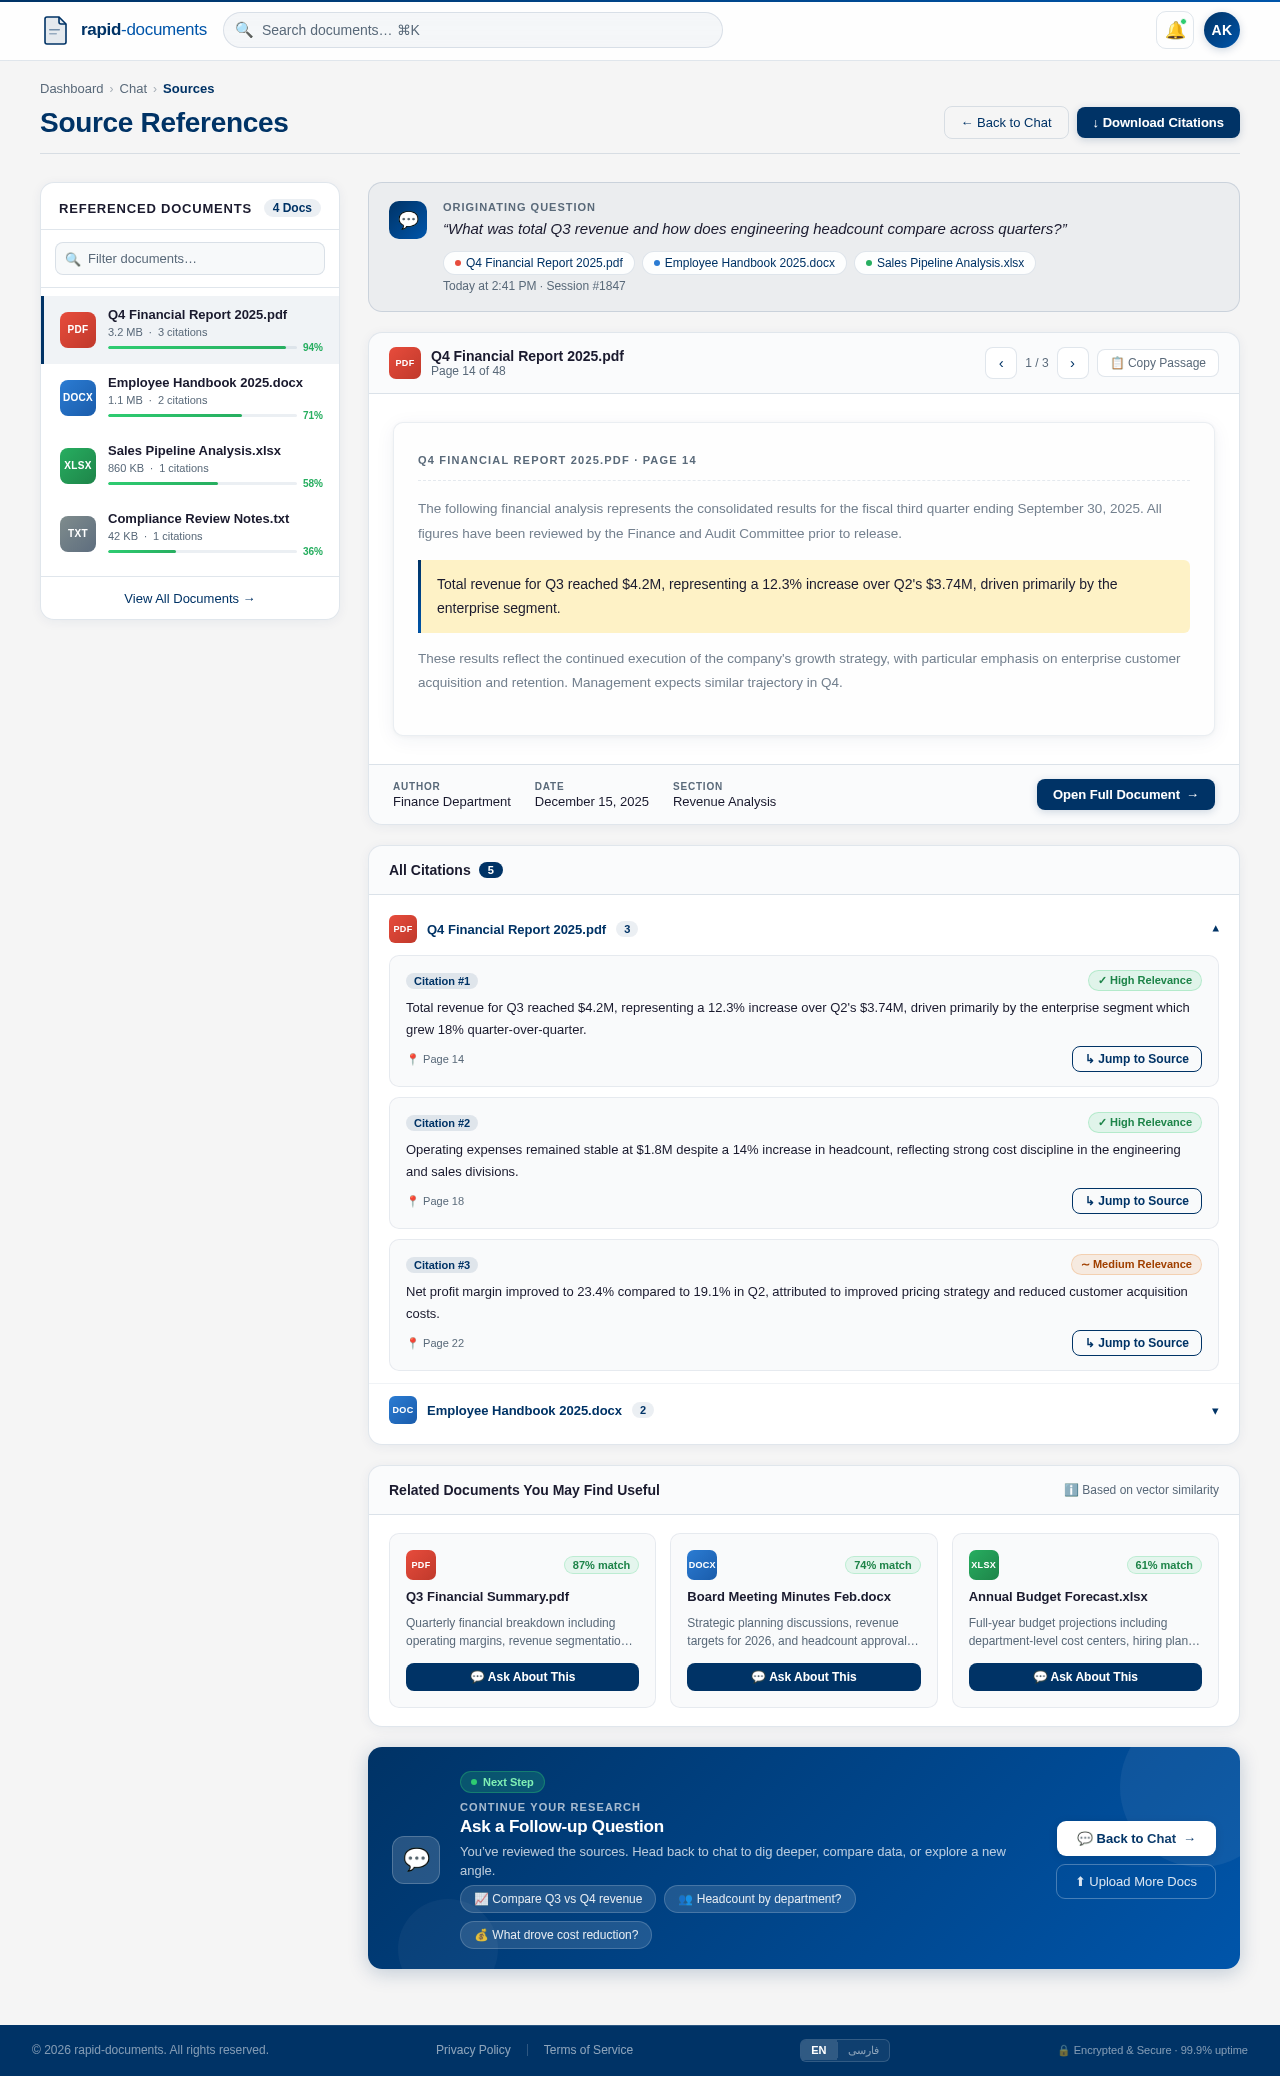
“What was total Q3 revenue and how does engineering headcount compare across quarters?”
Q4 Financial Report 2025.pdf
Page 14 of 48
The following financial analysis represents the consolidated results for the fiscal third quarter ending September 30, 2025. All figures have been reviewed by the Finance and Audit Committee prior to release.
These results reflect the continued execution of the company's growth strategy, with particular emphasis on enterprise customer acquisition and retention. Management expects similar trajectory in Q4.
All Citations5
Total revenue for Q3 reached $4.2M, representing a 12.3% increase over Q2's $3.74M, driven primarily by the enterprise segment which grew 18% quarter-over-quarter.
Operating expenses remained stable at $1.8M despite a 14% increase in headcount, reflecting strong cost discipline in the engineering and sales divisions.
Net profit margin improved to 23.4% compared to 19.1% in Q2, attributed to improved pricing strategy and reduced customer acquisition costs.
Continue Your Research
Ask a Follow-up Question
You’ve reviewed the sources. Head back to chat to dig deeper, compare data, or explore a new angle.
No comments yet. Be the first!