purple-a
 Smaa Smaa
بدي الرسم البياني للسؤال التاني a+b


Comments (0)
Sign in to leave a comment
System Requirements
System Requirements Document (SRD) for Project Purple-a
1. Introduction
Welcome to the System Requirements Document (SRD) for Project Purple-a. This document outlines the functional and non-functional requirements, design concepts, and technical specifications for the project. The goal is to deliver a robust system tailored to the needs of Smaa Smaa in PS, ensuring clarity, precision, and alignment with the user's vision.
2. System Overview
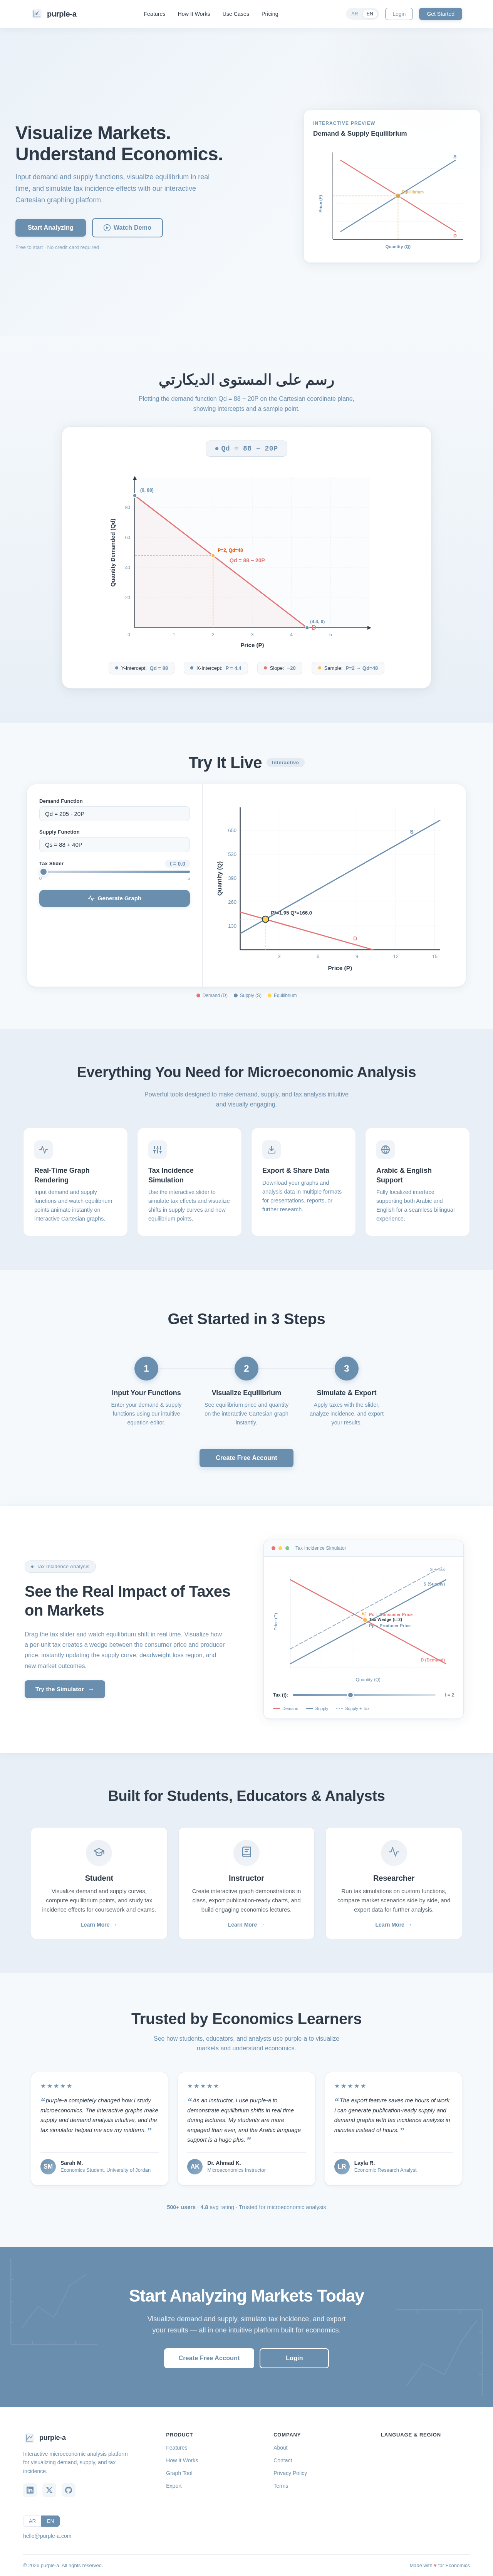
Project Purple-a is designed to provide tools for rendering and plotting mathematical functions, particularly on Cartesian coordinate planes. The system will support interactive visualizations, enabling users to explore relationships between variables graphically. The platform will also integrate features for educational and analytical purposes, focusing on microeconomic theory and related applications.
3. Functional Requirements
- As a User, I should be able to input mathematical functions (e.g., ( Q_d = 88 - 20P )) and render them on a Cartesian coordinate plane.
- As a User, I should be able to adjust axes (X and Y) dynamically to fit the function's range.
- As a User, I should be able to plot multiple functions simultaneously for comparison.
- As a User, I should be able to export the rendered graph as an image or PDF.
- As a User, I should be able to add annotations to the graph (e.g., equilibrium points, tax effects).
- As a User, I should be able to simulate tax effects graphically on demand and supply curves.
- As a User, I should be able to render and plot functions related to microeconomic theory, such as demand and supply curves, on the Cartesian coordinate plane.
4. User Personas
1. Admin
- Manages system configurations and user permissions.
- Oversees data integrity and system performance.
2. User
- Inputs mathematical functions and interacts with visualizations.
- Utilizes the platform for educational or analytical purposes.
3. Guest
- Explores limited features without the ability to save or export graphs.
5. Visuals Colors and Theme
Color Palette
Inspired by the reference image provided, the following unique color palette has been created for Project Purple-a:
- Background:
#F4F7FB(Soft blue-gray for a clean and professional look) - Surface:
#D9E2EC(Light gray-blue for panels and cards) - Text:
#1E293B(Dark navy for readability and contrast) - Accent:
#4C51BF(Rich indigo for interactive elements and highlights) - Muted Tones:
#A0AEC0(Neutral gray for secondary elements)
6. Signature Design Concept
Interactive Cartesian Graph Playground
The homepage will feature an Interactive Cartesian Graph Playground as its centerpiece. Users will be greeted with a dynamic graph interface that reacts to their inputs in real time. Key features include:
- Live Plotting: As users type equations, the graph updates instantly.
- Drag-and-Drop Axes: Users can click and drag axes to reposition or zoom in/out.
- Color-Coded Functions: Each function is assigned a unique color for easy differentiation.
- Equilibrium Highlight: Points of intersection between demand and supply curves are automatically highlighted with tooltips explaining their significance.
- Tax Simulation Slider: A slider allows users to apply taxes visually, showing shifts in curves and recalculated equilibrium points.
- Smooth Animations: Transitions between graph states (e.g., zooming, adding functions) are fluid and visually appealing.
- Export Options: A floating toolbar provides options to save the graph as an image or PDF.
- Microeconomic Theory Integration: Predefined templates for rendering demand and supply curves, elasticity calculations, and tax incidence visualizations.
This design ensures the homepage is both functional and visually captivating, leaving a lasting impression on users.
7. Non-Functional Requirements
- The system must render graphs within 500ms of input submission.
- The platform must support at least 10 simultaneous function plots without performance degradation.
- The system must be accessible on both desktop and mobile devices.
- The interface must adhere to WCAG 2.1 accessibility standards.
8. Tech Stack
Frontend
- React for Web
Backend
- Python
- FastAPI
Database
- MySQL (preferred for relational data)
- Alembic for migrations
AI Models
- GPT 5.2 for user-friendly responses
- Claude 4.5 Opas for academic or coding work
AI Tools
- Litellm for LLM Routing
- Langchain
Local Orchestration
- Docker
- Docker-compose
Server-Side Orchestration
- Kubernetes
9. Assumptions and Constraints
- Users are familiar with basic mathematical functions and graphing concepts.
- The system will primarily be used for educational purposes.
- Internet connectivity is required for AI-powered features.
- The platform will support English and Arabic languages.
10. Glossary
- Cartesian Coordinate Plane: A two-dimensional plane defined by X (horizontal) and Y (vertical) axes.
- Equilibrium Point: The price and quantity at which supply equals demand.
- Tax Simulation: A graphical representation of how taxes affect supply and demand curves.
- Microeconomic Theory: The study of individual decision-making units, such as consumers and firms, and their interactions in markets.
No comments yet. Be the first!