pure-dashboard
 Smriti Gupta
You are a senior full-stack engineer, AI/ML engineer, and system architect. Your task is to build a COMPLETE, REAL, DEPLOYABLE application based on the following project: PROJECT NAME: SMARTREN – Smart Dashboard for Monitoring and Transitioning to Renewable Household Energy GOAL: Build a production-ready intelligent dashboard that: - Simulates household energy consumption (small, medium, large homes) - Performs analytics and forecasting - Provides AI-based recommendations for energy optimization - Suggests renewable energy solutions (e.g., solar panel capacity) - Displays everything in a modern interactive dashboard ----------------------------------- ⚙️ TECH STACK (STRICT) ----------------------------------- Backend: - Python (FastAPI preferred) - MySQL database - Pandas, NumPy - Scikit-learn (KMeans, regression) - Prophet or ARIMA (forecasting) Frontend: - React.js (with Vite or Next.js) - Tailwind CSS (modern premium UI) - Chart.js or Recharts (for graphs) Other: - REST API architecture - JWT Authentication (basic login system) - Docker support (optional but preferred) ----------------------------------- 📦 CORE FEATURES (MANDATORY) ----------------------------------- 1. USER & HOUSEHOLD SYSTEM - Create household profiles: - Small, Medium, Large - Store: - Number of appliances - Energy rating - Location (optional) - Tariff rate 2. DATA SIMULATION ENGINE - Generate realistic hourly energy usage data - Appliances: - AC, Fan, Lights, Fridge, Washing Machine, TV - Include: - Peak hours - Seasonal variation - Random noise for realism 3. DATABASE DESIGN - MySQL schema with tables: - users - households - appliances - energy_usage - recommendations - Provide full SQL schema 4. ANALYTICS ENGINE - Identify: - Peak consumption hours - High-energy appliances - K-Means clustering: - Low / Medium / High usage classification - Regression: - Consumption vs cost 5. FORECASTING MODULE - Use Prophet or ARIMA to: - Predict next 7–30 days energy usage - Return API endpoints for predictions 6. RECOMMENDATION ENGINE - Rule-based + ML hybrid: Examples: - "Run washing machine during off-peak hours" - "Reduce AC usage during peak load" - Suggest solar panel capacity based on usage - Output: - Cost savings - Carbon reduction estimate 7. DASHBOARD (IMPORTANT – PREMIUM UI) - Pages: - Overview - Analytics - Forecast - Recommendations - Charts: - Daily / Weekly / Monthly usage - Appliance-wise consumption - Cost trends - Forecast graph - UI must be: - Clean - Modern - Responsive - Premium looking 8. API DESIGN Provide full FastAPI routes: - /generate-data - /get-usage - /analytics - /forecast - /recommendations 9. EXPORT FEATURE - Download reports: - CSV / PDF 10. DEPLOYMENT - Step-by-step instructions: - Run backend (FastAPI) - Run frontend (React) - Connect MySQL - Include: - requirements.txt - package.json - environment variables ----------------------------------- 📁 OUTPUT FORMAT (VERY IMPORTANT) ----------------------------------- Give output in THIS ORDER: 1. System Architecture Diagram (text explanation) 2. Database Schema (SQL) 3. Backend Code (FastAPI complete) 4. ML Models Code 5. Data Simulation Script 6. Frontend Code (React with charts) 7. API Integration (frontend ↔ backend) 8. Deployment Guide (VS Code step-by-step) 9. Folder Structure (clean professional) ----------------------------------- 🚨 RULES (STRICT) ----------------------------------- - Do NOT give partial code - Do NOT skip modules - Code must run without errors - Use realistic dummy data - UI must look like a startup product - Keep code modular and clean - Comment important logic ----------------------------------- 🎯 END GOAL ----------------------------------- The final result should be a: 👉 Fully working Smart Energy Dashboard 👉 That I can run locally in VS Code 👉 And present as a FINAL YEAR BTECH PROJECT
Comments (0)
Sign in to leave a comment
System Requirements
System Requirements Document (SRD)
Project Name: pure-dashboard
1. Introduction
The pure-dashboard project aims to deliver a modern, interactive, and intelligent dashboard tailored for monitoring and optimizing household energy consumption. This dashboard will provide personalized AI-driven recommendations for logged-in households, enabling users to make informed decisions about energy usage and transition to renewable energy solutions.
Smriti Gupta, based in India, has envisioned this project to address the growing need for sustainable energy management in households. The system will cater to locale-specific defaults, such as INR currency, IST timezone, and regional energy consumption patterns.
2. System Overview
The pure-dashboard system will simulate household energy consumption, perform analytics and forecasting, and provide actionable AI-based recommendations. It will feature a premium, responsive UI for seamless user interaction and will be deployable locally or on cloud infrastructure.
Key components include:
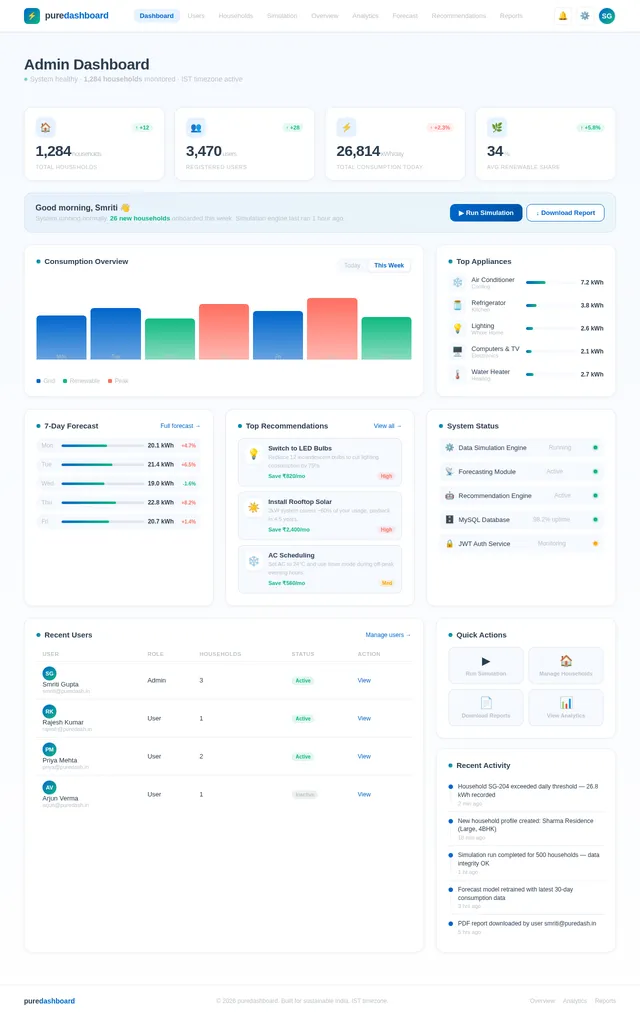
- Data Simulation Engine: Generates realistic energy usage data for small, medium, and large households.
- Analytics Module: Identifies consumption patterns and high-energy appliances.
- Forecasting Module: Predicts future energy usage using advanced time-series models.
- Recommendation Engine: Provides personalized suggestions for energy optimization and renewable energy adoption.
- Interactive Dashboard: Displays analytics, forecasts, and recommendations in a visually appealing format.
3. Functional Requirements
As a User:
- I should be able to log in and view my household's energy consumption data.
- I should be able to see personalized recommendations for optimizing energy usage.
- I should be able to download reports in CSV or PDF format.
- I should be able to view analytics and forecasts for daily, weekly, and monthly energy usage.
As an Admin:
- I should be able to manage household profiles and user accounts.
- I should be able to simulate energy usage data for different household types.
- I should be able to monitor system performance and data integrity.
4. User Personas
1. User
- Description: A household owner or resident who logs in to monitor energy consumption and receive personalized recommendations.
- Needs: Easy access to analytics, forecasts, and actionable insights.
2. Admin
- Description: A system administrator responsible for managing user accounts, household profiles, and ensuring system functionality.
- Needs: Tools for data simulation, user management, and system monitoring.
5. Visuals Colors and Theme
Color Palette:
- Background:
#F5F9FF(Soft Sky Blue) - Surface:
#FFFFFF(Pure White) - Text:
#2C3E50(Deep Slate Gray) - Accent:
#FF6F61(Warm Coral) - Muted Tones:
#BDC3C7(Light Gray)
Theme:
The theme will be clean, modern, and professional, reflecting the premium nature of the dashboard. The color palette is designed to evoke trust, clarity, and sustainability.
6. Signature Design Concept
Interactive Energy Globe
The homepage will feature a 3D interactive globe representing the user's household energy consumption. The globe will be divided into segments (e.g., appliances, peak hours, renewable energy potential), each dynamically updating based on real-time data.
Details:
- Animation: The globe rotates slowly, with segments pulsing to indicate active data points.
- Interaction: Users can click on segments to zoom in and view detailed analytics.
- Transitions: Smooth fade-ins and slide-ins for charts and recommendations.
- Micro-interactions: Hover effects that highlight actionable insights (e.g., "Click to view solar panel recommendations").
- Color Shifts: The globe's colors subtly change based on energy consumption levels (e.g., green for low usage, red for high usage).
This design will make the dashboard visually captivating and instantly memorable.
7. Non-Functional Requirements
- Performance: The system must handle up to 10,000 concurrent users without degradation.
- Scalability: Support for adding new households and appliances without major architectural changes.
- Security: Implement JWT authentication and secure APIs to protect user data.
- Localization: Default settings for India (INR currency, IST timezone).
- Accessibility: Ensure compliance with WCAG 2.1 standards for accessibility.
8. Tech Stack
Frontend:
- React.js (with Vite for fast builds)
- Tailwind CSS (modern premium UI)
- Chart.js or Recharts (for interactive graphs)
Backend:
- Python (FastAPI for REST APIs)
- MySQL (with Alembic for migrations)
AI Models:
- GPT 5.4 for user-friendly responses
- Prophet for time-series forecasting
- Scikit-learn (KMeans clustering, regression)
Tools:
- Docker for local orchestration
- Kubernetes for server-side orchestration
9. Assumptions and Constraints
Assumptions:
- Users have basic knowledge of energy consumption metrics.
- The system will primarily be used in India, with locale-specific defaults.
- Renewable energy recommendations will focus on solar solutions.
Constraints:
- Limited to household energy consumption; industrial or commercial usage is out of scope.
- Forecasting accuracy depends on the quality of simulated data.
10. Glossary
- Dashboard: A user interface that displays analytics, forecasts, and recommendations.
- Energy Consumption: The amount of energy used by household appliances.
- Renewable Energy: Energy sourced from natural processes, such as solar or wind power.
- Forecasting: Predicting future energy usage based on historical data.
- Recommendation Engine: A system that provides actionable suggestions for optimizing energy usage.
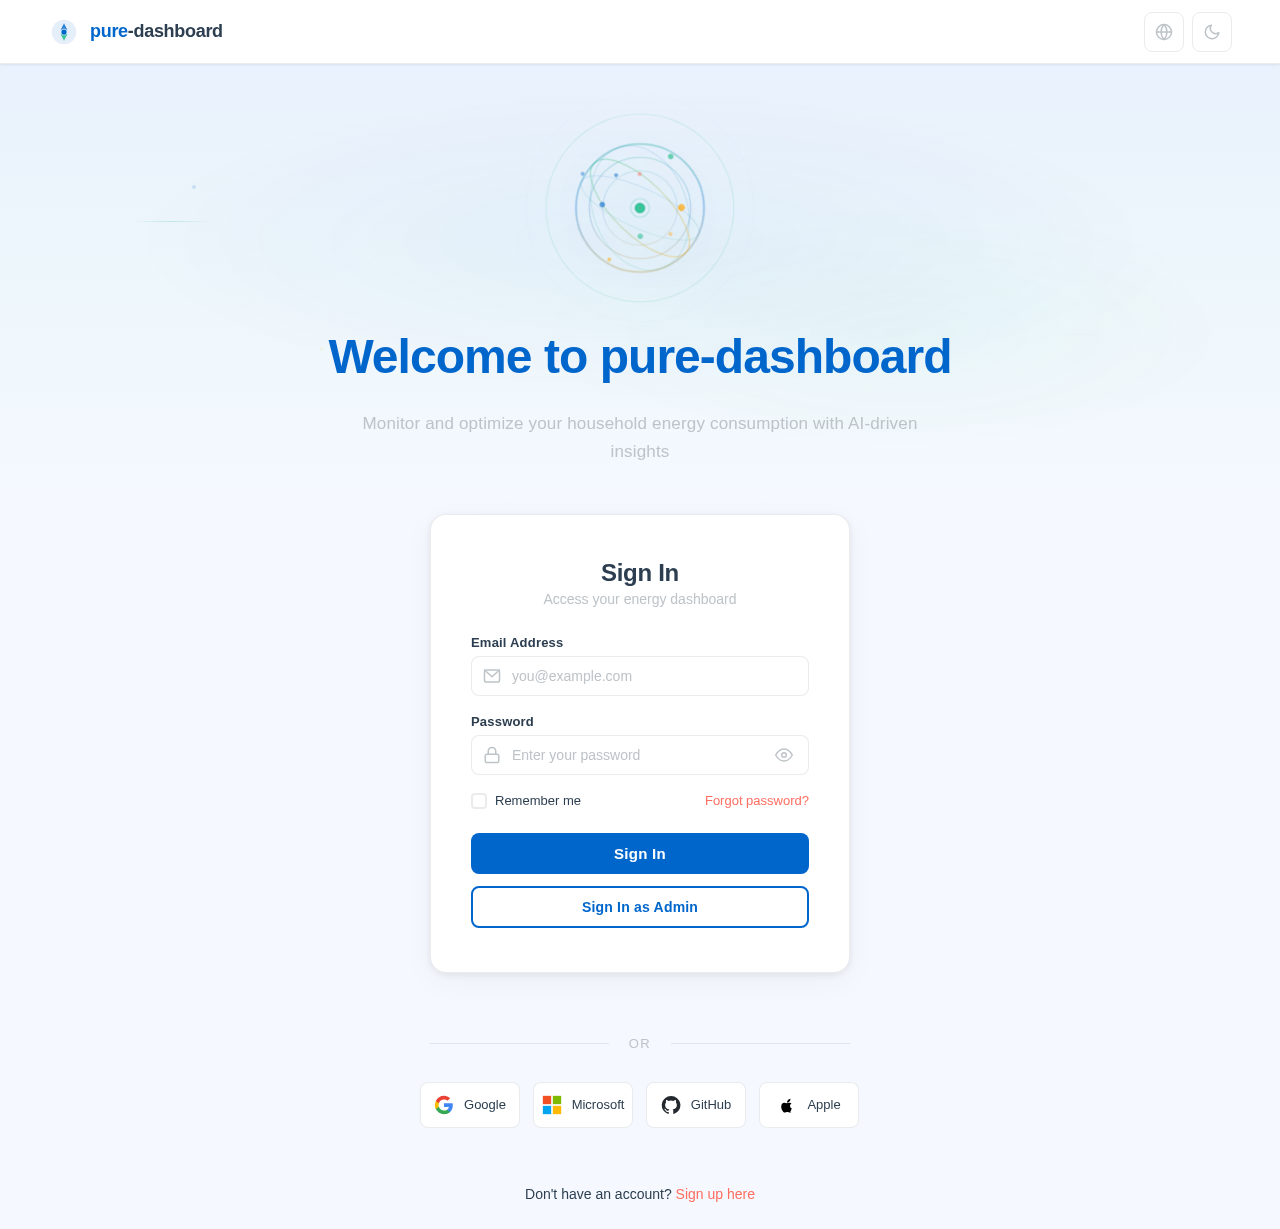
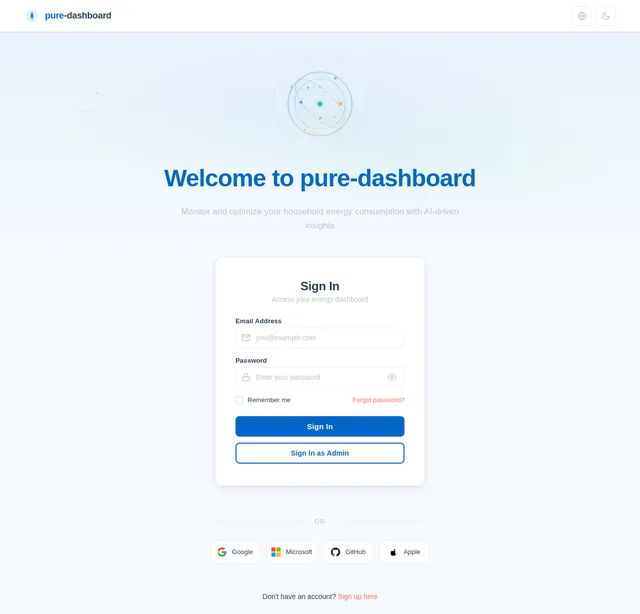
Welcome to pure-dashboard
Monitor and optimize your household energy consumption with AI-driven insights
Sign In
Access your energy dashboard
Don't have an account? Sign up here
No comments yet. Be the first!