prime-complete
 tanjiro kamado
Build a complete, professional 3D Data Analyst Agent system using HTML, CSS, JavaScript, and Python that operates entirely without APIs or Docker, leveraging only the best available local LLM models. The system should feature three specialized agents, each representing a core data analyst skill: Excel Mastery Agent, SQL Expert Agent, and Power BI Visualization Agent, all rendered with professional 3D avatars or interactive interfaces. Create a full end-to-end data analysis project workflow that progresses from zero to completion through these integrated stages: - **Data Ingestion & Exploration**: Upload or connect to data sources, with the system automatically detecting schema, data types, and quality issues - **Intelligent Data Cleaning**: Automated detection and correction of missing values, outliers, duplicates, inconsistent formatting, and type mismatches, with the LLM explaining each cleaning decision - **Natural Language to Query Conversion**: Convert user questions into executable SQL queries or Excel formulas automatically, with the LLM generating, validating, and explaining the query logic - **Dynamic Dashboard Generation**: Create customized, interactive dashboards via text prompts specifying KPIs, visualizations, filters, and layout preferences - **Advanced Visualization**: Generate charts including scatter plots, trend lines, heatmaps, funnel charts, geographic maps, and drill-down hierarchies based on prompt descriptions - **KPI & Scorecard Builder**: Automatically calculate and display key performance indicators with conditional formatting, targets, and variance analysis - **Narrative Insights & Summarization**: The LLM generates executive summaries, anomaly explanations, and actionable recommendations from analysis results Technical requirements and constraints: - No external API calls; all LLM inference must run locally using the best available open-source models (e.g., Llama 3, Mistral, CodeLlama, or comparable) - No Docker containers; use direct Python environment management - Frontend: HTML5, CSS3, and vanilla JavaScript or lightweight frameworks for the 3D agent interfaces and dashboard rendering - Backend: Python with FastAPI or Flask for orchestration, local LLM integration via llama.cpp, Ollama, or similar local inference engines - Database: SQLite or local PostgreSQL for SQL agent demonstrations and project data persistence - 3D Agent Representation: Use Three.js or CSS 3D transforms to create professional, animated agent avatars that respond during task execution with status indicators and speech bubbles Specific interactive features to implement: - Prompt-based dashboard creation where users describe what they want to see (e.g., "Create a sales dashboard with monthly revenue trend, top 10 products by region, and customer acquisition cost KPI") - Conversational data cleaning where users ask questions like "Find and fix all date formatting issues" or "Show me duplicate records in the customer table" - SQL query sandbox with natural language input, generated query display, execution results, and the LLM explaining how the query answers the original question - Excel formula generator with step-by-step breakdown of complex calculations - Real-time collaboration between the three agents, where the SQL agent passes cleaned data to the Power BI agent for immediate visualization Include error handling, fallback explanations when the LLM is uncertain, progress tracking for multi-step operations, and export capabilities for dashboards (PNG, PDF) and datasets (CSV, Excel).


Comments (0)
Sign in to leave a comment
System Requirements
System Requirements Document for prime-complete
1. Introduction
The prime-complete project aims to build a professional 3D Data Analyst Agent system that operates entirely locally without APIs or Docker. It leverages the best available local LLM models to provide a sophisticated data analysis experience. The system features three specialized agents: Excel Mastery Agent, SQL Expert Agent, and Power BI Visualization Agent, each represented with professional 3D avatars or interactive interfaces. The target audience is data analysts seeking an advanced, immersive tool for comprehensive data analysis workflows.
2. System Overview
The system delivers an end-to-end data analysis workflow, from data ingestion to narrative insights, using local execution and open-source technologies. It includes specialized agents for Excel, SQL, and Power BI tasks, each with interactive 3D representations. The system is designed for local operation, ensuring data privacy and independence from external services.
2a. Product Interpretation and Delivery Boundary
The system operates entirely locally, using HTML, CSS, JavaScript, and Python, with no external API calls or Docker containers. It integrates local LLM models for intelligent data processing and visualization. The system supports a complete data analysis lifecycle, with a focus on professional use and advanced technology. The delivery excludes any external service dependencies, ensuring all operations are performed within the local environment.
2b. Source Content Inventory
Not applicable as no content_source directive was provided.
2c. Page Content and Component Coverage
Landing
- Information: Introduction to the system, its capabilities, and intended audience.
- Primary Actions: Navigate to Login or explore system features.
- Components: Overview video, feature highlights, and call-to-action buttons.
Login
- Information: User authentication for returning analysts.
- Primary Actions: Enter credentials, submit login.
- Components: Login form, error messages for incorrect credentials.
Dashboard
- Information: Summary of project progress and access to various workflow stages.
- Primary Actions: Navigate to Data Ingestion, Data Cleaning, Query Builder, etc.
- Components: Project overview, navigation links, status indicators.
Data Ingestion
- Information: Upload or connect to data sources, schema detection.
- Primary Actions: Upload data, view schema and quality issues.
- Components: File upload interface, schema viewer, quality issue alerts.
Data Cleaning
- Information: Review and clean data with LLM explanations.
- Primary Actions: Identify and correct data issues, view explanations.
- Components: Data issue list, cleaning tools, explanation panel.
Query Builder
- Information: Convert natural language to SQL or Excel formulas.
- Primary Actions: Input query, view generated SQL/formula, validate logic.
- Components: Query input field, SQL/formula display, validation feedback.
SQL Sandbox
- Information: Inspect and execute generated SQL queries.
- Primary Actions: Execute query, view results, understand query logic.
- Components: SQL editor, execution results, logic explanation.
Dashboards
- Information: Create and refine interactive dashboards.
- Primary Actions: Generate dashboard, customize layout, add visualizations.
- Components: Dashboard creation tool, visualization library, layout editor.
KPI Scorecards
- Information: Calculate and review KPIs with formatting and analysis.
- Primary Actions: Define KPIs, apply conditional formatting, analyze variance.
- Components: KPI builder, formatting options, variance analysis tools.
Insights
- Information: Review executive summaries and recommendations.
- Primary Actions: View summaries, explore recommendations.
- Components: Summary viewer, recommendation list, anomaly explanations.
Operations
- Information: Track progress and handle errors in multi-step operations.
- Primary Actions: Monitor operation progress, view error explanations.
- Components: Progress tracker, error message display, fallback options.
Agent Workspace
- Information: Access specialized agent experiences and collaboration.
- Primary Actions: Interact with agents, initiate SQL-to-Power BI handoff.
- Components: Agent avatars, collaboration tools, task progress indicators.
Exports
- Information: Export dashboards and datasets in specified formats.
- Primary Actions: Select export format, download file.
- Components: Export options, download links, format selection.
3. Functional Requirements
- As a Data Analyst, I should be able to upload or connect to data sources and automatically detect schema, data types, and quality issues. (explicit)
- As a Data Analyst, I should be able to detect and correct missing values, outliers, duplicates, inconsistent formatting, and type mismatches, with explanations provided by the local LLM. (explicit)
- As a Data Analyst, I should be able to convert natural-language questions into executable SQL queries or Excel formulas, with generation, validation, and explanations of query logic. (explicit)
- As a Data Analyst, I should be able to generate customized interactive dashboards from text prompts describing KPIs, visualizations, filters, and layout preferences. (explicit)
- As a Data Analyst, I should be able to generate advanced visualizations including scatter plots, trend lines, heatmaps, funnel charts, geographic maps, and drill-down hierarchies from prompt descriptions. (explicit)
- As a Data Analyst, I should be able to automatically calculate and display KPIs with conditional formatting, targets, and variance analysis. (explicit)
- As a Data Analyst, I should be able to generate executive summaries, anomaly explanations, and actionable recommendations from analysis results. (explicit)
- As a Data Analyst, I should be able to perform prompt-based dashboard creation. (explicit)
- As a Data Analyst, I should be able to engage in conversational data cleaning. (explicit)
- As a Data Analyst, I should be able to use a SQL query sandbox with natural-language input, generated-query display, execution results, and explanation of how the query answers the question. (explicit)
- As a Data Analyst, I should be able to use an Excel formula generator with step-by-step breakdowns of complex calculations. (explicit)
- As a Data Analyst, I should be able to collaborate where the SQL agent passes cleaned data to the Power BI agent for visualization. (explicit)
- As a Data Analyst, I should be able to handle errors, receive fallback explanations when the LLM is uncertain, track progress for multi-step operations, and export dashboards as PNG/PDF and datasets as CSV/Excel. (explicit)
4. User Personas
- Data Analyst: The indispensable human operator who uploads data, asks analysis and cleaning questions, reviews generated queries, dashboards, KPIs, and insights, and completes the end-to-end project workflow.
5. Core User Flows
-
Data Ingestion Flow:
- Actor: Data Analyst
- Trigger: User accesses the Data Ingestion page.
- Steps:
- Upload or connect to a data source.
- System automatically detects schema, data types, and quality issues.
- User reviews detected issues.
- Outcome: Data is ready for cleaning.
-
Data Cleaning Flow:
- Actor: Data Analyst
- Trigger: User accesses the Data Cleaning page.
- Steps:
- Review data issues.
- Use LLM to detect and correct issues.
- Receive explanations for cleaning decisions.
- Outcome: Data is cleaned and ready for analysis.
-
Query Conversion Flow:
- Actor: Data Analyst
- Trigger: User accesses the Query Builder page.
- Steps:
- Input natural-language question.
- System converts it to SQL or Excel formula.
- Validate and understand query logic.
- Outcome: Executable query/formula is ready.
-
Dashboard Generation Flow:
- Actor: Data Analyst
- Trigger: User accesses the Dashboards page.
- Steps:
- Describe desired dashboard via text prompt.
- System generates interactive dashboard.
- Customize layout and visualizations.
- Outcome: Interactive dashboard is created.
-
KPI Scorecard Flow:
- Actor: Data Analyst
- Trigger: User accesses the KPI Scorecards page.
- Steps:
- Define KPIs and targets.
- Apply conditional formatting.
- Analyze variance.
- Outcome: KPI scorecard is ready for review.
-
Insight Generation Flow:
- Actor: Data Analyst
- Trigger: User accesses the Insights page.
- Steps:
- Review executive summaries.
- Explore anomaly explanations.
- Consider actionable recommendations.
- Outcome: Insights are generated and reviewed.
-
Export Flow:
- Actor: Data Analyst
- Trigger: User accesses the Exports page.
- Steps:
- Select export format (PNG, PDF, CSV, Excel).
- Download the file.
- Outcome: Data and dashboards are exported.
6. Visuals Colors and Theme
- Muse: Gleb Kuznetsov
- Palette:
- Background: #00001A
- Surface: #0A0A2A
- Text: #E0E0F8
- Primary: #00E0FF
- Accent: #FF00FF
- Muted: #303060
- Typography:
- Headings: Space Grotesk — Wide, uppercase, medium weight, tight tracking
- Body: Orbitron
- Scale: 1.5 modular, 64/32/21/14
- Shape Language: Full-bleed 3D scenes with floating glass panels and radial layouts.
- Layout: Asymmetric layouts with floating elements, minimal chrome, and edge-to-edge panels.
- Motion: Slow orbit and parallax effects, data streams, and light sweeps for dynamic interaction.
7. Signature Design Concept
A full-viewport 3D scene with a central floating glass panel displaying a holographic agent avatar. The background is deep black with luminous cyan and magenta highlights creating a sense of depth and motion. The central real-time 3D avatar interacts with user inputs and displays task progress, surrounded by floating glass panels that reveal data insights with luminous edges.
8. Interaction Model & Motion Direction
- Interaction Model: Animated
- Motion Tempo: Cinematic
- Hero Dimensionality: WebGL
- Landing Hero Motion Brief: A central floating glass panel with a holographic agent avatar, surrounded by slow orbit animations and responsive light sweeps that highlight key data points and interactions. The scene uses real-time rendering for interactivity and includes a reduced-motion state for accessibility.
9. Non-Functional Requirements
- Local Execution: All operations must execute locally without external API calls or Docker containers.
- Performance: The system should handle large datasets efficiently and provide real-time feedback.
- Security: Ensure data privacy and integrity with local data processing.
- Usability: The interface should be intuitive and support seamless navigation through the workflow.
10. Tech Stack
- Frontend: HTML5, CSS3, vanilla JavaScript, Three.js
- Backend: Python, FastAPI or Flask, llama.cpp or Ollama for local LLM integration
- Database: SQLite or local PostgreSQL
11. Assumptions and Constraints
- Assumptions:
- Users have a basic understanding of data analysis concepts.
- The system will be used in environments with sufficient computational resources for local LLM inference.
- Constraints:
- No external API calls or Docker containers.
- All LLM inference must run locally using open-source models.
12. Glossary
- LLM: Large Language Model, used for natural language processing tasks.
- SQL: Structured Query Language, used for managing and querying relational databases.
- KPI: Key Performance Indicator, a measurable value that demonstrates how effectively a company is achieving key business objectives.
- 3D Agent: A virtual representation of a specialized data analysis skill, rendered in 3D for interactive use.
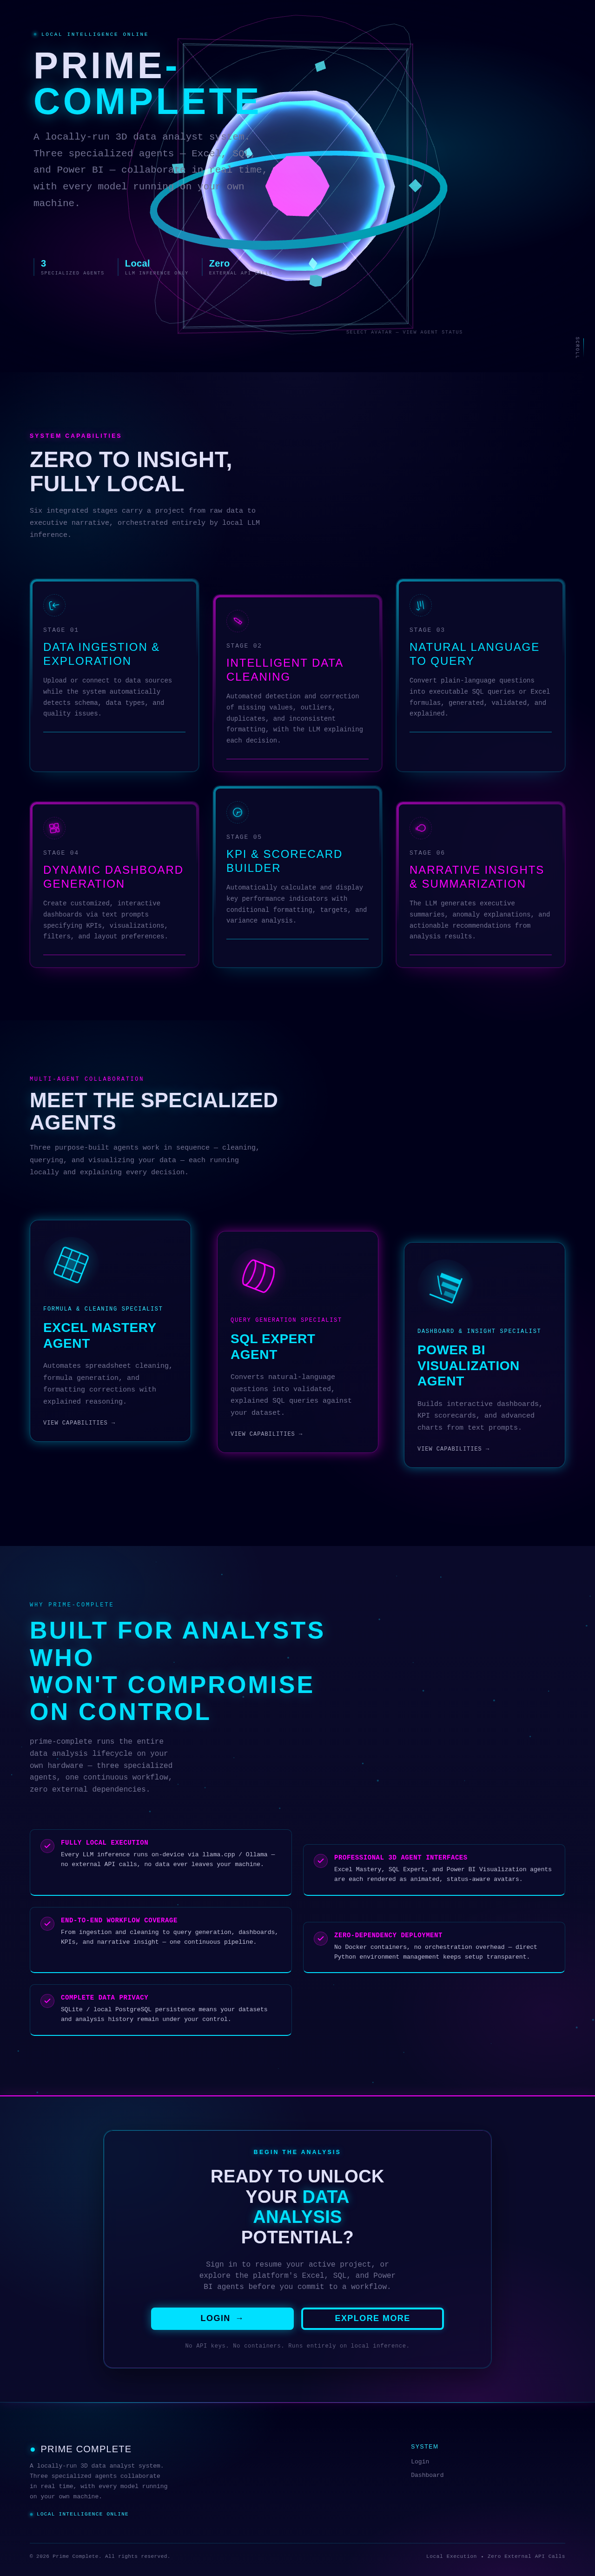
PRIME-COMPLETE
A locally-run 3D data analyst system. Three specialized agents — Excel, SQL, and Power BI — collaborate in real time, with every model running on your own machine.
Zero To Insight,
Fully Local
Six integrated stages carry a project from raw data to executive narrative, orchestrated entirely by local LLM inference.
Data Ingestion & Exploration
Upload or connect to data sources while the system automatically detects schema, data types, and quality issues.
Intelligent Data Cleaning
Automated detection and correction of missing values, outliers, duplicates, and inconsistent formatting, with the LLM explaining each decision.
Natural Language to Query
Convert plain-language questions into executable SQL queries or Excel formulas, generated, validated, and explained.
Dynamic Dashboard Generation
Create customized, interactive dashboards via text prompts specifying KPIs, visualizations, filters, and layout preferences.
KPI & Scorecard Builder
Automatically calculate and display key performance indicators with conditional formatting, targets, and variance analysis.
Narrative Insights & Summarization
The LLM generates executive summaries, anomaly explanations, and actionable recommendations from analysis results.
Multi-Agent Collaboration
Meet the Specialized Agents
Three purpose-built agents work in sequence — cleaning, querying, and visualizing your data — each running locally and explaining every decision.
Excel Mastery Agent
Automates spreadsheet cleaning, formula generation, and formatting corrections with explained reasoning.
SQL Expert Agent
Converts natural-language questions into validated, explained SQL queries against your dataset.
Power BI Visualization Agent
Builds interactive dashboards, KPI scorecards, and advanced charts from text prompts.
Built for analysts who
won't compromise on control
prime-complete runs the entire data analysis lifecycle on your own hardware — three specialized agents, one continuous workflow, zero external dependencies.
Fully Local Execution
Every LLM inference runs on-device via llama.cpp / Ollama — no external API calls, no data ever leaves your machine.
Professional 3D Agent Interfaces
Excel Mastery, SQL Expert, and Power BI Visualization agents are each rendered as animated, status-aware avatars.
End-to-End Workflow Coverage
From ingestion and cleaning to query generation, dashboards, KPIs, and narrative insight — one continuous pipeline.
Zero-Dependency Deployment
No Docker containers, no orchestration overhead — direct Python environment management keeps setup transparent.
Complete Data Privacy
SQLite / local PostgreSQL persistence means your datasets and analysis history remain under your control.
Begin the Analysis
Ready to unlock your data analysis potential?
Sign in to resume your active project, or explore the platform's Excel, SQL, and Power BI agents before you commit to a workflow.
No API keys. No containers. Runs entirely on local inference.
No comments yet. Be the first!