prime-complete
 tanjiro kamado
Build a complete, professional 3D Data Analyst Agent system using HTML, CSS, JavaScript, and Python that operates entirely without APIs or Docker, leveraging only the best available local LLM models. The system should feature three specialized agents, each representing a core data analyst skill: Excel Mastery Agent, SQL Expert Agent, and Power BI Visualization Agent, all rendered with professional 3D avatars or interactive interfaces. Create a full end-to-end data analysis project workflow that progresses from zero to completion through these integrated stages: - **Data Ingestion & Exploration**: Upload or connect to data sources, with the system automatically detecting schema, data types, and quality issues - **Intelligent Data Cleaning**: Automated detection and correction of missing values, outliers, duplicates, inconsistent formatting, and type mismatches, with the LLM explaining each cleaning decision - **Natural Language to Query Conversion**: Convert user questions into executable SQL queries or Excel formulas automatically, with the LLM generating, validating, and explaining the query logic - **Dynamic Dashboard Generation**: Create customized, interactive dashboards via text prompts specifying KPIs, visualizations, filters, and layout preferences - **Advanced Visualization**: Generate charts including scatter plots, trend lines, heatmaps, funnel charts, geographic maps, and drill-down hierarchies based on prompt descriptions - **KPI & Scorecard Builder**: Automatically calculate and display key performance indicators with conditional formatting, targets, and variance analysis - **Narrative Insights & Summarization**: The LLM generates executive summaries, anomaly explanations, and actionable recommendations from analysis results Technical requirements and constraints: - No external API calls; all LLM inference must run locally using the best available open-source models (e.g., Llama 3, Mistral, CodeLlama, or comparable) - No Docker containers; use direct Python environment management - Frontend: HTML5, CSS3, and vanilla JavaScript or lightweight frameworks for the 3D agent interfaces and dashboard rendering - Backend: Python with FastAPI or Flask for orchestration, local LLM integration via llama.cpp, Ollama, or similar local inference engines - Database: SQLite or local PostgreSQL for SQL agent demonstrations and project data persistence - 3D Agent Representation: Use Three.js or CSS 3D transforms to create professional, animated agent avatars that respond during task execution with status indicators and speech bubbles Specific interactive features to implement: - Prompt-based dashboard creation where users describe what they want to see (e.g., "Create a sales dashboard with monthly revenue trend, top 10 products by region, and customer acquisition cost KPI") - Conversational data cleaning where users ask questions like "Find and fix all date formatting issues" or "Show me duplicate records in the customer table" - SQL query sandbox with natural language input, generated query display, execution results, and the LLM explaining how the query answers the original question - Excel formula generator with step-by-step breakdown of complex calculations - Real-time collaboration between the three agents, where the SQL agent passes cleaned data to the Power BI agent for immediate visualization Include error handling, fallback explanations when the LLM is uncertain, progress tracking for multi-step operations, and export capabilities for dashboards (PNG, PDF) and datasets (CSV, Excel).


Comments (0)
Sign in to leave a comment
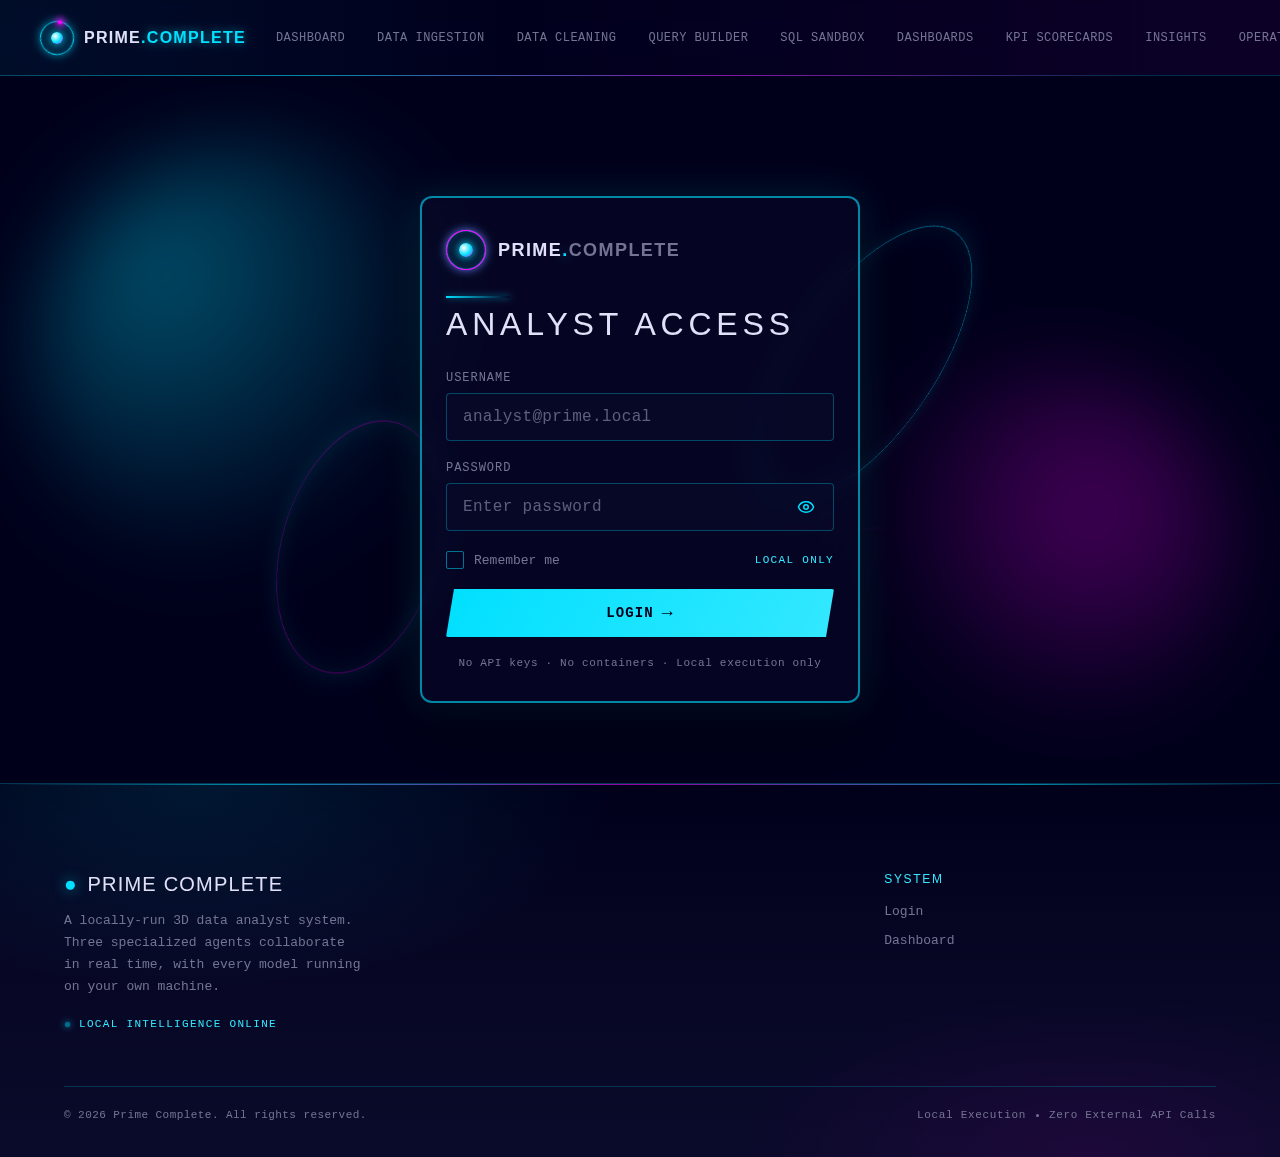
Analyst Access
No API keys · No containers · Local execution only
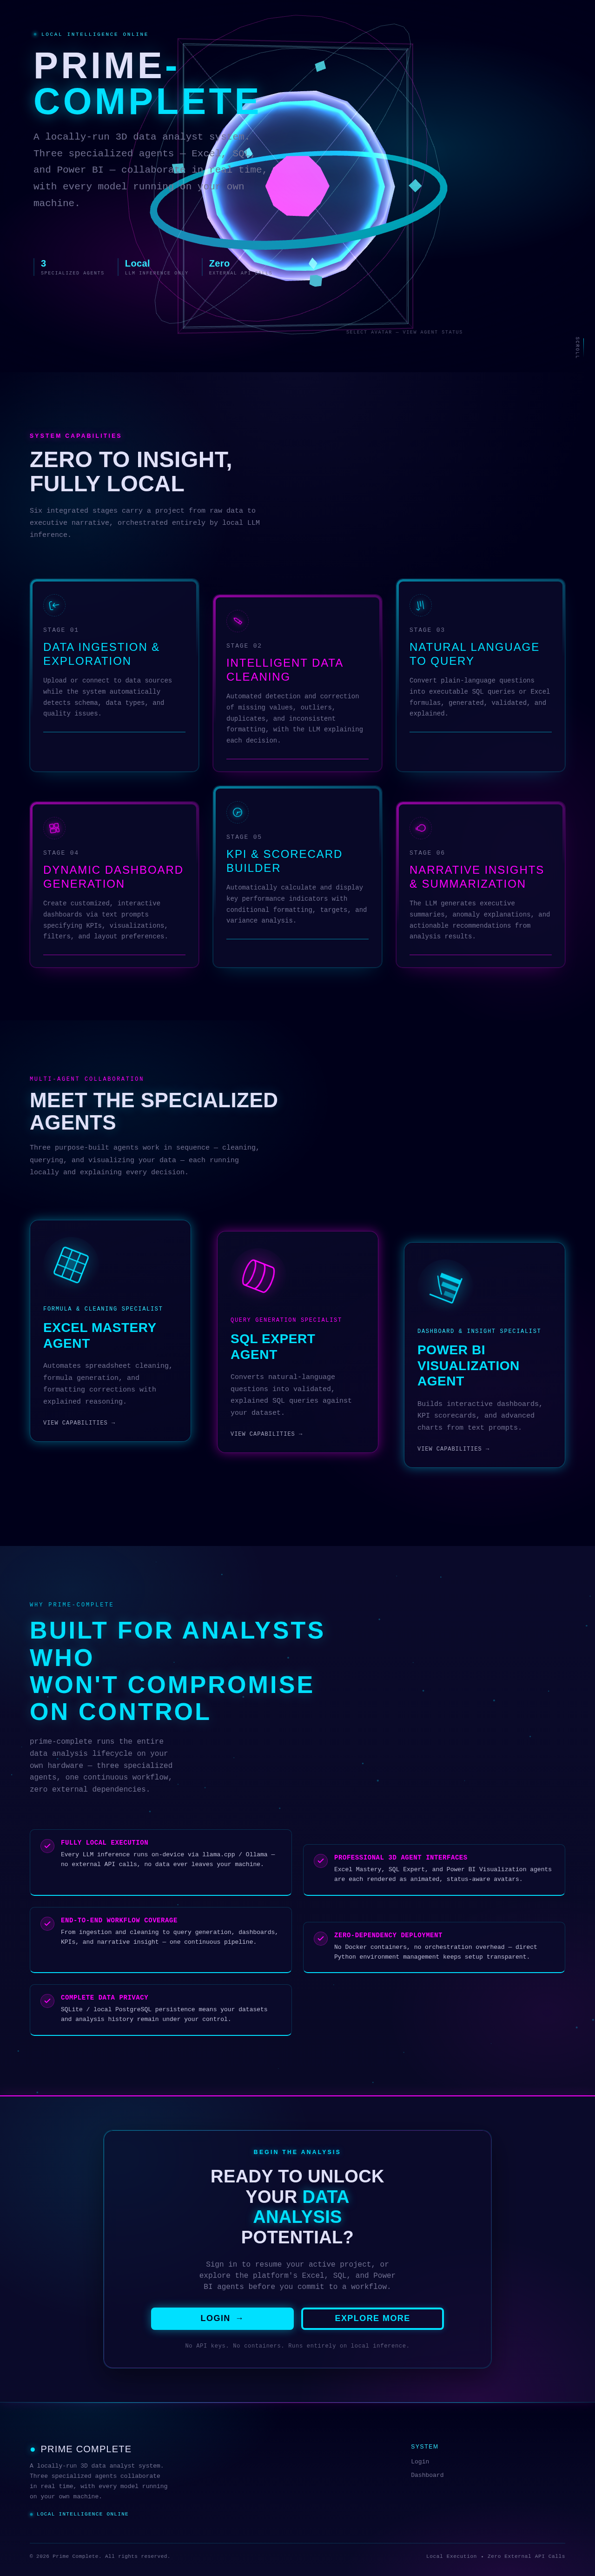
PRIME-COMPLETE
A locally-run 3D data analyst system. Three specialized agents — Excel, SQL, and Power BI — collaborate in real time, with every model running on your own machine.
Zero To Insight,
Fully Local
Six integrated stages carry a project from raw data to executive narrative, orchestrated entirely by local LLM inference.
Data Ingestion & Exploration
Upload or connect to data sources while the system automatically detects schema, data types, and quality issues.
Intelligent Data Cleaning
Automated detection and correction of missing values, outliers, duplicates, and inconsistent formatting, with the LLM explaining each decision.
Natural Language to Query
Convert plain-language questions into executable SQL queries or Excel formulas, generated, validated, and explained.
Dynamic Dashboard Generation
Create customized, interactive dashboards via text prompts specifying KPIs, visualizations, filters, and layout preferences.
KPI & Scorecard Builder
Automatically calculate and display key performance indicators with conditional formatting, targets, and variance analysis.
Narrative Insights & Summarization
The LLM generates executive summaries, anomaly explanations, and actionable recommendations from analysis results.
Multi-Agent Collaboration
Meet the Specialized Agents
Three purpose-built agents work in sequence — cleaning, querying, and visualizing your data — each running locally and explaining every decision.
Excel Mastery Agent
Automates spreadsheet cleaning, formula generation, and formatting corrections with explained reasoning.
SQL Expert Agent
Converts natural-language questions into validated, explained SQL queries against your dataset.
Power BI Visualization Agent
Builds interactive dashboards, KPI scorecards, and advanced charts from text prompts.
Built for analysts who
won't compromise on control
prime-complete runs the entire data analysis lifecycle on your own hardware — three specialized agents, one continuous workflow, zero external dependencies.
Fully Local Execution
Every LLM inference runs on-device via llama.cpp / Ollama — no external API calls, no data ever leaves your machine.
Professional 3D Agent Interfaces
Excel Mastery, SQL Expert, and Power BI Visualization agents are each rendered as animated, status-aware avatars.
End-to-End Workflow Coverage
From ingestion and cleaning to query generation, dashboards, KPIs, and narrative insight — one continuous pipeline.
Zero-Dependency Deployment
No Docker containers, no orchestration overhead — direct Python environment management keeps setup transparent.
Complete Data Privacy
SQLite / local PostgreSQL persistence means your datasets and analysis history remain under your control.
Begin the Analysis
Ready to unlock your data analysis potential?
Sign in to resume your active project, or explore the platform's Excel, SQL, and Power BI agents before you commit to a workflow.
No API keys. No containers. Runs entirely on local inference.
No comments yet. Be the first!