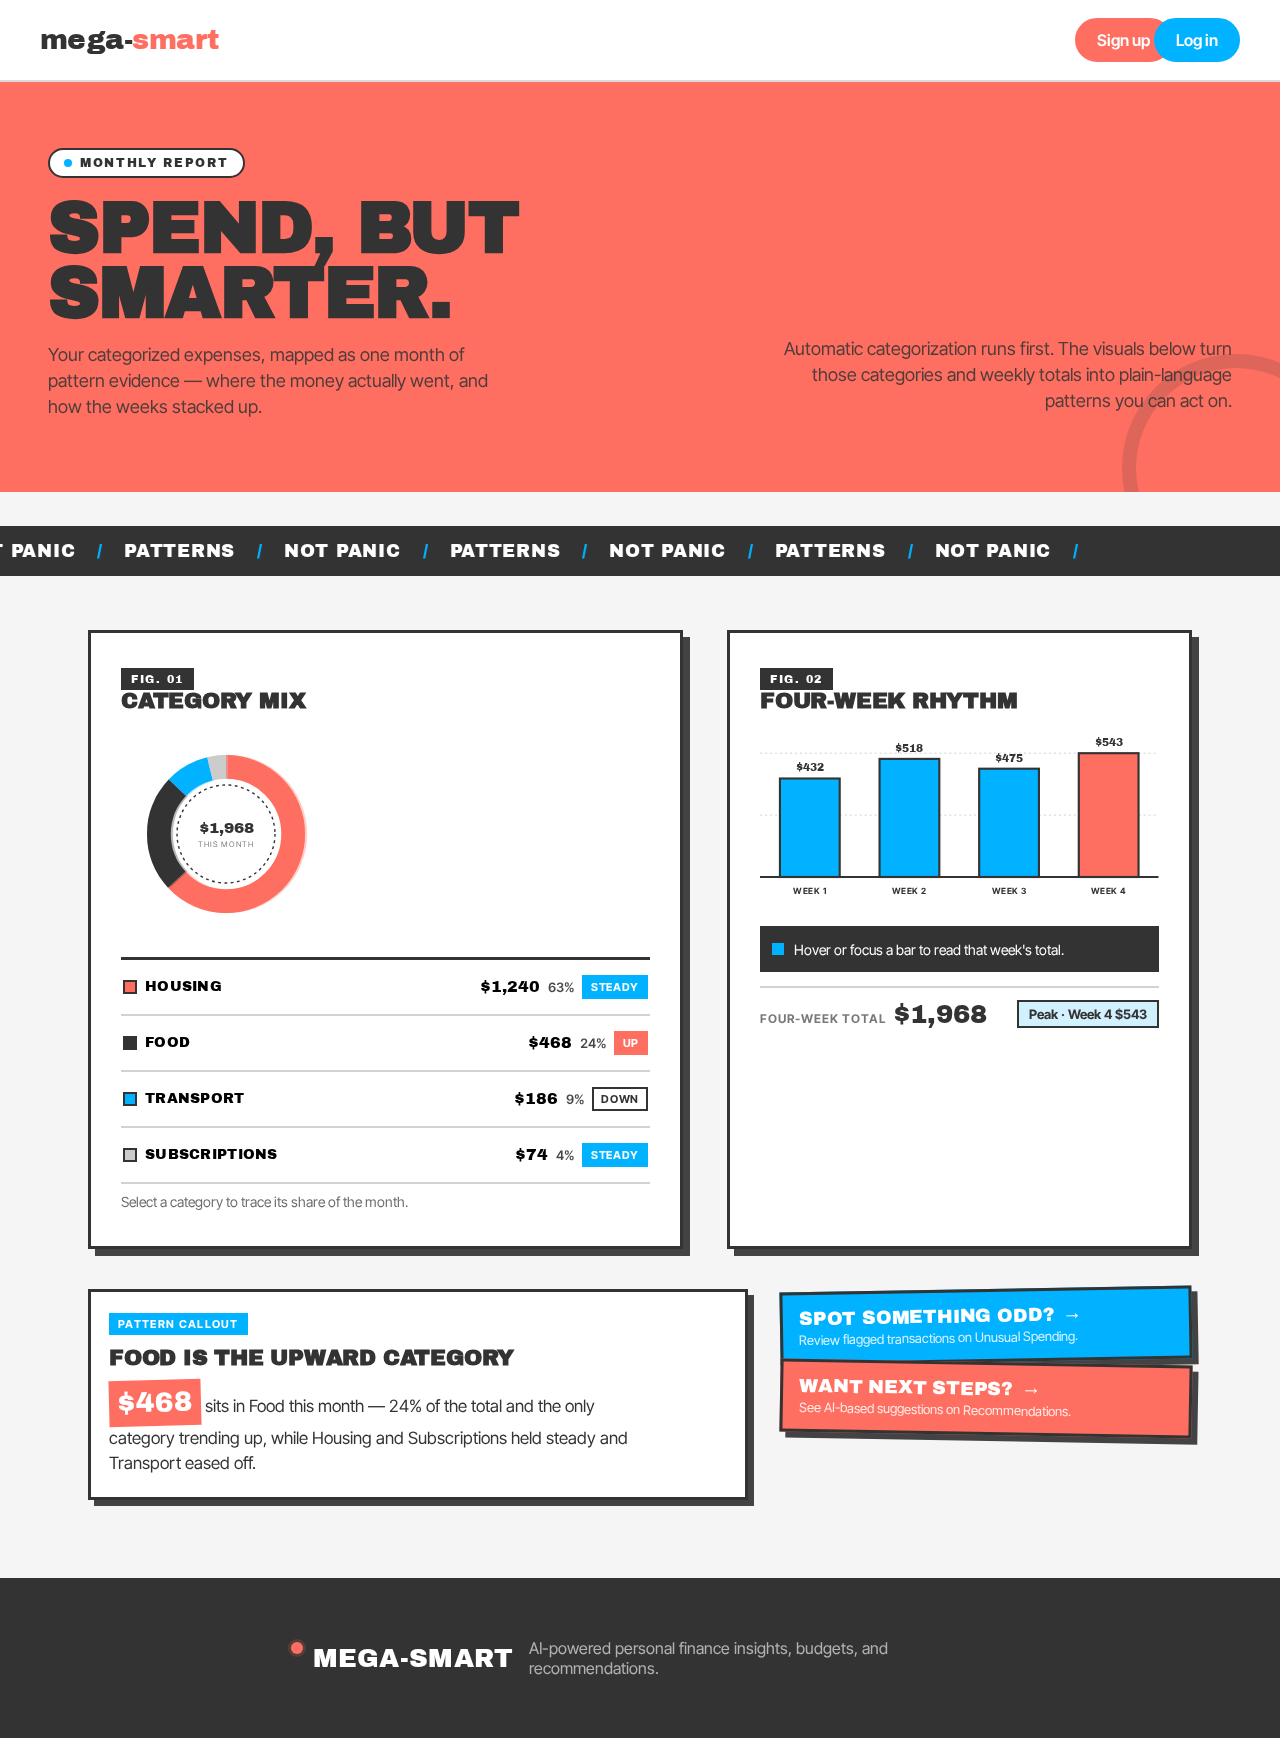
Fig. 01
Category mix
Select a category to trace its share of the month.
- Housing: $1,240, 63% share, trend steady.
- Food: $468, 24% share, trend up.
- Transport: $186, 9% share, trend down.
- Subscriptions: $74, 4% share, trend steady.
 Nency Chovatiya
i want to build smart expense analyzer Smart Expense Analyzer is an AI-powered personal finance application that analyzes a user's expenses and provides meaningful spending insights. It automatically categorizes transactions, tracks budgets, identifies unusual spending using Machine Learning (Isolation Forest), and generates simple AI-based recommendations. The system uses Python, FastAPI, SQLite, Streamlit, Pandas, Plotly, and LLMs to provide an interactive and intelligent expense-management experience.


Sign in to leave a comment
Monthly report
Your categorized expenses, mapped as one month of pattern evidence — where the money actually went, and how the weeks stacked up.
Automatic categorization runs first. The visuals below turn those categories and weekly totals into plain-language patterns you can act on.
Select a category to trace its share of the month.
$468 sits in Food this month — 24% of the total and the only category trending up, while Housing and Subscriptions held steady and Transport eased off.
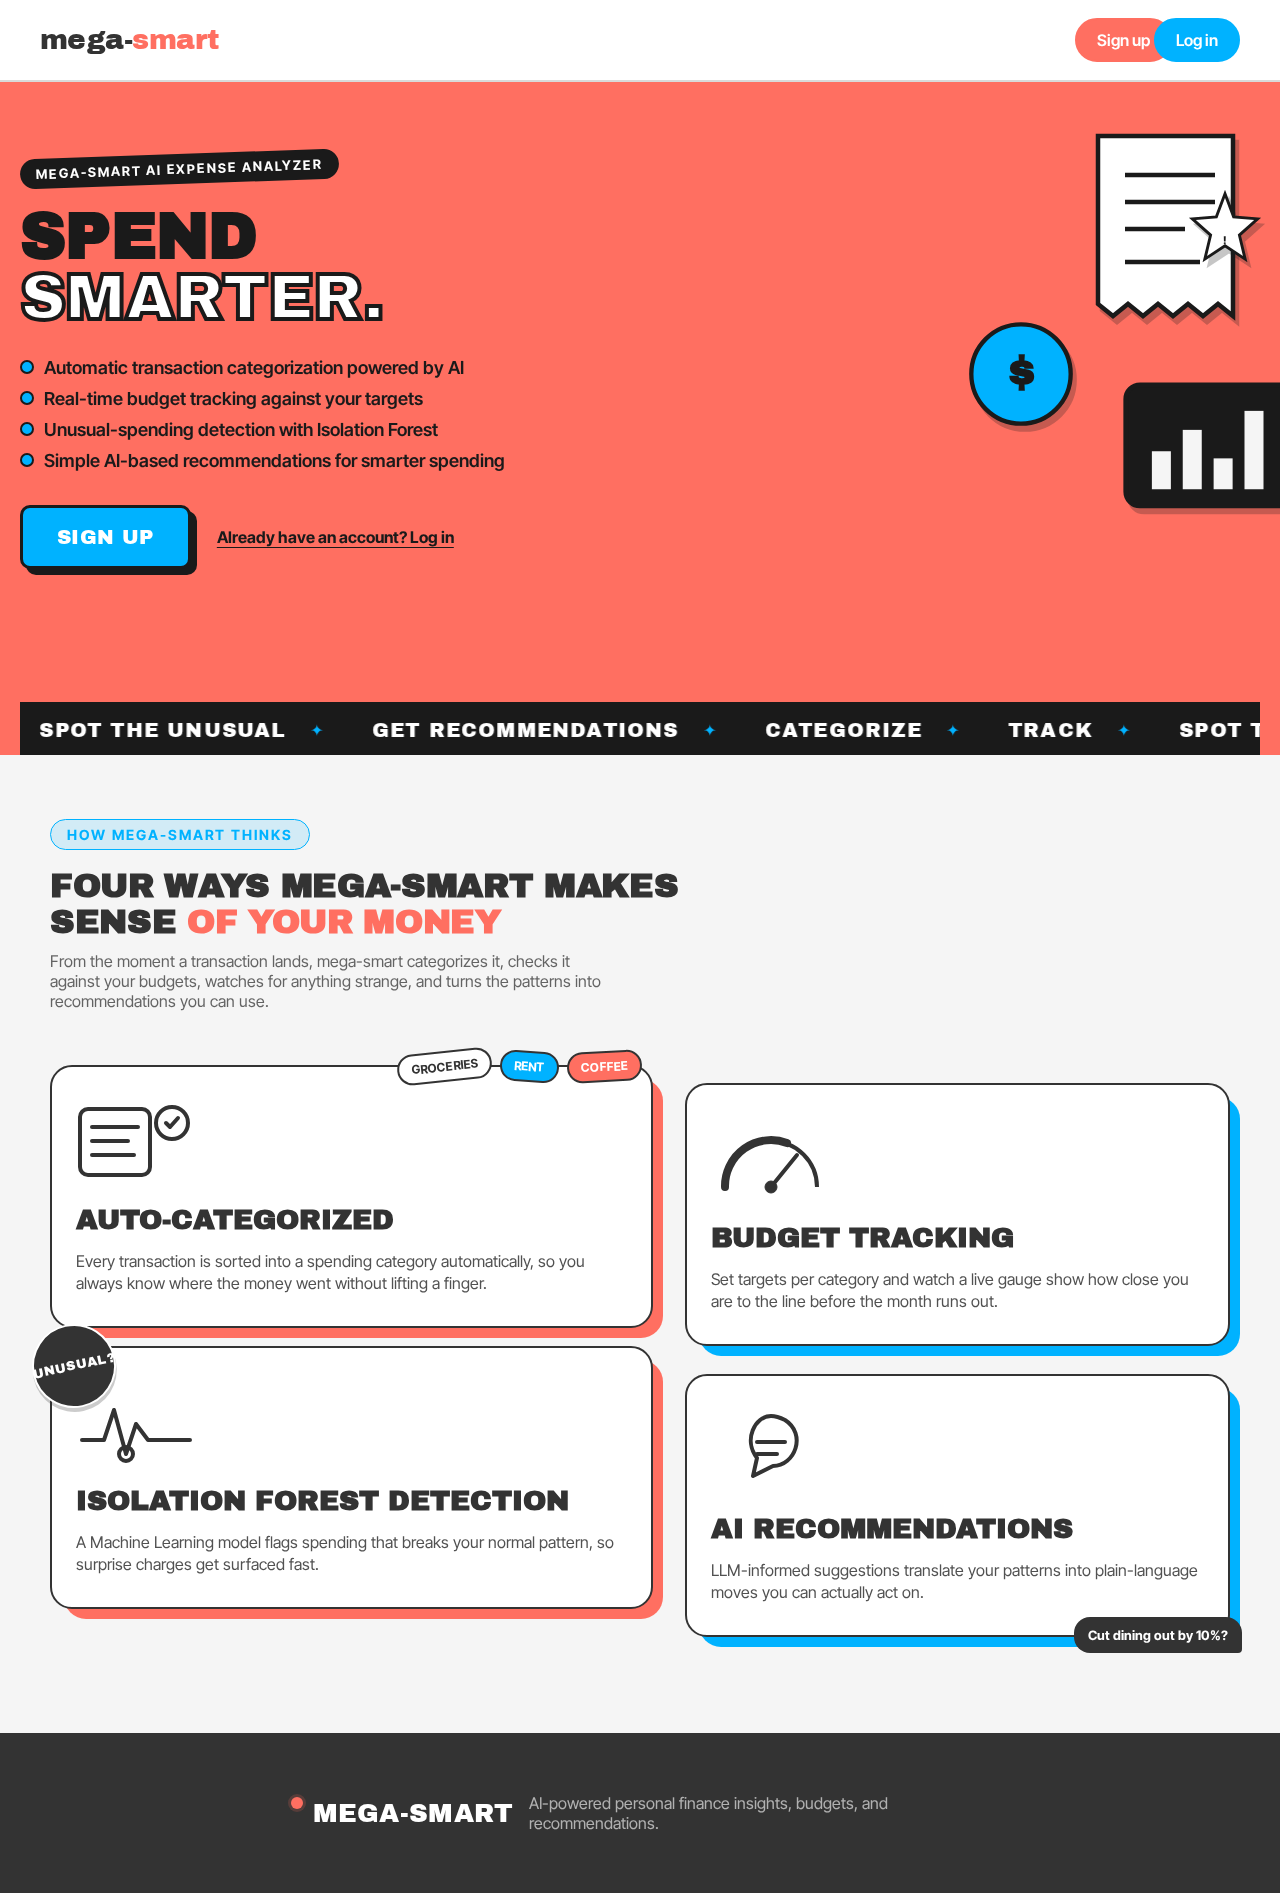
From the moment a transaction lands, mega-smart categorizes it, checks it against your budgets, watches for anything strange, and turns the patterns into recommendations you can use.
Every transaction is sorted into a spending category automatically, so you always know where the money went without lifting a finger.
Set targets per category and watch a live gauge show how close you are to the line before the month runs out.
A Machine Learning model flags spending that breaks your normal pattern, so surprise charges get surfaced fast.
LLM-informed suggestions translate your patterns into plain-language moves you can actually act on.
No comments yet. Be the first!