jungle-energy
 Midhun Kola
Energy consumption forecasting in smart buildings is a modern application of machine learning that helps predict future energy usage based on historical data and environmental conditions. With the integration of IoT sensors, smart buildings continuously collect data such as temperature, humidity, occupancy, and appliance usage. This data is analyzed using regression models to improve energy efficiency, reduce costs, and support sustainable development. 🔷 Objective The main objective of this project is to develop a regression model that can accurately predict energy consumption. This helps in: Optimizing energy usage Reducing electricity wastage Improving automation in smart systems Supporting eco-friendly solutions 🔷 Regression Model Used ✅ Random Forest Regression (Primary Model) 5 Random Forest Regression is the most suitable model for this project because energy consumption depends on multiple complex and non-linear factors. This model works by combining multiple decision trees to produce accurate predictions. ✔ Key Advantages: Handles non-linear relationships High prediction accuracy Reduces overfitting Works well with real-world datasets ✅ Multiple Linear Regression (Baseline Model) This model is used for comparison. It assumes a linear relationship between input variables and energy consumption. ✔ Limitation: Cannot capture complex patterns effectively 🔷 Methodology The project follows a systematic approach: Data Collection Data is collected from sensors or datasets containing temperature, humidity, occupancy, and energy usage. Data Preprocessing Missing values are handled, and data is normalized for better model performance. Feature Engineering Time-based features such as hour, day, and season are extracted. Model Training Random Forest and Linear Regression models are trained using historical data. Prediction The model predicts future energy consumption. Evaluation Performance is measured using MAE, MSE, and R² score. 🔷 Graph Explanation (Important Part) 6 The graph is used to visualize the performance of the regression model. 📊 Graph Details: X-axis: Time (hours/days) Y-axis: Energy Consumption (kWh) Two lines: Actual energy values Predicted energy values ✔ Interpretation: If both lines are close → Model is accurate If there is a gap → Prediction error This visualization helps in understanding trends such as peak usage times and seasonal variations. 🔷 Applications Smart homes and apartments Commercial buildings Smart cities HVAC and energy management systems 🔷 Conclusion Energy consumption forecasting using regression models is an effective way to improve energy efficiency in smart buildings. Among various models, Random Forest Regression provides the best performance due to its ability to handle complex and non-linear data. The inclusion of graphical analysis further enhances understanding and helps in evaluating model accuracy. This project contributes to reducing energy waste and promoting sustainable living.

Comments (0)
Sign in to leave a comment
System Requirements
System Requirements Document (SRD)
Project Name: jungle-energy
1. Introduction
The jungle-energy project aims to revolutionize energy consumption forecasting in smart buildings using advanced machine learning techniques and IoT sensor data. By leveraging regression models, the system predicts future energy usage based on historical data and environmental conditions, enabling users to optimize energy efficiency, reduce costs, and support sustainable development.
This document outlines the system requirements for developing a website that will serve as the primary interface for users to interact with the energy forecasting system. The website will provide insights, visualizations, and tools to help users understand and act on energy consumption trends.
The project is designed with a focus on the Indian market, taking into account local energy usage patterns, environmental factors, and sustainability goals.
2. System Overview
The jungle-energy website will act as a centralized platform for users to access energy consumption forecasts, visualize data trends, and explore the benefits of smart energy management. The system will integrate IoT sensor data, machine learning models (Random Forest Regression and Multiple Linear Regression), and interactive dashboards to deliver actionable insights.
The website will cater to a diverse audience, including building managers, sustainability experts, and smart home users, providing them with tools to monitor, analyze, and optimize energy usage.
Key features include:
- Real-time energy consumption dashboards
- Predictive analytics visualizations
- Graphs displaying temperature, humidity, occupancy, and time-based trends
- Educational content on energy forecasting and sustainability
- User-friendly interfaces for both technical and non-technical users
The system will be designed with scalability and adaptability in mind, ensuring it can be deployed across various building types, from residential apartments to commercial spaces.
3. Functional Requirements
As User:
- I should be able to view real-time energy consumption data.
- I should be able to see predictive graphs comparing actual vs. forecasted energy usage.
- I should be able to explore trends such as peak usage times, seasonal variations, temperature, humidity, and occupancy data.
- I should be able to download reports summarizing energy consumption patterns.
- I should be able to access educational content about energy forecasting and sustainability.
As Admin:
- I should be able to upload and manage IoT sensor data.
- I should be able to configure machine learning models for energy forecasting.
- I should be able to monitor system performance and user activity.
- I should be able to selectively re-run the SRD generation process to regenerate specific sections of the document.
4. User Personas
1. Building Manager
- Role: Oversees energy usage in commercial or residential buildings.
- Goals: Reduce energy costs, optimize HVAC systems, and ensure sustainability compliance.
- Needs: Access to detailed energy consumption reports and predictive analytics.
2. Sustainability Expert
- Role: Focuses on implementing eco-friendly solutions in smart buildings.
- Goals: Promote energy efficiency and reduce carbon footprints.
- Needs: Insights into energy-saving opportunities and trends.
3. Smart Home User
- Role: Individual managing energy usage in their home.
- Goals: Lower electricity bills and automate energy management.
- Needs: Simple, intuitive tools to monitor and control energy consumption.
4. Data Scientist
- Role: Develops and optimizes machine learning models for energy forecasting.
- Goals: Improve prediction accuracy and model performance.
- Needs: Access to IoT sensor data and tools for configuring and testing models.
5. Visuals Colors and Theme
The jungle-energy website will feature a modern, eco-friendly design inspired by nature and technology. The color palette reflects sustainability and energy efficiency while maintaining a professional aesthetic.
Color Palette:
- Background: #F3F7F0 (Soft Mint Green)
- Surface: #D9E8D4 (Muted Olive Green)
- Text: #2A2E37 (Charcoal Gray)
- Accent: #4CAF50 (Lush Forest Green)
- Muted Tones: #A9B7C0 (Cool Gray)
6. Signature Design Concept
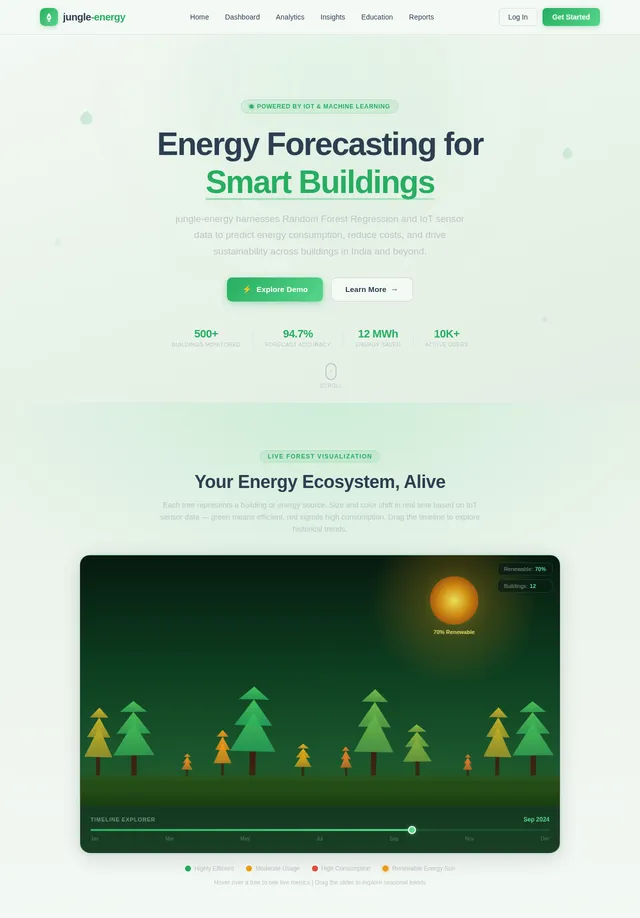
Interactive Energy Forest with Real-Time Data Integration
The homepage will feature a 3D interactive forest that represents energy consumption data. Each tree in the forest symbolizes a building or a specific energy source, with its size and color dynamically changing based on real-time energy usage and efficiency.
-
Visuals:
- Trees grow taller and greener with efficient energy use.
- Trees shrink and turn red during periods of high energy consumption.
- A glowing sun in the background represents renewable energy contributions, changing intensity based on the percentage of renewable energy used.
-
Data Integration:
- Temperature, humidity, and occupancy data will be visualized as overlays on the forest. For example, hovering over a tree will display a tooltip with these metrics alongside energy usage.
- A timeline slider allows users to view changes in energy consumption and environmental conditions over time.
-
Interactions:
- Users can click on individual trees to view detailed energy usage and predictions for that building or source.
- Hovering over a tree displays a tooltip with key metrics (e.g., current usage, forecasted usage, efficiency score, temperature, humidity, and occupancy).
-
Animations:
- Smooth transitions as trees grow or shrink.
- Subtle wind animations to give the forest a dynamic, living feel.
- Real-time updates to the forest as new data is received from IoT sensors.
This concept not only provides a visually stunning first impression but also reinforces the project's focus on sustainability and energy management.
7. Non-Functional Requirements
- Performance: The website must load within 3 seconds for users on a 4G connection.
- Scalability: The system should handle up to 10,000 concurrent users.
- Security: All data must be encrypted in transit and at rest.
- Accessibility: The website must comply with WCAG 2.1 Level AA standards.
- Localization: The website should support multiple languages, starting with English and Hindi.
- Selective Re-run Capability: The system must allow admins to selectively regenerate specific sections of the SRD without affecting the entire document.
8. Tech Stack
Frontend:
- React for Web
Backend:
- Python
- FastAPI
Database:
- MySQL (with Alembic for migrations)
AI Models:
- GPT 5.4 for user-friendly responses
- Claude 4.6 Opas for academic or coding work
AI Tools:
- Litellm for LLM Routing
- Langchain
Orchestration:
- Docker
- Kubernetes
9. Assumptions and Constraints
- IoT sensors will provide accurate and real-time data for energy consumption, temperature, humidity, and occupancy.
- The system will initially focus on buildings in India, considering local energy usage patterns and regulations.
- The website will be optimized for desktop and mobile devices.
- The selective re-run capability will be limited to authorized admin users.
10. Glossary
- IoT (Internet of Things): A network of interconnected devices that collect and exchange data.
- Regression Model: A statistical technique used to predict a dependent variable based on one or more independent variables.
- Random Forest Regression: A machine learning model that combines multiple decision trees to improve prediction accuracy.
- MAE (Mean Absolute Error): A metric used to measure the average magnitude of errors in a set of predictions.
- MSE (Mean Squared Error): A metric that measures the average squared difference between predicted and actual values.
- R² Score: A statistical measure that indicates how well a model fits the data.
- Selective Re-run Capability: A feature allowing admins to regenerate specific sections of the SRD without affecting the entire document.

Revolutionize Energy Consumption with AI-Powered Forecasting
Smart insights for sustainable buildings. Harness machine learning and IoT data to predict, optimize, and reduce energy consumption across your entire portfolio.
Explore the Energy Forest
Each tree represents a building in the grid. Size and color reflect energy efficiency — hover or tap to see real-time metrics, forecasts, and efficiency scores.
Real-Time Environmental & Energy Graphs
Track temperature, humidity, occupancy patterns, and time-based energy trends with interactive visualizations powered by live IoT sensor data.
Temperature
28.5°C
↑ +2.1°Humidity
52%
↓ -8%Occupancy
84%
↑ +12%Peak Hour
2–4 PM
↔ ConsistentTemperature Trend
Humidity Levels
Occupancy Pattern
Energy: Actual vs Forecast
Weekly Energy Usage Heatmap
Factor Impact on Energy Consumption
Smart Energy Management, Simplified
Harness the power of IoT sensors and machine learning to transform how you monitor, predict, and optimize energy consumption.
Real-Time Insights
Monitor energy consumption across all your buildings with live dashboards. Track usage patterns, detect anomalies, and make data-driven decisions as they happen.
Learn more→Predictive Analytics
Leverage advanced ML models to forecast future energy demand. Compare actual vs. predicted usage and stay ahead of peak consumption periods with actionable forecasts.
Learn more→Cost Savings
Reduce operational costs by up to 35% through intelligent energy optimization. Identify waste, automate efficiency controls, and maximize your sustainability ROI.
Learn more→Everything You Need for Smarter Energy Management
Powerful tools designed to help you monitor, predict, and optimize energy consumption across every building in your portfolio.
Real-Time Dashboards
Monitor live energy consumption across all your buildings with intuitive, data-rich dashboards updated every second from IoT sensor feeds.
Learn More→Predictive Graphs
Compare actual vs. forecasted energy usage with AI-powered predictive models built on Random Forest and Multiple Linear Regression.
Learn More→Trend Analysis
Explore peak usage times, seasonal variations, and consumption anomalies to uncover hidden patterns in your energy data.
Learn More→Report Generation
Download comprehensive reports summarizing energy consumption patterns, savings opportunities, and sustainability compliance metrics.
Learn More→Educational Hub
Access curated content on energy forecasting, sustainability best practices, and smart building technologies for all expertise levels.
Learn More→Multi-Building Support
Manage and compare energy performance across residential, commercial, and industrial buildings from a single unified platform.
Learn More→How It Works
From Sensors to Savings in Five Steps
Our end-to-end pipeline transforms raw IoT data into actionable energy insights, helping you cut costs and carbon emissions.
Deploy smart sensors across your building infrastructure to capture temperature, humidity, occupancy, and energy draw from every zone in real time.
Streaming data pipelines aggregate sensor readings into a unified time-series store, normalizing inputs for immediate analysis and model consumption.
Random Forest Regression and Multiple Linear Regression models process historical patterns alongside live data to generate accurate energy forecasts.
Interactive dashboards render forecast vs. actual comparisons, trend overlays, and anomaly highlights so you can spot opportunities at a glance.
Act on AI-driven recommendations to schedule HVAC loads, shift peak demand, and reduce consumption — cutting costs while lowering your carbon footprint.
Connect IoT Sensors
Deploy smart sensors across your building infrastructure to capture temperature, humidity, occupancy, and energy draw from every zone in real time.
Ingest Real-Time Data
Streaming data pipelines aggregate sensor readings into a unified time-series store, normalizing inputs for immediate analysis and model consumption.
Run ML Models
Random Forest Regression and Multiple Linear Regression models process historical patterns alongside live data to generate accurate energy forecasts.
Visualize Predictions
Interactive dashboards render forecast vs. actual comparisons, trend overlays, and anomaly highlights so you can spot opportunities at a glance.
Optimize Energy
Act on AI-driven recommendations to schedule HVAC loads, shift peak demand, and reduce consumption — cutting costs while lowering your carbon footprint.
Who Is Jungle-Energy For?
Our platform is designed for everyone involved in smart energy management — from facility operators to individual homeowners.
Building Manager
Commercial & Residential Operations
Key Goals
- ✓Reduce energy costs across managed properties
- ✓Optimize HVAC systems for peak efficiency
- ✓Ensure sustainability compliance and reporting
What They Need
Access to detailed energy consumption reports, predictive analytics dashboards, and real-time alerts for anomalies across multiple buildings.
Sustainability Expert
Eco-Friendly Solutions Specialist
Key Goals
- ✓Promote energy efficiency in smart buildings
- ✓Reduce organizational carbon footprints
- ✓Implement data-driven green initiatives
What They Need
Deep insights into energy-saving opportunities, trend analysis for environmental impact, and tools to benchmark sustainability performance.
Smart Home User
Residential Energy Consumer
Key Goals
- ✓Lower monthly electricity bills
- ✓Automate home energy management
- ✓Understand personal consumption patterns
What They Need
Simple, intuitive tools to monitor and control energy consumption with clear visualizations and actionable recommendations.
System Administrator
Platform & Data Management
Key Goals
- ✓Manage IoT sensor data pipelines
- ✓Configure and tune ML forecasting models
- ✓Monitor system performance and uptime
What They Need
Robust admin dashboard with data upload capabilities, model configuration interfaces, and comprehensive system health monitoring.
Trusted by Building Managers Worldwide
See how energy professionals and sustainability leaders are transforming their buildings with jungle-energy.
Driving Sustainable Energy Transformation
Measurable results from deploying machine learning-powered energy forecasting across smart buildings
10,000+
Buildings Monitored
Smart buildings across India equipped with IoT sensors and real-time tracking
2.5M
Tons CO₂ Prevented
Carbon emissions reduced through intelligent energy optimization and forecasting
35%
Avg Energy Savings
Average reduction in energy consumption using our Random Forest regression models
99.9%
Platform Uptime
Reliable infrastructure ensuring continuous monitoring and uninterrupted data flow
Every Kilowatt Saved Is a Step Towards Sustainability
Jungle Energy empowers smart buildings to reduce their carbon footprint through AI-driven forecasting, real-time monitoring, and actionable energy insights.
How Jungle Energy Reduces Your Carbon Footprint
From data collection to measurable savings in four steps
IoT Sensors Collect
Temperature, humidity, occupancy & usage data
ML Models Analyze
Random Forest & regression predictions
Forecasts Generated
Actual vs. predicted comparisons
Energy Optimized
Automated efficiency recommendations
Up to 35% Savings
Average energy reduction across monitored buildings
Ready to Transform Your Energy Management?
Join thousands of building managers and sustainability experts who are cutting energy costs by up to 35% with AI-powered forecasting. Start optimizing your energy consumption today.
No comments yet. Be the first!