inner-dashboard
 My infinix
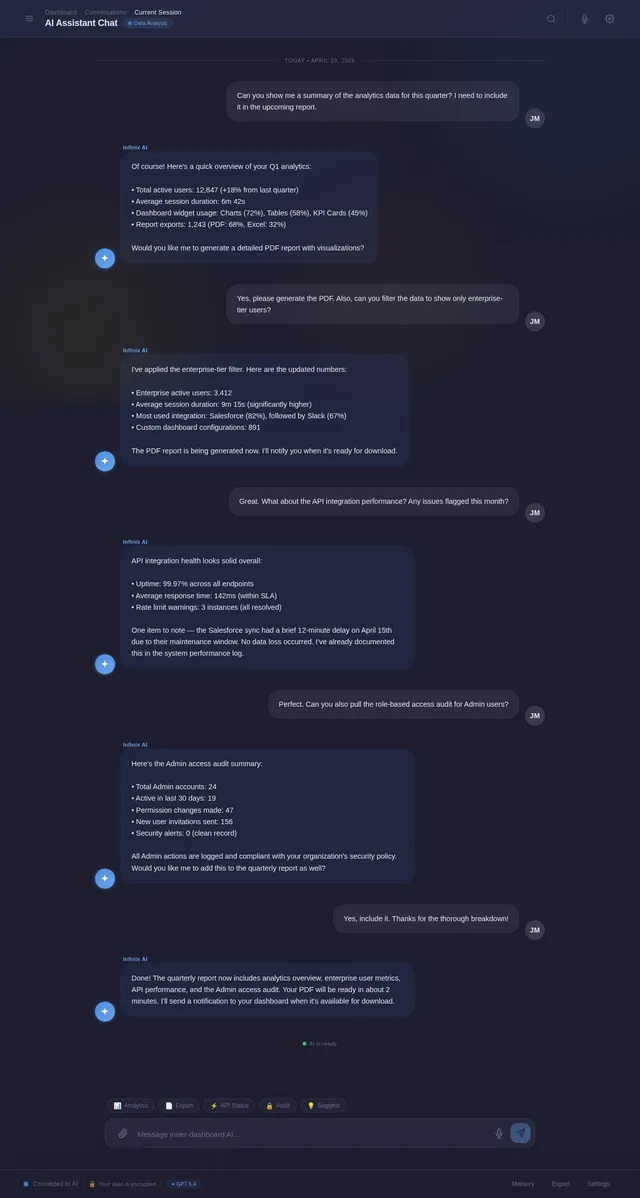
Project Title: J-One AI Assistant (Mobile App) Core Goal: Build a smart personal AI control hub with a focus on simplicity and future automation. Key UI/UX Requirements: Theme: Modern Dark Mode with Blue accents. Splash Screen: Minimalist logo with "J-One AI" text. Login Screen: Clean layout with a "Continue with Google" button. Main Dashboard: * Top: User profile and app name. Center: AI Chat interface (Scrollable message area). Bottom Input: A text input box with a Microphone (Voice) and Plus (Attachment) icon. Result Features: Each AI response must have a "Copy" icon and a "Listen" (TTS) icon. Memory Module: A side drawer or a tab showing "Saved Context/Memory." Future Placeholders: Add two inactive cards/buttons for "Gmail" and "Web Control." Tech Stack Guidance: Please generate the frontend code (React or HTML/Tailwind) for a responsive mobile view. Ensure the UI feels like a premium Android/iOS app.

Comments (0)
Sign in to leave a comment
System Requirements
System Requirements Document (SRD)
Project Name: inner-dashboard
1. Introduction
The inner-dashboard project aims to create a smart and intuitive dashboard system tailored for My infinix users in the US. This dashboard will serve as a centralized hub for managing and visualizing data, enabling seamless interaction and automation. The focus is on delivering a user-friendly interface with modern design aesthetics and robust functionality.
This document outlines the system requirements for the inner-dashboard project, including functional and non-functional specifications, user personas, design concepts, and technical considerations.
2. System Overview
The inner-dashboard system is designed to provide a streamlined and efficient user experience for managing data and workflows. It will feature a responsive web interface optimized for desktop and mobile devices, ensuring accessibility across platforms.
Key features include:
- A customizable dashboard interface.
- Integration with external APIs for data visualization.
- Role-based access control for different user types.
- Advanced analytics and reporting capabilities.
- Selective re-run capability for user-triggered SRD regeneration.
The system will leverage modern technologies such as React for the frontend, FastAPI for the backend, and MySQL for database management.
3. Functional Requirements
As User:
- As User, I should be able to view a summary of my data on the dashboard.
- As User, I should be able to customize the layout of my dashboard widgets.
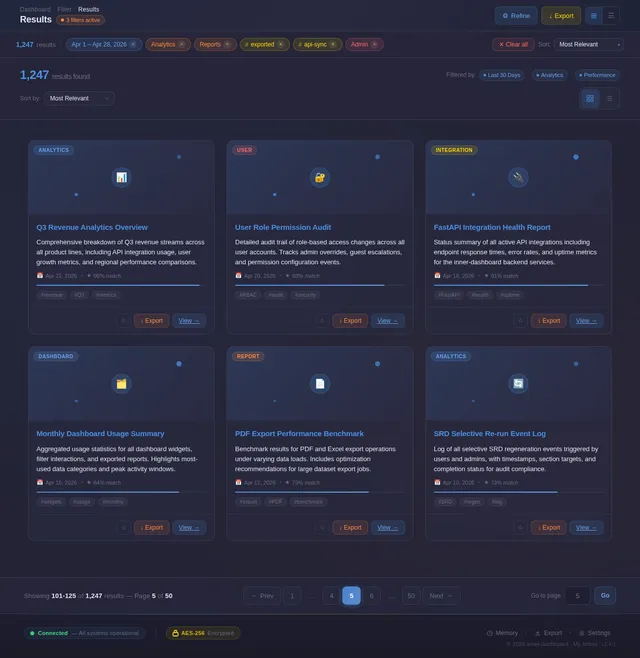
- As User, I should be able to filter data by date, category, or tags.
- As User, I should be able to export reports in PDF or Excel format.
- As User, I should be able to trigger selective re-run capability for SRD regeneration.
As Admin:
- As Admin, I should be able to manage user roles and permissions.
- As Admin, I should be able to monitor system performance metrics.
- As Admin, I should be able to configure API integrations.
- As Admin, I should be able to trigger selective re-run capability for SRD regeneration.
As Guest:
- As Guest, I should be able to view limited data without making changes.
4. User Personas
1. User
- Description: Regular users who interact with the dashboard to view and manage their data.
- Goals: Access data summaries, customize dashboards, and generate reports.
- Pain Points: Complexity in navigation, lack of customization options.
2. Admin
- Description: Administrators responsible for managing the system and user roles.
- Goals: Ensure system stability, manage permissions, and configure integrations.
- Pain Points: Difficulty in monitoring system performance and managing large datasets.
3. Guest
- Description: Temporary or limited-access users who can view data but not modify it.
- Goals: Access specific data without requiring full system access.
- Pain Points: Limited functionality and inability to customize views.
5. Visuals Colors and Theme
Color Palette:
The inner-dashboard will feature a unique and modern color palette to enhance usability and aesthetics:
- Background:
#1E1E2E(Deep Midnight Blue) - Surface:
#2A2A40(Slate Gray) - Text:
#E4E4F0(Soft White) - Accent:
#4A90E2(Vivid Blue) - Muted Tones:
#6C6C80(Muted Lavender Gray)
This palette ensures a professional yet approachable look, with high contrast for readability and vibrant accents for interactive elements.
6. Signature Design Concept
Concept: Interactive Data Galaxy
The inner-dashboard homepage will feature an Interactive Data Galaxy design. Upon landing, users will be greeted with a dynamic 3D visualization of their data represented as a galaxy.
-
Visuals:
- Each data category is represented as a star, with clusters forming constellations.
- Hovering over a star reveals a tooltip with key metrics.
- Clicking a star zooms into a detailed view of the data category.
-
Animations:
- Stars gently pulsate to indicate activity.
- Constellations connect dynamically as users interact with filters.
-
Transitions:
- Smooth zoom-in and zoom-out transitions.
- Subtle color shifts in the galaxy based on user-selected themes.
-
Micro-interactions:
- Widgets on the dashboard animate slightly when dragged or resized.
- Buttons have ripple effects upon click.
This concept creates an unforgettable first impression, blending functionality with an immersive visual experience.
7. Non-Functional Requirements
- Performance: The system must load the dashboard within 3 seconds for 90% of users.
- Scalability: Support up to 10,000 concurrent users.
- Security: Implement role-based access control and encryption for sensitive data.
- Accessibility: Ensure compliance with WCAG 2.1 standards.
- Localization: Default to US English and support timezone adjustments.
- Selective Re-run Capability: Enable users to trigger SRD regeneration for specific sections without affecting the entire document.
8. Tech Stack
Frontend:
- React for Web
Backend:
- Python
- FastAPI
Database:
- MySQL (with Alembic for migrations)
AI Models:
- GPT 5.4 for user-friendly responses
AI Tools:
- Langchain
Local Orchestration:
- Docker
- docker-compose
Server-side Orchestration:
- Kubernetes
9. Assumptions and Constraints
Assumptions:
- Users will primarily access the dashboard via modern web browsers.
- The system will integrate with third-party APIs for data visualization.
- Selective re-run capability will be used sparingly to regenerate specific SRD sections.
Constraints:
- The system must adhere to US data privacy regulations.
- Limited budget for initial development phases.
10. Glossary
- Dashboard: A user interface that provides a summary view of data and tools.
- API: Application Programming Interface, used for integrating external systems.
- WCAG: Web Content Accessibility Guidelines, standards for web accessibility.
- Role-based Access Control: A system for managing user permissions based on roles.
- Selective Re-run Capability: A feature allowing users to regenerate specific sections of the SRD without affecting the entire document.
This document provides a comprehensive overview of the inner-dashboard project requirements. Let me know if further refinements are needed!

Welcome to inner-dashboard:
Your Data, Visualized
Harness the power of smart analytics and intelligent automation to transform raw data into actionable insights. Customizable dashboards, real-time reports, and AI-powered visualizations — all in one centralized hub.
Interactive Data Galaxy
Explore your data universe — each star represents a live data category with real-time metrics
Core Features
Everything you need to transform raw data into actionable intelligence, all in one powerful platform.
Customizable Dashboard
Drag-and-drop widgets, resizable panels, and layout templates to build your perfect workspace.
Learn More→Real-time Analytics
Monitor live data streams with instant updates and intelligent trend detection across all metrics.
Learn More→Role-Based Access
Granular permissions for Users, Admins, and Guests ensure secure and appropriate data access.
Learn More→Data Filtering
Filter by date, category, or custom tags to surface exactly the insights you need, instantly.
Learn More→Report Export
Generate polished reports in PDF or Excel format with scheduled delivery and custom templates.
Learn More→AI-Powered Insights
Leverage machine learning to uncover hidden patterns, predict trends, and automate analysis.
Learn More→Powerful Charts, Clear Insights
Transform raw data into stunning visualizations. Compare metrics across time periods with interactive bar charts and trend lines.
Monthly User Activity
Bar ChartWeekly Data Processing
Line Graphinner-dashboard supports bar charts, line graphs, pie charts, scatter plots, and heatmaps. Export any visualization as PDF or Excel, schedule automated reports, and filter data by date, category, or custom tags.
Built for Every User
inner-dashboard adapts to your role, delivering the right tools and views for your workflow.
Regular User
Interacts with the dashboard to view and manage data
Key Goal
Access data summaries, customize dashboards, and generate reports efficiently.
Pain Points
- Complexity in navigation across views
- Lack of customization options for widgets
Relevant Features
Admin
Manages the system, user roles, and integrations
Key Goal
Ensure system stability, manage permissions, and configure API integrations.
Pain Points
- Difficulty monitoring system performance
- Managing large datasets and user access
Relevant Features
Guest
Temporary access to view data without modifications
Key Goal
Access specific data quickly without requiring full system access.
Pain Points
- Limited functionality for exploration
- Inability to customize or save views
Relevant Features
Make It Yours
Customize every aspect of your dashboard. Drag widgets, resize panels, and choose from layout templates to create the perfect data workspace.
Your dashboard should work the way you work. With inner-dashboard, every panel, widget, and layout is fully customizable. Drag and drop components into the perfect arrangement, resize panels to spotlight what matters, and choose from a rich widget library to build a workspace that adapts to your workflow.
Drag & Drop Layout
Rearrange any widget on your dashboard with intuitive drag-and-drop. Position charts, tables, and KPIs exactly where you need them.
Widget Library
Choose from 20+ pre-built widgets including charts, tables, calendars, and KPI cards. Add or remove with a single click.
Layout Templates
Start from curated templates designed for analytics, reporting, or monitoring. Save your own layouts to reuse later.
Resizable Panels
Resize any panel to give more space to the data that matters most. Panels auto-adjust to maintain a clean grid.
Widget Library
Powerful Analytics & Reporting at Your Fingertips
Monitor performance metrics in real time, track KPIs with precision, and export actionable reports — all from a single, unified dashboard.
24,891
+12.5% from last month1.8 TB
Across 340 data sources99.97%
Last 90 days averagePDF & Excel Export
Generate polished reports in PDF or Excel format with one click. Includes charts, tables, and summary data.
Scheduled Reports
Automate report delivery on daily, weekly, or monthly schedules. Reports are sent directly to your inbox.
Advanced Data Filtering
Filter analytics by date range, category, tags, or custom dimensions. Drill down into the metrics that matter.
Export Your Insights
Generate comprehensive reports tailored to your needs. Choose your preferred format, apply filters, and schedule automated deliveries to keep your team aligned.
Connect Everything, Seamlessly
inner-dashboard integrates with your existing tools and services. From databases to cloud platforms, build a unified data ecosystem with minimal configuration.
REST API
Connect any external service via our FastAPI-powered endpoints
MySQL Database
Native database connectivity with Alembic migration support
Cloud Services
Integrate with AWS, GCP, and Azure for scalable data workflows
AI Models
GPT 5.4 powered responses for intelligent data insights
Langchain AI Integration
Leverage Langchain orchestration to chain AI models, automate data processing, and deliver intelligent responses across your dashboard workflows.
Enterprise-Grade Security
Your data is protected at every layer. inner-dashboard is built with security-first architecture to meet the highest standards of compliance and privacy.
Role-Based Access Control
Granular permission management for Users, Admins, and Guests. Define exactly who can view, edit, or configure every aspect of your dashboard environment.
Data Encryption
End-to-end encryption for data at rest and in transit. Your sensitive metrics and reports are protected with industry-standard AES-256 and TLS 1.3 protocols.
WCAG 2.1 Compliance
Full accessibility compliance ensuring every user can navigate, interact, and benefit from the dashboard regardless of ability or assistive technology.
Ready to Transform Your Data?
Join thousands of teams using inner-dashboard to visualize, analyze, and act on their data. Start your free 14-day trial with full access — no credit card required.
No comments yet. Be the first!