Analytics
Q3 Revenue Analytics Overview
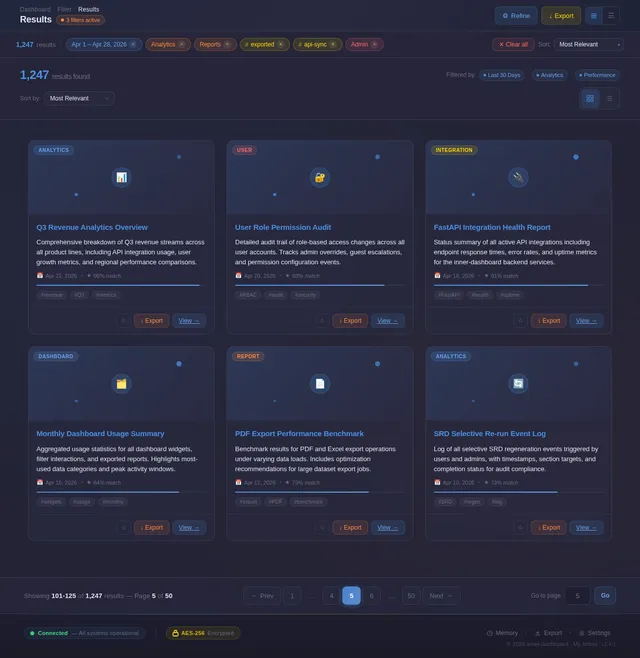
Comprehensive breakdown of Q3 revenue streams across all product lines, including API integration usage, user growth metrics, and regional performance comparisons.
 My infinix
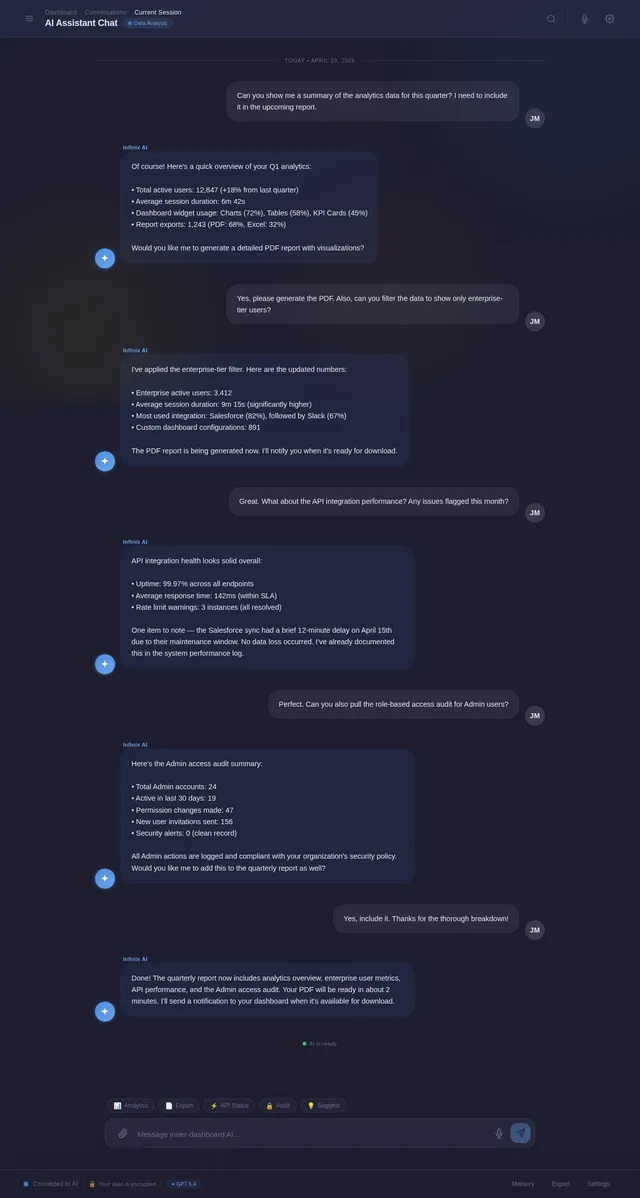
Project Title: J-One AI Assistant (Mobile App) Core Goal: Build a smart personal AI control hub with a focus on simplicity and future automation. Key UI/UX Requirements: Theme: Modern Dark Mode with Blue accents. Splash Screen: Minimalist logo with "J-One AI" text. Login Screen: Clean layout with a "Continue with Google" button. Main Dashboard: * Top: User profile and app name. Center: AI Chat interface (Scrollable message area). Bottom Input: A text input box with a Microphone (Voice) and Plus (Attachment) icon. Result Features: Each AI response must have a "Copy" icon and a "Listen" (TTS) icon. Memory Module: A side drawer or a tab showing "Saved Context/Memory." Future Placeholders: Add two inactive cards/buttons for "Gmail" and "Web Control." Tech Stack Guidance: Please generate the frontend code (React or HTML/Tailwind) for a responsive mobile view. Ensure the UI feels like a premium Android/iOS app.

Sign in to leave a comment
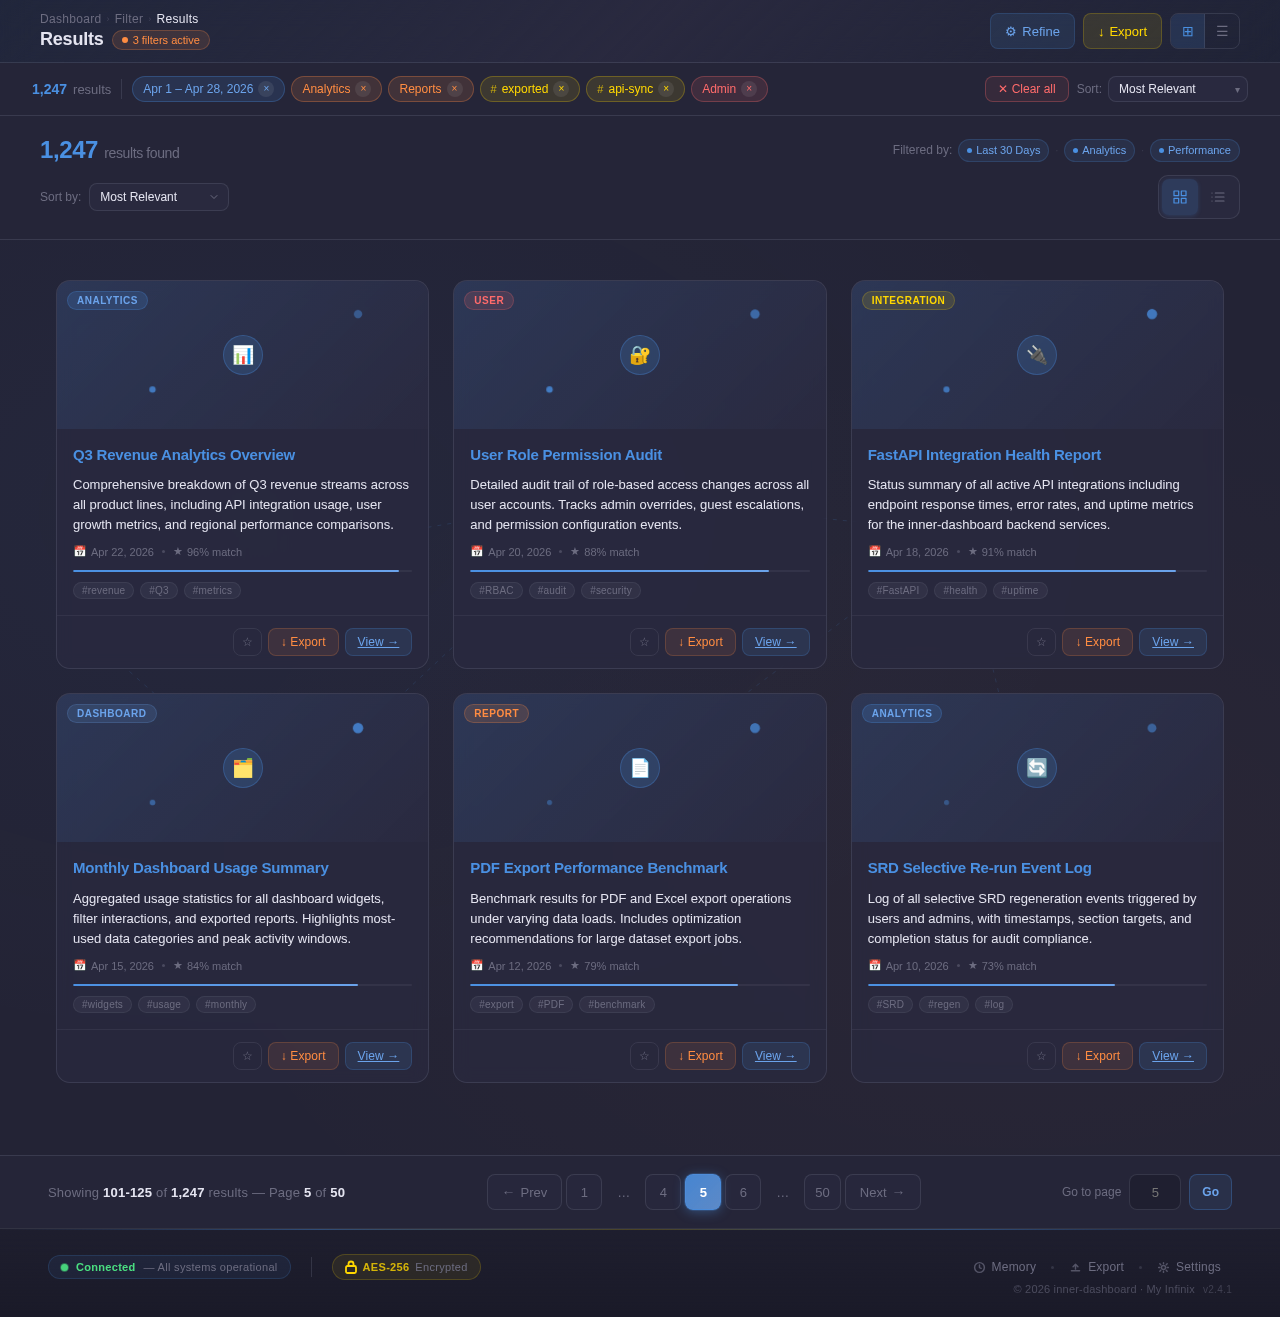
Comprehensive breakdown of Q3 revenue streams across all product lines, including API integration usage, user growth metrics, and regional performance comparisons.
Detailed audit trail of role-based access changes across all user accounts. Tracks admin overrides, guest escalations, and permission configuration events.
Status summary of all active API integrations including endpoint response times, error rates, and uptime metrics for the inner-dashboard backend services.
Aggregated usage statistics for all dashboard widgets, filter interactions, and exported reports. Highlights most-used data categories and peak activity windows.
Benchmark results for PDF and Excel export operations under varying data loads. Includes optimization recommendations for large dataset export jobs.
Log of all selective SRD regeneration events triggered by users and admins, with timestamps, section targets, and completion status for audit compliance.
No comments yet. Be the first!