grand-hi
 jifar boy
Hi
Comments (0)
Sign in to leave a comment
System Requirements
System Requirements Document (SRD)
1. Introduction
This document outlines the system requirements for an enterprise-level mill management dashboard. The dashboard will serve as an all-in-one solution for tracking operations, inventory, and other critical aspects of mill management. The focus is on creating a dynamic, user-friendly interface with real-time updates and visualizations to enhance operational efficiency.
2. System Overview
The mill management dashboard will be a web-based application designed to provide a centralized platform for monitoring and managing mill operations. The system will include features such as inventory tracking, operational analytics, and real-time updates. The dashboard will be built using HTML, CSS, and JavaScript, with dynamic features powered by libraries like Chart.js for data visualization.
3. Functional Requirements as Story Points
- As a User, I should be able to view a real-time dashboard displaying key mill metrics (e.g., production rate, inventory levels, and downtime).
- As a User, I should be able to interact with dynamic charts and graphs that update in real-time.
- As a User, I should be able to filter data by date, product type, or operational unit.
- As a User, I should be able to receive alerts for critical issues such as low inventory or equipment malfunctions.
- As a User, I should be able to export reports in PDF or Excel format.
- As a User, I should be able to customize the layout of the dashboard to suit my preferences.
- As an Admin, I should be able to manage user roles and permissions.
- As an Admin, I should be able to configure system settings such as alert thresholds and data refresh intervals.
4. User Personas
- Admin: Responsible for managing user roles, permissions, and system configurations.
- User: Regular user of the dashboard, focused on monitoring operations and making data-driven decisions.
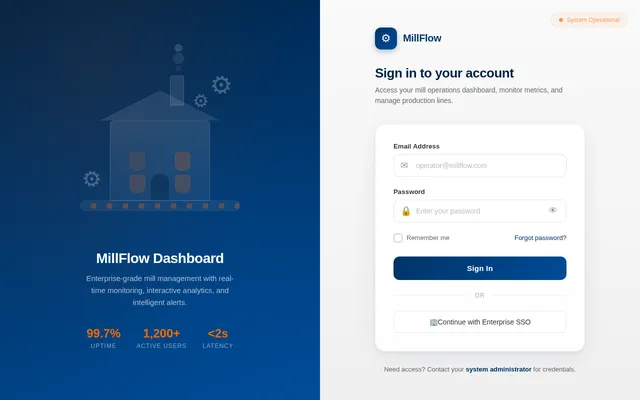
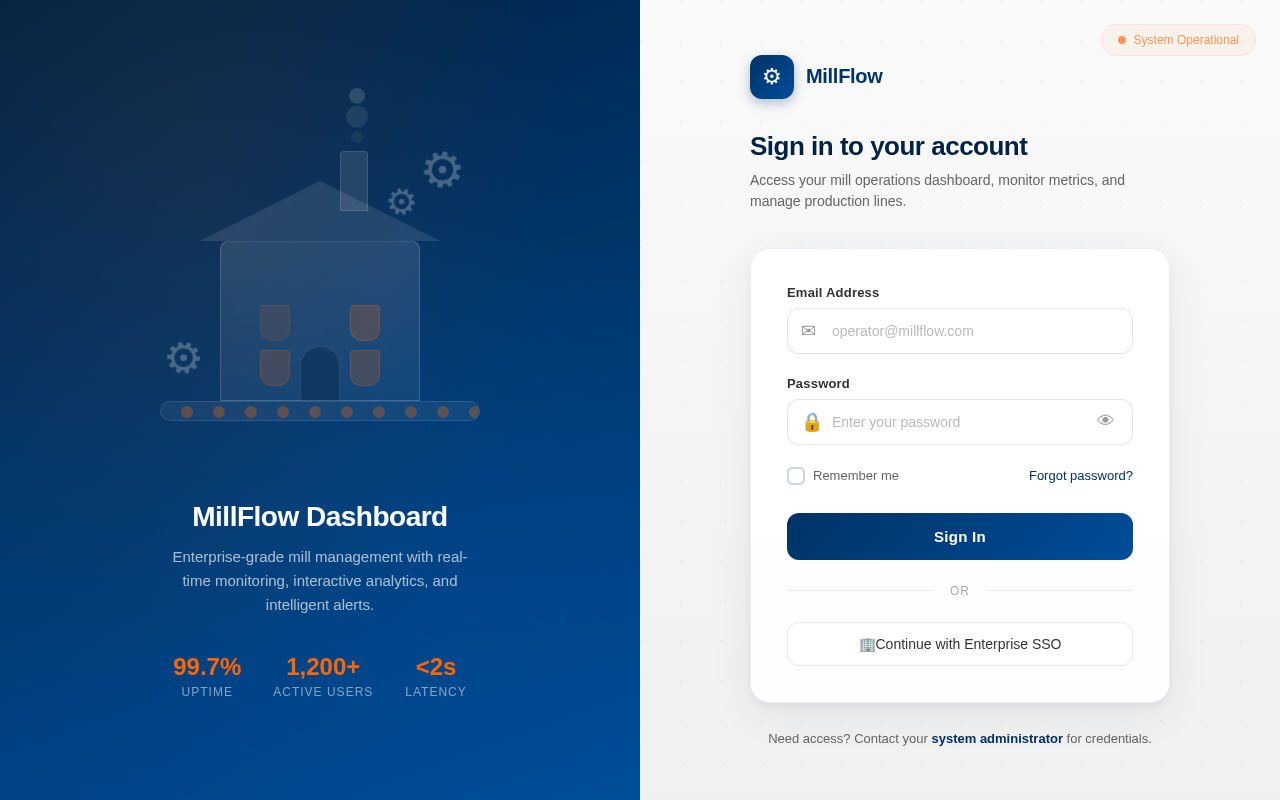
5. Visuals Colors and Theme
The dashboard will use a clean and professional color scheme to ensure readability and usability:
- Primary Color: Deep Blue (#003366) for headers and key elements.
- Secondary Color: Light Gray (#F5F5F5) for backgrounds.
- Accent Color: Bright Orange (#FF6600) for alerts and highlights.
- Text Color: Dark Gray (#333333) for primary text and White (#FFFFFF) for text on dark backgrounds.
The theme will focus on a modern, flat design with subtle shadows and gradients to create depth without overwhelming the user.
6. Signature Design Concept
Interactive Mill Visualization with Dynamic Data Overlays
The homepage of the dashboard will feature a 3D interactive mill model. Users will see a digital representation of the mill, complete with animated machinery and operational units. Each section of the mill (e.g., production line, storage area, packaging unit) will be clickable, allowing users to drill down into specific data for that area.
Key Features:
- Hover Interactions: Hovering over a section of the mill will display a tooltip with real-time metrics (e.g., "Production Line A: 85% capacity").
- Dynamic Overlays: Critical alerts (e.g., "Low Inventory") will appear as glowing red markers on the affected area of the mill model.
- Smooth Transitions: Clicking on a section will zoom into that area, transitioning to a detailed view with charts and graphs.
- Responsive Design: The 3D model will adapt to different screen sizes, ensuring usability on both desktop and mobile devices.
- Micro-Animations: Subtle animations, such as spinning gears or conveyor belts, will bring the mill to life without distracting from the data.
This design will make the dashboard not only functional but also visually engaging, leaving a lasting impression on users.
7. Non-Functional Requirements
- The system must support real-time data updates with a maximum latency of 2 seconds.
- The dashboard must be responsive and optimized for both desktop and mobile devices.
- The system must handle up to 1,000 concurrent users without performance degradation.
- The system must comply with enterprise-level security standards, including data encryption and role-based access control.
8. Tech Stack
- Frontend: HTML, CSS, JavaScript (with Chart.js for dynamic charts)
- Backend: Python with FastAPI for API development
- Database: MySQL for structured data storage
- AI Tools: Not applicable for this version
- Local Orchestration: Docker for containerization
- Server-Side Orchestration: Kubernetes for scalability and reliability
9. Assumptions and Constraints
- The system assumes that all users have access to modern web browsers that support HTML5, CSS3, and JavaScript.
- The system will not include AI-driven analytics in the initial version but may incorporate them in future updates.
- The dashboard will be hosted on a cloud platform to ensure scalability and availability.
10. Glossary
- Dashboard: A user interface that organizes and presents information in an easily digestible format.
- Real-Time Updates: Data that is refreshed automatically without requiring user intervention.
- Chart.js: A JavaScript library for creating interactive charts and graphs.
- FastAPI: A modern web framework for building APIs with Python.
- Docker: A platform for developing, shipping, and running applications in containers.
- Kubernetes: An open-source system for automating deployment, scaling, and management of containerized applications.
This updated SRD incorporates dynamic features and a structured layout for the mill management dashboard, ensuring it meets enterprise-level requirements while providing an engaging user experience.
No comments yet. Be the first!