gilded-tool

byIrvan Andzetha

Build tool

Landing
Landing

Comments (0)

No comments yet. Be the first!

System Requirements

System Requirements Document for gilded-tool

1. Introduction

The project is a tool named gilded-tool, as chosen by the user. The tool is built based on the attached PROMPT_AI.txt requirements.

1.1 Source overview

PROMPT UNTUK AI - STRATEGY LAB

==============================

Salin seluruh teks di bawah garis ini dan tempel ke AI (ChatGPT, Claude, Gemini, dll).

Lampirkan juga file app.py, grid_optimizer.py, dan smc_combo_backtest.py jika AI mendukungnya.

Kamu adalah asisten pemrograman dan analis kuantitatif. Saya punya proyek Python bernama

"Strategy Lab" dengan struktur berikut:

  1. app.py
Page 1 of 25

2. System Overview

gilded-tool (project name chosen by the user) is a Python quantitative research tool built to the attached PROMPT_AI.txt requirements. It is delivered as three cooperating modules rather than a single script: app.py provides the interactive entry point, grid_optimizer.py simulates grid-style strategies, and smc_combo_backtest.py simulates Smart Money Concepts (SMC) rule sets. Market data is fetched automatically from Yahoo Finance via yfinance; intraday intervals are restricted by that provider's limits. Strategy parameters for both the grid and SMC engines are supplied as comma-separated lists.

2.1 Actors

  • Quantitative researcher / strategy developer — the human operator. They configure parameter lists, run optimizations and backtests, and read the resulting metrics and equity curves. This is the only human role evidenced so far; the batch does not establish a complete persona catalog.
  • Supporting systems — yfinance (market data), the grid simulation engine, and the SMC backtest engine. These are supporting actors, not personas.
Page 2 of 25

2.2 Grid strategy capability (grid_optimizer.py)

Simulates grid strategies in the style of moomoo Trading Bots, in two modes:

  • base — a grid below the base price, stepping "buy on drop" with a "sell on rise" target expressed as a percentage.
  • range — a grid between a lower and an upper bound, divided evenly.

Core interface: GridConfig and simulate(df, cfg) -> (metrics, equity). Within a single candle, price order is estimated by candle direction: bullish O-L-H-C, bearish O-H-L-C.

2.3 SMC strategy capability (smc_combo_backtest.py)

Simulates rules mirroring two TradingView indicator concepts:

  • Super OrderBlock / FVG / BoS (makuchaku & eFe): three-candle FVG, BoS from confirmed fractal swings (no repaint), and Order Block as the opposing candle preceding the BoS.
  • Volume Profile / Volume Delta (KioseffTrading): delta approximated from OHLCV as volume * ((close - low) - (high - close)) / (high - low).

Entry occurs when price touches a zone and the close reacts back out of it, with optional filters for EMA200 trend alignment and same-direction delta. Stop loss sits behind the zone; take profit is set by risk:reward. Core interface: P (parameters), evaluate(df, cfg), and yearly_table(df, eqb, capital).

Page 3 of 25

2.4 Methodology and outcomes

Data is split in-sample (roughly 70%) for parameter selection and out-of-sample (the remainder) for validation. Primary metrics are return, max drawdown, return/drawdown, and win rate. Annual return is computed from end-of-year mark-to-market equity and compared against buy & hold.

2.5 Boundaries

This overview covers only the modules, actors, and capabilities evidenced above. It does not assert a complete page or component inventory, and no additional functionality is implied beyond the stated requirements.

3. Functional Requirements

Page 4 of 25

3.1 Source overview

Antarmuka Streamlit. Sidebar berisi:

  • "Perintah cepat" dengan format bebas urutan: TICKER PERIODE INTERVAL

    (contoh: "TSLA 2y 1h", "BBCA.JK 6mo 1d", "AAPL max 1d").

  • Pilihan ticker, periode, interval, modal, fee, porsi in-sample.

  • Opsi unggah CSV (open, high, low, close, volume).

  • Parameter grid dan SMC dalam bentuk daftar dipisah koma.

Data diambil otomatis dari Yahoo Finance (yfinance). Interval intraday dibatasi

sekitar 730 hari terakhir dan app memotongnya secara otomatis.

Hasil ditampilkan dalam lima tab: Ringkasan, Per Tahun, Trade, Parameter, Grafik.

  1. grid_optimizer.py

    Simulasi strategi grid ala Trading Bots moomoo. Dua mode:

    • base: grid di bawah base price dengan langkah "buy on drop" dan target jual "sell on rise" (%).
    • range: grid di antara batas bawah dan atas, dibagi rata.

    Fungsi utama: GridConfig, simulate(df, cfg) -> (metrik, equity).

    Urutan harga dalam satu candle diperkirakan (bullish: O-L-H-C, bearish: O-H-L-C).

  2. smc_combo_backtest.py

    Simulasi aturan yang meniru konsep dua indikator TradingView:

Page 5 of 25
  • Super OrderBlock / FVG / BoS (makuchaku & eFe): FVG tiga candle, BoS dari swing

    fraktal yang sudah terkonfirmasi (tanpa repaint), dan Order Block sebagai candle

    berlawanan sebelum BoS.

  • Volume Profile / Volume Delta (KioseffTrading): delta dihitung sebagai proxy dari OHLCV:

    volume * ((close - low) - (high - close)) / (high - low).

Entry ketika harga menyentuh zona lalu close bereaksi keluar, dengan filter opsional

tren EMA200 dan delta searah. Stop loss di balik zona, take profit berdasarkan risk:reward.

Fungsi utama: P (parameter), evaluate(df, cfg), yearly_table(df, eqb, capital).

Metodologi yang dipakai:

  • Data dibagi in-sample (sekitar 70%) untuk memilih parameter, lalu out-of-sample (sisanya)

    untuk validasi. Metrik utama: return, max drawdown, return/drawdown, dan win rate.

  • Return per tahun dihitung dari equity mark-to-market di akhir setiap tahun dan dibandingkan

    dengan buy & hold.

A. Jelaskan alur kerja kode ini dari sidebar sampai hasil di setiap tab.

Page 6 of 25

B. Periksa kode app.py, grid_optimizer.py, dan smc_combo_backtest.py dari bug logika,

terutama:

  • look-ahead bias (apakah sinyal memakai data masa depan?)
  • urutan fill order dalam satu candle
  • perhitungan drawdown dan return per tahun

Tunjukkan baris yang bermasalah dan berikan perbaikannya.

C. Tambahkan fitur berikut tanpa merusak struktur yang ada:

[ ] ekspor laporan HTML bertab dari app

[ ] pencatatan trade untuk strategi grid

[ ] walk-forward dengan beberapa jendela waktu, bukan hanya satu pembagian IS/OOS

[ ] perhitungan biaya dan slippage yang lebih realistis

(hapus yang tidak diinginkan)

D. Setelah saya tempel hasil dari tab Ringkasan, Per Tahun, atau Parameter, bantu saya:

  • membaca apakah konfigurasi terbaik konsisten antara IS dan OOS
  • mendeteksi tanda overfitting (misalnya IS sangat bagus tetapi OOS negatif)
  • menyarankan parameter yang layak diuji lebih lanjut

Aturan jawaban:

  • Tunjukkan asumsi yang kamu buat.
  • Jika ada bagian yang tidak bisa diverifikasi (misalnya data atau akses internet),
Page 7 of 25

katakan dengan jelas, jangan mengarang angka.

  • Berikan kode lengkap untuk file yang diubah, bukan potongan yang ambigu.

4. User Personas

No additional details specified.

5. Core User Flows

Page 8 of 25

5.1 Quick-Command Backtest Run

Actor: Retail quantitative trader.

Trigger: The trader opens the Streamlit app and wants a fast end-to-end backtest without configuring every field manually.

Steps:

  1. In the sidebar, the trader uses the "Perintah cepat" (quick command) field, which accepts a free-order format of TICKER PERIODE INTERVAL.
  2. The trader types a command such as TSLA 2y 1h, BBCA.JK 6mo 1d, or AAPL max 1d.
  3. The app parses the three tokens regardless of order and populates the corresponding ticker, period, and interval selections.
  4. The trader optionally adjusts the remaining sidebar inputs: modal, fee, and in-sample portion.
  5. The trader runs the backtest.
  6. Results are rendered across five tabs: Ringkasan (Summary), Per Tahun (Per Year), Trade, Parameter, and Grafik (Chart).

Result: A completed backtest whose outputs are distributed across the five result tabs.

Failure/recovery: If the quick command is malformed or a token is unrecognized, the trader can fall back to the explicit ticker, period, and interval selectors in the sidebar and re-run.

Continuation: The trader can proceed to any of the analysis flows below using the populated tabs.

Page 9 of 25

5.2 CSV Upload Backtest Run

Actor: Retail quantitative trader.

Trigger: The trader has OHLCV data outside the built-in data source and wants to backtest it.

Steps:

  1. In the sidebar, the trader selects the CSV upload option.
  2. The trader uploads a CSV containing open, high, low, close, and volume columns.
  3. The trader sets modal, fee, and in-sample portion as needed.
  4. The trader runs the backtest.
  5. Results appear in the same five tabs: Ringkasan, Per Tahun, Trade, Parameter, Grafik.

Result: A backtest driven by the uploaded OHLCV series, with outputs in the five tabs.

Failure/recovery: If the CSV lacks required columns or is otherwise unusable, the trader can correct the file and re-upload, or switch to the quick-command path.

Continuation: The trader can move to the analysis flows below.

Page 10 of 25

5.3 Workflow Walkthrough Request

Actor: Retail quantitative trader (as requester of explanation).

Trigger: The trader wants to understand how the code moves from sidebar inputs to each result tab.

Steps:

  1. The trader asks for an explanation of the code's workflow from the sidebar through to the results in each tab.
  2. The explanation traces the path from sidebar configuration into the backtest engine and out to Ringkasan, Per Tahun, Trade, Parameter, and Grafik.

Result: The trader gains a mental model of the data and control flow.

Continuation: This understanding supports the audit and interpretation flows below.

Page 11 of 25

5.4 Logic-Bug Audit Request

Actor: Retail quantitative trader (as requester of code review).

Trigger: The trader suspects correctness issues in the backtest implementation.

Steps:

  1. The trader asks for a review of app.py, grid_optimizer.py, and smc_combo_backtest.py for logic bugs.
  2. The review focuses on three named areas:
    • Look-ahead bias — whether signals use future data.
    • Fill-order sequence within a single candle — the order in which fills are processed inside one candle.
    • Drawdown and per-year return calculations — the correctness of these metrics.
  3. The review identifies the problematic lines and provides fixes.

Result: A list of problematic lines with proposed corrections.

Continuation: The trader can apply fixes and re-run the backtest flows above.

Page 12 of 25

5.5 Result Interpretation and Overfitting Check

Actor: Retail quantitative trader.

Trigger: The trader has pasted results from the Ringkasan, Per Tahun, or Parameter tab and wants help reading them.

Steps:

  1. The trader pastes the tab output.
  2. The analysis helps the trader:
    • Read whether the best configuration is consistent between in-sample (IS) and out-of-sample (OOS).
    • Detect signs of overfitting, for example IS looking very strong while OOS is negative.
    • Suggest parameters worth testing further.

Result: An interpretation of IS/OOS consistency, an overfitting assessment, and a shortlist of parameters to test next.

Continuation: The trader can feed the suggested parameters back into the quick-command or sidebar configuration and re-run.

5.6 Cross-Flow Notes

  • The five result tabs — Ringkasan, Per Tahun, Trade, Parameter, Grafik — are the shared output surface for flows 1 and 2.
  • The in-sample portion is a sidebar input that connects the backtest runs to the IS/OOS interpretation in flow 5.
  • Modal and fee are sidebar inputs that apply to both the quick-command and CSV upload paths.
  • The three audit focus areas in flow 4 (look-ahead bias, intra-candle fill order, drawdown and per-year return calculations) are the named correctness concerns for the backtest engine.
Page 13 of 25

5.7 Defaults

  • The quick-command format is free-order; no fixed token order is required.
  • No default values for ticker, period, interval, modal, fee, or in-sample portion are specified in the accepted evidence; these remain user-supplied unless later defined.

6. Visuals Colors and Theme

[Design proposal; unspecified choices are defaults.]

Page 14 of 25

6.1 Visuals, Colors and Theme

Mode: dark only; light mode is not offered. The ground is graphite/titanium, never white or near-white.

Palette by role (dark mode):

RoleToken
Background (ground)#0E1013
Surface (raised instrument panels)#171A1F
Row striping#14171B
Hairline rules / borders#2A2E35
Text (body and values)#EDE7DA
Muted (labels, units, metadata)#8A8578
Primary — single instrument accent#C9A227
Accent — secondary signal#2FB6A8

Champagne gold #C9A227 is used sparingly and never as a flood: primary CTA, active tab underline, winning-metric values, dial arc fill. Teal #2FB6A8 is reserved for buy/long, positive delta and out-of-sample validation marks. Warm off-white #EDE7DA on #0E1013 gives roughly 13:1 contrast; muted #8A8578 sits near 5:1 for labels and units. Red is deliberately absent as a brand colour — drawdown and loss states use a desaturated warm rust derived from the ground, so the page never reads as alarm-red/green trading cliché. No blue anywhere.

Page 15 of 25

Typography: headings and instrument labels in Saira Condensed 600–700, uppercase for labels and tab names at +0.08em tracking, tight 0.95 leading; display numbers in Saira Condensed 700 with tabular figures. Body copy in Barlow 400/500 at 16–18px, 1.6 line-height; numeric tables use Barlow with tabular numerals. Scale is a 1.25 modular with instrument overshoot: 14 (micro-label) / 16 (body) / 20 (lead) / 28 (section) / 44 (tab-page title) / clamp(72px, 11vw, 152px) display readout, mobile display floor 56px, desktop ceiling 152px. The 6:1 jump between oversized display numbers and quiet body copy makes the numbers the loudest thing on the page.

Shape language: instrument geometry, not soft SaaS geometry — 2px-radius panels (near-square, machined), 1px hairline borders at #2A2E35, circular gauge bezels with a thin gold arc, ruled data rows with alternating #14171B striping, and a 45° knurled edge motif on primary buttons. No pill buttons, no 16px radii, no drop-shadow card lift. Bezel rings, tick marks and ruled scales are the decorative vocabulary; every ornament is a measurement.

Layout: full-bleed dark cockpit. Left rail is the control column (Perintah cepat command input, ticker/period/interval, capital, fee, IS portion, CSV upload, comma-separated grid and SMC parameter lists) styled as a labelled instrument stack with small-caps labels above their controls and a thin gold rule separating sections. The main stage is a five-position instrument cluster — Ringkasan, Per Tahun, Trade, Parameter, Grafik — rendered as a physical bezel strip of tabs with a gold underline travelling between them. Content below is a strict 12-column grid of ruled panels: metric gauges top-left, equity curve panel spanning 8 columns, yearly table and buy & hold comparison as ruled tabular blocks. At 375px the rail collapses to a full-width stacked control panel and the tab strip becomes a horizontally scrollable bezel row; at 768px the rail becomes a two-column control grid; at 1280px the rail is a fixed 320px column with the stage filling the rest.

Page 16 of 25

Imagery: no stock photography of people. The imagery is the instrument itself — an oversized machined dial rendered in CSS/SVG with knurled edge, tick marks and a gold arc mapping the selected strategy's return/drawdown ratio; a topographic contour line pattern at 6% opacity as the page's only background texture; macro textures of brushed titanium and sapphire as thin 24px bands between sections. Charts are treated as instruments: dark ground, gold equity line, teal buy & hold line, ruled gridlines, no gradient fills under the curve.

Avoid: blue or indigo anywhere (no #0057FF, #2563EB, #4F46E5, #7C3AED or neighbours, no blue CTA on a light ground); white or near-white page ground; Inter, Roboto, Arial, Helvetica, Open Sans, Lato, Poppins or system-ui for headings or body; gradient-blob heroes, glassmorphism, frosted panels and soft floating cards; grids of identical hover-lift cards with 16px radii and drop shadows; playful bounce easing, confetti, particles or cartoon illustration; alarm-red/green trading cliché as the dominant signal system; emoji-heavy or exclamation-led Indonesian copy. The generic indigo/blue-on-white SaaS template is forbidden for this project.

Readable text and controls stay whole at every viewport: headlines, wordmarks, labels, numbers, card text and controls stay entirely inside the viewport and their container at 375px, 768px and 1280px, wrapping or scaling (for example font-size: clamp(...) with its mobile size) to fit, and no other element covers any part of them. Imagery, decoration and motion may be cropped, bled off an edge, rotated, overlapped or cut exactly as the direction asks, as long as they cover no readable text or control. Moving and scrollable content (the bezel tab row) may cross the container edge by design and is judged by whether every item becomes fully readable as it passes. With prefers-reduced-motion, the tab row wraps or scrolls so each item can be brought fully into view.

Page 17 of 25

7. Signature Design Concept

[Design proposal; unspecified choices are defaults.]

Muse: MARQ by Garmin — precision luxury instrumentation. Headline idea: a dark titanium cockpit for the Strategy Lab.

The product is a quantitative trading and backtest lab (Streamlit + Python, yfinance, SMC/grid strategy simulation) used by technically literate retail traders and quant-curious analysts in Indonesia and beyond. The emotional register is not friendly SaaS optimism and not playful fintech; it is the sober, slightly thrilling register of instrumentation — a person reading gauges on a serious machine, wanting to trust the numbers, detect overfitting, and not be sold a dream. Indonesian-language copy, dense tabular output, five result tabs and IS/OOS discipline make this a cockpit, not a landing page. MARQ's language — dark titanium surfaces, macro material detail, dial-like data, needle sweeps and counting numbers, condensed technical type for readouts — makes return/drawdown, win rate and yearly tables feel like instrument readings rather than marketing metrics, and carries the product's own credibility burden (overfitting detection, realistic fees, walk-forward honesty) as a visual promise of precision.

Signature moves:

Page 18 of 25
  1. A full-bleed machined dial hero: an oversized CSS/SVG instrument with knurled bezel, 360 tick marks and a champagne-gold arc that sweeps to the selected strategy's return/drawdown ratio, with the project wordmark set inside the dial face at clamp(56px, 9vw, 140px).
  2. Tabs as a physical instrument bezel strip: Ringkasan / Per Tahun / Trade / Parameter / Grafik sit on a ruled rail with a gold underline that travels between positions on selection, and the strip becomes a horizontally scrollable bezel row at 375px.
  3. Metric values rendered as counting dial readouts: return, max drawdown, return/drawdown and win rate appear in Saira Condensed 700 tabular figures that count up from zero on backtest completion, each with a thin gold arc gauge beneath it — never a plain stat card.
  4. Ruled instrument tables instead of cards: Per Tahun and the buy & hold comparison are alternating-striped ruled rows with hairline #2A2E35 separators and right-aligned tabular numerals, with the winning row marked by a 2px gold left rule rather than a coloured fill.
  5. A topographic contour texture at 6% opacity bleeding off the bottom-left of the hero and a 24px brushed-titanium macro band marking the transition from hero into the control rail — the only two decorative surfaces on the page.
Page 19 of 25

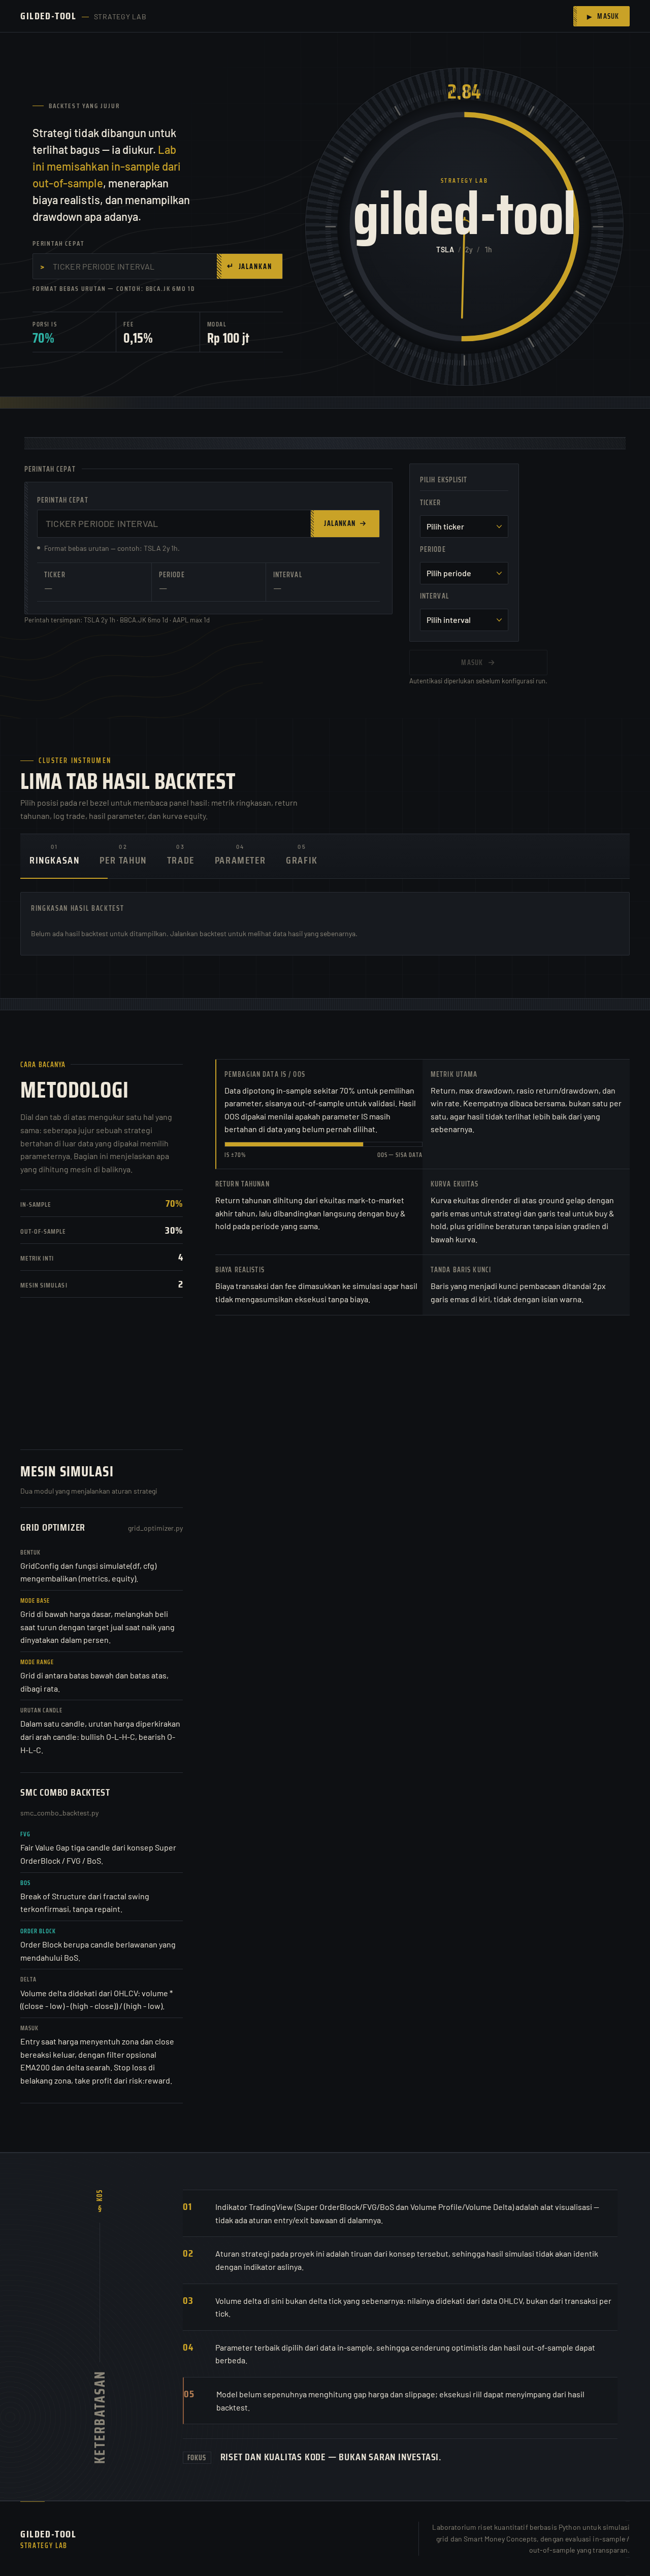
Hero composition (public entry): the first screen is a full-bleed dark titanium cockpit, not a centred headline. A single oversized circular instrument dial (clamp(280px, …, 620px)) dominates the right 55% of the viewport, rendered in CSS/SVG with a machined bezel, 360 tick marks and a gold arc whose sweep represents the current strategy's return/drawdown ratio; inside the dial sits the display readout — the project name gilded-tool in Saira Condensed 700 at clamp(56px, 9vw, 140px), with STRATEGY LAB as a small-caps gold micro-label above it and the live ticker/period/interval from Perintah cepat below it in Barlow. The left 45% holds a left-aligned stack: a one-line Indonesian subhead about backtest honesty, the Perintah cepat input styled as a machined command field with a gold execute key, and a hairline-ruled row of three instrument chips (IS portion, fee, capital). Nothing is centred, nothing floats on a gradient blob, and the palette roles are unambiguous: near-black ground, warm off-white type, champagne gold as the single hot accent, teal only on the secondary signal. The hero recomposes only accepted content, states and controls — the Perintah cepat input, the ticker/period/interval readout, the IS portion/fee/capital chips and the five-tab cluster — and introduces no new behaviour, page or destination.

8. Interaction Model & Motion Direction

[Design proposal; unspecified choices are defaults.]

Interaction Model: Parallax Motion Tempo: cinematic Hero Dimensionality: dimensional_css

Landing Hero Motion Brief

Page 20 of 25
  • Focal subject: the oversized machined instrument dial — knurled bezel, 360 tick marks, champagne-gold arc — with the gilded-tool wordmark and STRATEGY LAB micro-label set inside the dial face, and the live ticker/period/interval readout beneath it.
  • Input → transformation → outcome thesis: the user enters a ticker, period and interval in the Perintah cepat command field and presses the gold execute key → the dial's needle sweeps once and settles while the numeric readout counts up from zero to the strategy's return/drawdown ratio and the gold arc fills to match → the instrument cluster resolves into its five tab positions (Ringkasan, Per Tahun, Trade, Parameter, Grafik) with the gold underline resting on the active tab. Every step uses only accepted behaviour: the command input, the backtest completion state, the five result tabs and the IS/OOS metric readouts.
  • Motion vocabulary: needle sweeps on gauges when a backtest completes; numbers counting up from zero to their final value over ~900ms with a precise ease-out; the gold tab underline sliding between tab positions; a slow scroll-linked parallax between the hero dial layer and the data grid behind it. No bounce, no particles, no playful easing. Functional transitions on controls run 120–200ms.
  • Composed first frame: full-bleed #0E1013 ground; dial occupying the right 55% of the viewport with its gold arc at rest and the wordmark fully legible inside the face; left 45% holding the Indonesian subhead, the machined command field with its gold execute key, and the hairline-ruled IS portion / fee / capital chips; topographic contour texture at 6% opacity bleeding off the bottom-left; the 24px brushed-titanium macro band marking the transition into the control rail. Nothing centred, nothing floating on a gradient blob.
  • Reduced-motion state: prefers-reduced-motion replaces sweeps and counts with instant final values and a static tab underline; the parallax layer is dropped so the dial and data grid sit flat; the bezel tab row wraps or scrolls horizontally so every tab can be brought fully into view. The first frame remains fully readable and usable with no motion at all.
Page 21 of 25

9. Non-Functional Requirements

No additional details specified.

10. Tech Stack

The tool is a Python project named gilded-tool, built to the requirements captured in PROMPT_AI.txt. The evidence names three Python modules — app.py, grid_optimizer.py, and smc_combo_backtest.py — and frames the project as a programming and quantitative-analysis assistant for a "Strategy Lab" structure. These module names are the only layer-specific technology choices established so far; they are treated as required artifacts of the project rather than suggestions.

10.1 Specified layers

LayerChoiceStatus
Language / runtimePythonRequired (project is described as a Python project)
Application entry moduleapp.pyRequired (named in source)
Optimization modulegrid_optimizer.pyRequired (named in source)
Backtesting modulesmc_combo_backtest.pyRequired (named in source)
Project namegilded-toolRequired (user decision)
Page 22 of 25

10.2 Unspecified layers and defaults

The evidence does not state a web framework, database, packaging tool, test framework, or deployment target. Because the project is a Python tool with no stated delivery platform, the following defaults are proposed only for layers the requirements leave open, and they are labeled as defaults rather than user choices:

  • Default — dependency and environment management: a standard Python virtual environment with a requirements.txt file, unless the project later specifies another mechanism.
  • Default — interface: a command-line entry point invoked through app.py, since no graphical or web interface is named in the evidence.
  • Default — testing: pytest for unit tests of the optimizer and backtest modules, pending any explicit choice.

No native mobile application, web front end, or additional delivery platform is implied by the evidence; responsive web access is not a stated requirement, and none should be inferred. Any future stack decisions beyond the named Python modules remain open work and are not settled by this chapter.

11. Assumptions and Constraints

Page 23 of 25

11.1 Source overview

Batasan yang harus kamu pahami:

  • Kedua indikator TradingView adalah alat visualisasi, tidak punya aturan entry/exit bawaan.

    Aturan di proyek ini adalah tiruan yang saya tulis sendiri, sehingga hasilnya tidak sama

    dengan indikator aslinya.

  • Volume delta bukan delta tick sebenarnya.

  • Parameter terbaik dipilih dari in-sample dan cenderung optimistis.

  • Model belum memperhitungkan gap harga dan slippage secara penuh.

Tugas yang saya minta (pilih sesuai kebutuhan, jawab dalam bahasa Indonesia):

  • Hindari saran investasi. Fokus pada kualitas riset dan kode.
Page 24 of 25

12. Glossary

TradingView indicators — The two visualization tools referenced by this project. They provide visual output only and have no built-in entry or exit rules.

Entry/exit rules — The trading decision rules used in this project. They are imitations written by the project author, not the original indicators' rules, so results will not match the original indicators.

Volume delta — A volume-based measure used in this project. It is not true tick delta.

In-sample parameters — The parameter set selected from in-sample data. These are the best parameters chosen during in-sample testing and tend to be optimistic.

Gap and slippage — Price movement effects that the model does not yet fully account for.

Page 25 of 25
Landing design preview
Quick command is malformed or a token is unrecognized.
Quick command is well-formed and all tokens are recognized.
Ticker, period, and interval are selected explicitly.
User does not have an account.
Authentication succeeded.
Sign-up succeeded.
Automatic Yahoo Finance fetch is chosen.
CSV upload is chosen.
Quick command is malformed or a token is unrecognized.
Quick command is well-formed and all tokens are recognized.
Ticker, period, and interval are selected explicitly.
CSV lacks required columns or is otherwise unusable.
CSV contains the required OHLCV columns and is usable.
Corrected CSV is re-uploaded.
User switches to the quick-command path.
Intraday interval is selected.
Non-intraday interval is selected.
Grid strategy trade logging is enabled.
Grid strategy trade logging is not enabled.
User chooses to continue to Walk-Forward.
User chooses to proceed to Report Export.
User chooses to proceed to Code Review.
User chooses to return to Run Configuration.
User chooses to re-run the backtest flows.
Landing: View the public landing page with the machined dial hero, the Perintah cepat command field, and the five-tab instrument cluster.
Landing: Enter a free-order TICKER PERIODE INTERVAL command e.g. TSLA 2y 1h, BBCA.JK 6mo 1d, AAPL max 1d in the Perintah cepat field.
Landing: Press the gold execute key to submit the quick command.
Landing: Parse the three tokens regardless of order and populate the corresponding ticker, period, and interval selections.
Landing: Decide whether the quick command is well-formed and all tokens are recognized.
Landing: Fall back to the explicit ticker, period, and interval selectors when the quick command is malformed or a token is unrecognized.
Landing: Proceed to the Login page to access the configured backtest workspace.
Login: 1. View the Login page.
Login: 2. Enter credentials to authenticate.
Login: 3. Submit the login form.
Login: 4. Decide whether authentication succeeded.
Login: 5. Navigate to the Sign Up page when the user does not have an account.
Sign Up: 6. View the Sign Up page.
Sign Up: 7. Enter the required account details.
Sign Up: 8. Submit the sign-up form.
Sign Up: 9. Proceed to the Login page after successful sign-up.
Run Configuration: 1. View the Run Configuration sidebar with Perintah cepat, ticker/period/interval, modal, fee, in-sample portion, CSV upload, and comma-separated grid and SMC parameter lists.
Run Configuration: 2. Choose the data source: automatic Yahoo Finance fetch or CSV upload.
Run Configuration: 3. Use the Perintah cepat field with a free-order TICKER PERIODE INTERVAL command.
Run Configuration: 4. Parse the three tokens regardless of order and populate the corresponding ticker, period, and interval selections.
Run Configuration: 5. Decide whether the quick command is well-formed and all tokens are recognized.
Run Configuration: 6. Fall back to the explicit ticker, period, and interval selectors when the quick command is malformed or a token is unrecognized.
Run Configuration: 7. Select the CSV upload option and upload a CSV containing open, high, low, close, and volume columns.
Run Configuration: 8. Decide whether the uploaded CSV contains the required OHLCV columns and is usable.
Run Configuration: 9. Correct the CSV file and re-upload, or switch to the quick-command path, when the CSV lacks required columns or is otherwise unusable.
Run Configuration: 10. Set modal, fee, and in-sample portion as needed.
Run Configuration: 11. Enter grid strategy parameters as comma-separated lists.
Run Configuration: 12. Enter SMC strategy parameters as comma-separated lists.
Run Configuration: 13. Run the backtest.
Run Configuration: 14. Automatically truncate intraday intervals to the provider limit of approximately the last 730 days.
Run Configuration: 15. Reach the completed backtest state with results distributed across the five result tabs: Ringkasan, Per Tahun, Trade, Parameter, Grafik.
Trade: 16. View the Trade tab presenting the trade list.
Trade: 17. View the grid strategy trade log added to the Trade tab.
Trade: 18. Continue to other result tabs or proceed to Report Export.
Walk-Forward: 19. View the Walk-Forward page.
Walk-Forward: 20. Configure multiple walk-forward time windows instead of a single IS/OOS split.
Walk-Forward: 21. Run the multi-window walk-forward analysis.
Walk-Forward: 22. Review the walk-forward results across windows.
Walk-Forward: 23. Continue to other result tabs or proceed to Report Export.
Report Export: 24. View the Report Export page.
Report Export: 25. Configure the tabbed HTML report export.
Report Export: 26. Generate the tabbed HTML report.
Report Export: 27. Download the generated HTML report.
Report Export: 28. Continue to other result tabs or proceed to Code Review.
Code Review: 29. View the Code Review page.
Code Review: 30. Request a review of app.py, grid_optimizer.py, and smc_combo_backtest.py for logic bugs.
Code Review: 31. Check for look-ahead bias: whether signals use future data.
Code Review: 32. Check the fill-order sequence within a single candle.
Code Review: 33. Check the drawdown and per-year return calculations.
Code Review: 34. Identify the problematic lines in the three modules.
Code Review: 35. Provide fixes for the identified problematic lines.
Code Review: 36. Apply the fixes and re-run the backtest flows.
Code Review: 37. Continue to other result tabs or return to Run Configuration.
Landing design preview
Quick command is malformed or a token is unrecognized.
Quick command is well-formed and all tokens are recognized.
Ticker, period, and interval are selected explicitly.
User does not have an account.
Authentication succeeded.
Sign-up succeeded.
Automatic Yahoo Finance fetch is chosen.
CSV upload is chosen.
Quick command is malformed or a token is unrecognized.
Quick command is well-formed and all tokens are recognized.
Ticker, period, and interval are selected explicitly.
CSV lacks required columns or is otherwise unusable.
CSV contains the required OHLCV columns and is usable.
Corrected CSV is re-uploaded.
User switches to the quick-command path.
Intraday interval is selected.
Non-intraday interval is selected.
Grid strategy trade logging is enabled.
Grid strategy trade logging is not enabled.
User chooses to continue to Walk-Forward.
User chooses to proceed to Report Export.
User chooses to proceed to Code Review.
User chooses to return to Run Configuration.
User chooses to re-run the backtest flows.
Landing: View the public landing page with the machined dial hero, the Perintah cepat command field, and the five-tab instrument cluster.
Landing: Enter a free-order TICKER PERIODE INTERVAL command e.g. TSLA 2y 1h, BBCA.JK 6mo 1d, AAPL max 1d in the Perintah cepat field.
Landing: Press the gold execute key to submit the quick command.
Landing: Parse the three tokens regardless of order and populate the corresponding ticker, period, and interval selections.
Landing: Decide whether the quick command is well-formed and all tokens are recognized.
Landing: Fall back to the explicit ticker, period, and interval selectors when the quick command is malformed or a token is unrecognized.
Landing: Proceed to the Login page to access the configured backtest workspace.
Login: 1. View the Login page.
Login: 2. Enter credentials to authenticate.
Login: 3. Submit the login form.
Login: 4. Decide whether authentication succeeded.
Login: 5. Navigate to the Sign Up page when the user does not have an account.
Sign Up: 6. View the Sign Up page.
Sign Up: 7. Enter the required account details.
Sign Up: 8. Submit the sign-up form.
Sign Up: 9. Proceed to the Login page after successful sign-up.
Run Configuration: 1. View the Run Configuration sidebar with Perintah cepat, ticker/period/interval, modal, fee, in-sample portion, CSV upload, and comma-separated grid and SMC parameter lists.
Run Configuration: 2. Choose the data source: automatic Yahoo Finance fetch or CSV upload.
Run Configuration: 3. Use the Perintah cepat field with a free-order TICKER PERIODE INTERVAL command.
Run Configuration: 4. Parse the three tokens regardless of order and populate the corresponding ticker, period, and interval selections.
Run Configuration: 5. Decide whether the quick command is well-formed and all tokens are recognized.
Run Configuration: 6. Fall back to the explicit ticker, period, and interval selectors when the quick command is malformed or a token is unrecognized.
Run Configuration: 7. Select the CSV upload option and upload a CSV containing open, high, low, close, and volume columns.
Run Configuration: 8. Decide whether the uploaded CSV contains the required OHLCV columns and is usable.
Run Configuration: 9. Correct the CSV file and re-upload, or switch to the quick-command path, when the CSV lacks required columns or is otherwise unusable.
Run Configuration: 10. Set modal, fee, and in-sample portion as needed.
Run Configuration: 11. Enter grid strategy parameters as comma-separated lists.
Run Configuration: 12. Enter SMC strategy parameters as comma-separated lists.
Run Configuration: 13. Run the backtest.
Run Configuration: 14. Automatically truncate intraday intervals to the provider limit of approximately the last 730 days.
Run Configuration: 15. Reach the completed backtest state with results distributed across the five result tabs: Ringkasan, Per Tahun, Trade, Parameter, Grafik.
Trade: 16. View the Trade tab presenting the trade list.
Trade: 17. View the grid strategy trade log added to the Trade tab.
Trade: 18. Continue to other result tabs or proceed to Report Export.
Walk-Forward: 19. View the Walk-Forward page.
Walk-Forward: 20. Configure multiple walk-forward time windows instead of a single IS/OOS split.
Walk-Forward: 21. Run the multi-window walk-forward analysis.
Walk-Forward: 22. Review the walk-forward results across windows.
Walk-Forward: 23. Continue to other result tabs or proceed to Report Export.
Report Export: 24. View the Report Export page.
Report Export: 25. Configure the tabbed HTML report export.
Report Export: 26. Generate the tabbed HTML report.
Report Export: 27. Download the generated HTML report.
Report Export: 28. Continue to other result tabs or proceed to Code Review.
Code Review: 29. View the Code Review page.
Code Review: 30. Request a review of app.py, grid_optimizer.py, and smc_combo_backtest.py for logic bugs.
Code Review: 31. Check for look-ahead bias: whether signals use future data.
Code Review: 32. Check the fill-order sequence within a single candle.
Code Review: 33. Check the drawdown and per-year return calculations.
Code Review: 34. Identify the problematic lines in the three modules.
Code Review: 35. Provide fixes for the identified problematic lines.
Code Review: 36. Apply the fixes and re-run the backtest flows.
Code Review: 37. Continue to other result tabs or return to Run Configuration.