garnet-mg
 苗宇
苗宇我想写一个国自然面上项目,先前的具体做法是对12例MG患者进行了外周血scRNAseq+scTCR+scBCR测序,并在GEO数据库中下载了相同平台的健康人样本进行整合分析,发现了MG患者中CD8T发生克隆扩增,而且克隆扩增的T细胞与HC中克隆扩增的T细胞之间进行GSEA分析发现病毒性心肌炎相关的通路被显著激活;我想提出假设MG 克隆扩增 T 细胞是具有心肌自身抗原交叉反应性。后续可以添加机制验证实验,题目定为(重症肌无力克隆扩增CD8⁺T细胞介导心肌交叉免疫损伤的机制研究)。(C4T细胞我并未发现克隆扩增,可能是scTCR的缘故导致整体CD4T都很少,所以我觉得可能是单克隆的主要原因,另外文献中很多有提到Cd4T克隆扩增的现象) 另外我们先前已经对另一个项目的分析中针对500例内部样本MG患者进行了bulk TCR测序,其中混杂有100个左右的病毒性心肌炎患者,可以针对前面鉴定的TCR进一步数据层面的验证);你觉得我顺着这个思路做怎么样呢,如果可行,你帮我根据文献报道帮我写一个立项依据出来,下面的立项依据是我去年写的另一个项目的,你可以参考下格式。 1. 项目的立项依据(研究意义、国内外研究现状及发展动态分析,需结合科学研究发展趋势来论述科学意义;或结合国民经济和社会发展中迫切需要解决的关键科技问题来论述其应用前景。附主要参考文献目录); 1.1研究意义 视神经脊髓炎谱系疾病(Neuromyelitis optica spectrum disorders,NMOSD)是一种罕见的主要累及视神经和脊髓的自身免疫性疾病。这种疾病以急性视神经炎和横贯性脊髓炎为主要临床特征,患者往往会因反复发作而产生严重的后遗症,如视力下降或失明、肢体瘫痪甚至死亡。在80%以上的患者中,NMOSD是由高度特异性的血清自身抗体(AQP4-IgG)攻击视神经和脊髓中星形胶质细胞上的水通道蛋白4(Aquaporin-4,AQP4)所致[1]。 自2004年AQP4-IgG报道以来,NMOSD被认为是一种体液免疫驱动的疾病[2]。目前该病的治疗策略大多依赖于使用免疫抑制剂,包括靶向CD19或CD20的B细胞耗竭疗法[3, 4]。尽管这种疗法在大多数NMOSD患者中可通过清除血液中的B细胞来缓解症状,但我们在临床研究中发现仍有部分患者即使B细胞数量减少至零,病情仍然会严重恶化,这意味着存在B细胞之外的因素影响疾病的进程。事实上,越来越多的证据表明,T细胞与NMOSD的病理生理学有关[5, 6]。有研究指出,NMOSD患者外周血中Th17细胞的比例与疾病残疾程度之间存在显著正相关[7]。我们在先前的研究中也发现了NMOSD患者的TCRβ库相对于健康对照发生非常显著的克隆扩增[8]。这一发现进一步印证了T细胞在NMOSD病程中起到的重要作用。尽管如此,T细胞在NMOSD进展过程中的详细动态变化仍有待揭示。 在本研究的前期,我们发现NMOSD患者的TCRβ特征与疾病严重程度存在显著负相关。为了探究疾病进展背后T细胞的动态变化过程,本研究将选择不同残疾严重程度的NMOSD患者作为研究对象,拟通过免疫组库、转录组、单细胞转录组和单细胞VDJ测序等技术手段进行多组学分析,以揭示T细胞在疾病进展中的演化过程和特征变化,识别与基因表达、细胞类型和免疫反应相关的差异。这些结果可能为我们理解NMOSD的免疫机制和病程进展提供新的视角。 1.2 国内外研究现状及发展动态 1.2.1 B细胞和浆细胞在NMOSD中的作用 约80%的患者可检测到自身抗体AQP4-IgG[9, 10]。AQP4-IgG被认为在进入中枢神经系统(CNS)并与星形胶质细胞末端的AQP4结合时具有致病性,从而刺激一系列炎症事件,导致NMOSD中的轴突和神经元损伤。越来越多的证据表明,AQP4-IgG在外周合成,而不是在鞘内合成,随后通过破坏的血脑屏障进入中枢神经系统[11]。因此,NMOSD可以被认为是一种主要由外周抗体介导的自身免疫性疾病。 AQP4-IgG+的NMOSD患者发病机制如图1所示[12]。AQP4肽可以被自身反应性T细胞识别,然后极化为辅助性T细胞亚型17(Th17)表型,并为被构象完整的AQP4蛋白激活的B细胞提供帮助。进而,这些B细胞分化为能够分泌AQP4-IgG的成熟浆细胞。这个过程发生在中枢神经系统之外[12]。AQP4-IgG在血液中循环并进入CNS,在那里与星形胶质细胞足突上表达的AQP4蛋白相互作用。这种相互作用可以激活补体,导致血脑屏障破坏、星形胶质细胞膜受损、少突胶质细胞死亡、髓鞘丢失以及神经元损伤[13-15]。星形胶质细胞损伤的机制主要包括补体依赖的细胞毒作用和抗体依赖的细胞毒作用。补体依赖性细胞毒性可能是NMOSD的主要机制。 图1 NMOSD的发病机制示意图[16] AQP4-IgG的致病作用凸显了B细胞和浆细胞在NMOSD中的重要性。AQP4-IgG的直接致病性也支持B细胞参与的证据[17]。由于B细胞发挥多种关键作用,NMOSD被认为是体液介导的。B细胞能够产生多种促炎细胞因子,包括IL-6、TNF-α和粒细胞巨噬细胞集落刺激因子,这些因子可驱动炎症反应[18]。B细胞作为NMOSD发病机制的核心,并且与补体系统是当前可用的NMOSD疗法的关键靶标。 有研究发现NMOSD患者CD19intCD27highCD38high B细胞亚群在患者外周血中选择性克隆扩增,该亚群具有浆细胞样细胞功能,并分泌AQP4-IgG[19]。另有研究发现,NMOSD中B细胞向浆细胞分化失调。当与外周辅助性T细胞共培养时,来自NMOSD的记忆B细胞分化为浆细胞的潜力增强。因此,B细胞谱系的转录谱偏向浆细胞样表型[20]。 1.2.2 自身反应性T细胞在NMOSD中的作用 事实上,越来越多的证据表明,T细胞与NMOSD的病理生理学有关[5-7]。Nishiyama等人发现T细胞在NMOSD的发病机制中扮演着重要角色[21],单独的AQP4特异性抗体并不能引发中枢神经系统的炎症性脱髓鞘病变[13, 22]。然而,将AQP4特异性T细胞与AQP4-IgG同时转移到大鼠体内,则会产生与NMOSD相似的炎性组织损伤[23, 24]。 NMOSD血清中的AQP4特异性抗体是IgG1,这是一种T细胞依赖的IgG亚类[25],T细胞介导的CNS炎症允许这些抗体进入中枢神经系统[26],这表明AQP4特异性的CD4+ T细胞参与了这种适应性体液反应的发生。目前已经在NMOSD患者中发现了AQP4特异性T细胞的存在[27]。有研究发现,来自NMOSD患者的T细胞比来自健康对照的T细胞表现出对AQP4更强的增殖能力,并且对AQP4p61-80的反应最强烈[28]。据报道,与健康人相比,NMOSD患者急性期外周血T细胞总数中的调节性T细胞(Tregs),特别是初始Tregs的比例明显下降[5]。另外有研究发现,AQP4抗原刺激可使免疫反应极化为Th17反应,并分泌Th17相关细胞因子,如IL-6和IL-21[29]。Th17细胞可通过分泌IL-17、促进内皮活化和刺激中性粒细胞跨内皮迁移来损害血脑屏障的完整性[30]。此外,申请人在先前的研究中发现,相对于健康对照,AQP4-IgG+ NMOSD患者的TCRβ库多样性和CDR3长度的显著降低。并提出AQP4-IgG+ NMOSD疾病的发生可能是受到CMV病毒感染而激活自身反应性T细胞所诱发[8]。总之,这些观察结果凸显了AQP4特异性T细胞在NMOSD发病机制中作为适应性体液和细胞免疫反应驱动因素的潜在作用。 综上所述,本研究基于NMOSD疾病进展过程中TCRβ库的多样性显著降低的现象提出科学假设:在NMOSD的疾病进展过程中,特定的T细胞亚群经历了克隆扩增,这一过程对于疾病进展起到了促进作用。 然而,关于疾病进展过程中T细胞发挥的重要作用面临以下两个关键问题: 1)疾病进展中T细胞的动态变化过程及其对B细胞的影响:目前尚未清楚T细胞在NMOSD进展过程中的详细动态变化,我们需要揭示T细胞的动态演变(包括细胞比例和分子特征的动态变化)以及它如何影响B细胞和疾病的长期发展。 2)疾病进展过程中影响T细胞多样性的调控机制:本研究前期发现NMOSD患者的TCRβ库多样性随着疾病的残疾进展逐渐降低。这意味着随着疾病进展,一些T细胞发生克隆扩增,但我们需要更加明确这背后的调控机制。 为了解决这些问题,我们计划以不同严重程度的NMOSD患者为研究对象,通过多组学分析,包括免疫组库、转录组、单细胞转录组和单细胞VDJ测序等技术手段,来揭示T细胞在NMOSD患者中的演化过程、调控机制以及与B细胞多样性和疾病进展的关系。这将有助于我们更好地理解AQP4-IgG+ NMOSD的免疫机制,从而促进疾病的诊断、治疗和预后监测的发展。 参考文献: [1] JARIUS S, PAUL F, WEINSHENKER B G, et al. Neuromyelitis optica [J]. Nat Rev Dis Primers, 2020, 6(1): 85. [2] LENNON V A, WINGERCHUK D M, KRYZER T J, et al. A serum autoantibody marker of neuromyelitis optica: distinction from multiple sclerosis [J]. Lancet, 2004, 364(9451): 2106-12. [3] KITLEY J, PALACE J. Therapeutic options in neuromyelitis optica spectrum disorders [J]. Expert Rev Neurother, 2016, 16(3): 319-29. [4] PAPADOPOULOS M C, BENNETT J L, VERKMAN A S. Treatment of neuromyelitis optica: state-of-the-art and emerging therapies [J]. Nat Rev Neurol, 2014, 10(9): 493-506. [5] MA X, QIN C, CHEN M, et al. Regulatory T cells protect against brain damage by alleviating inflammatory response in neuromyelitis optica spectrum disorder [J]. J Neuroinflammation, 2021, 18(1): 201. [6] SHI Z, QIU Y, ZHAO Z, et al. CD8(+) T cell subpopulations and pro-inflammatory cytokines in neuromyelitis optica spectrum disorder [J]. Ann Clin Transl Neurol, 2021, 8(1): 43-53. [7] AGASING A M, WU Q, KHATRI B, et al. Transcriptomics and proteomics reveal a cooperation between interferon and T-helper 17 cells in neuromyelitis optica [J]. Nat Commun, 2020, 11(1): 2856. [8] MIAO Y, SHI Z, ZHANG W, et al. Immune Repertoire Profiling Reveals Its Clinical Application Potential and Triggers for Neuromyelitis Optica Spectrum Disorders [J]. Neurol Neuroimmunol Neuroinflamm, 2023, 10(5). [9] HAMID S H M, WHITTAM D, MUTCH K, et al. What proportion of AQP4-IgG-negative NMO spectrum disorder patients are MOG-IgG positive? A cross sectional study of 132 patients [J]. J Neurol, 2017, 264(10): 2088-94. [10] PAPADOPOULOS M C, VERKMAN A S. Aquaporin water channels in the nervous system [J]. Nat Rev Neurosci, 2013, 14(4): 265-77. [11] MAJED M, FRYER J P, MCKEON A, et al. Clinical utility of testing AQP4-IgG in CSF: Guidance for physicians [J]. Neurol Neuroimmunol Neuroinflamm, 2016, 3(3): e231. [12] WEINSHENKER B G, WINGERCHUK D M. Neuromyelitis Spectrum Disorders [J]. Mayo Clin Proc, 2017, 92(4): 663-79. [13] PAPADOPOULOS M C, VERKMAN A S. Aquaporin 4 and neuromyelitis optica [J]. Lancet Neurol, 2012, 11(6): 535-44. [14] DUAN T, SMITH A J, VERKMAN A S. Complement-independent bystander injury in AQP4-IgG seropositive neuromyelitis optica produced by antibody-dependent cellular cytotoxicity [J]. Acta Neuropathol Commun, 2019, 7(1): 112. [15] SABATINO J J, JR., PRöBSTEL A K, ZAMVIL S S. B cells in autoimmune and neurodegenerative central nervous system diseases [J]. Nat Rev Neurosci, 2019, 20(12): 728-45. [16] PITTOCK S J, ZEKERIDOU A, WEINSHENKER B G. Hope for patients with neuromyelitis optica spectrum disorders - from mechanisms to trials [J]. Nat Rev Neurol, 2021, 17(12): 759-73. [17] WILSON R, MAKUCH M, KIENZLER A K, et al. Condition-dependent generation of aquaporin-4 antibodies from circulating B cells in neuromyelitis optica [J]. Brain, 2018, 141(4): 1063-74. [18] SIRIRATNAM P, HUDA S, BUTZKUEVEN H, et al. A comprehensive review of the advances in neuromyelitis optica spectrum disorder [J]. Autoimmun Rev, 2023, 22(12): 103465. [19] CHIHARA N, ARANAMI T, SATO W, et al. Interleukin 6 signaling promotes anti-aquaporin 4 autoantibody production from plasmablasts in neuromyelitis optica [J]. Proc Natl Acad Sci U S A, 2011, 108(9): 3701-6. [20] HOSHINO Y, NOTO D, SANO S, et al. Dysregulated B cell differentiation towards antibody-secreting cells in neuromyelitis optica spectrum disorder [J]. J Neuroinflammation, 2022, 19(1): 6. [21] NISHIYAMA S, ITO T, MISU T, et al. A case of NMO seropositive for aquaporin-4 antibody more than 10 years before onset [J]. Neurology, 2009, 72(22): 1960-1. [22] JARIUS S, WILDEMANN B. AQP4 antibodies in neuromyelitis optica: diagnostic and pathogenetic relevance [J]. Nat Rev Neurol, 2010, 6(7): 383-92. [23] ZEKA B, HASTERMANN M, KAUFMANN N, et al. Aquaporin 4-specific T cells and NMO-IgG cause primary retinal damage in experimental NMO/SD [J]. Acta Neuropathol Commun, 2016, 4(1): 82. [24] ZEKA B, HASTERMANN M, HOCHMEISTER S, et al. Highly encephalitogenic aquaporin 4-specific T cells and NMO-IgG jointly orchestrate lesion location and tissue damage in the CNS [J]. Acta Neuropathol, 2015, 130(6): 783-98. [25] NURIEVA R I, CHUNG Y. Understanding the development and function of T follicular helper cells [J]. Cell Mol Immunol, 2010, 7(3): 190-7. [26] BRADL M, MISU T, TAKAHASHI T, et al. Neuromyelitis optica: pathogenicity of patient immunoglobulin in vivo [J]. Ann Neurol, 2009, 66(5): 630-43. [27] CHANG H, CONG H, WANG H, et al. Thymic Involution and Altered Naive CD4 T Cell Homeostasis in Neuromyelitis Optica Spectrum Disorder [J]. Front Immunol, 2021, 12: 645277. [28] VARRIN-DOYER M, SPENCER C M, SCHULZE-TOPPHOFF U, et al. Aquaporin 4-specific T cells in neuromyelitis optica exhibit a Th17 bias and recognize Clostridium ABC transporter [J]. Ann Neurol, 2012, 72(1): 53-64. [29] LINHARES U C, SCHIAVONI P B, BARROS P O, et al. The ex vivo production of IL-6 and IL-21 by CD4+ T cells is directly associated with neurological disability in neuromyelitis optica patients [J]. J Clin Immunol, 2013, 33(1): 179-89. [30] KEBIR H, KREYMBORG K, IFERGAN I, et al. Human TH17 lymphocytes promote blood-brain barrier disruption and central nervous system inflammation [J]. Nat Med, 2007, 13(10): 1173-5.

Comments (0)
Sign in to leave a comment
Project Tasks16
Implement Theme & Global Styles
As a Frontend Developer, I want to implement the garnet-mg design system — color tokens (#9B111E primary, #50C878 accent, #0D0A0B bg), Merriweather/Open Sans typography, glassmorphism utilities, animated radial gradient root background, grain texture overlay, and reusable CSS custom properties — so that all pages inherit a consistent visual identity matching the mock designs. Remove any scaffold pages not present in the design (e.g. welcome page, dashboard/overview, dashboard/ai-assistant, dashboard/settings). This task must be completed before all page implementation tasks.
Implement Dataset Upload API
As a Backend Developer, I want to implement FastAPI endpoints for dataset upload (scRNAseq, scTCR, scBCR, Bulk TCR files) including multipart file upload support, file type validation (.h5ad, .loom, .csv, .tsv, .fastq.gz, .bam), 50GB per-file limit enforcement, metadata storage in MySQL, and file storage in MongoDB/object store. Endpoints: POST /datasets/upload, GET /datasets/{id}/status. Supports the Upload page and Upload Queue Panel.
Implement GEO Integration API
As a Backend Developer, I want to implement FastAPI endpoints to search and import healthy control samples from the NCBI GEO database so that Data Analysts can supplement patient data for comparative analysis. Endpoints: GET /geo/search?query=, POST /geo/import (by GEO series ID), GET /geo/datasets. Results stored in MySQL with integration status tracking.
Build Home Page
As a Frontend Developer, I want to implement the Home page based on the existing v2 JSX design so that Researchers can explore the interactive 3D immune landscape visualization. The page includes: NavBar (frosted-glass sticky), Hero (Three.js/WebGL 3D immune terrain with CD8+/CD4+/B/NK cell clusters, garnet-to-emerald gradient transitions, cluster tooltips), ResearchMissionBanner, ImmuneDataHighlights (stats row with animated counters), WorkflowOverview (animated stepper), FeaturedAnalysisModules (3-column card grid), DataIntegrationVisual (animated data-flow diagram), ValidationPipeline (pipeline diagram + validation runs table), QuickAccessCTA, and Footer. On mobile: 3D canvas degrades to static image with CSS animation. Links to: Upload page, Analysis page.
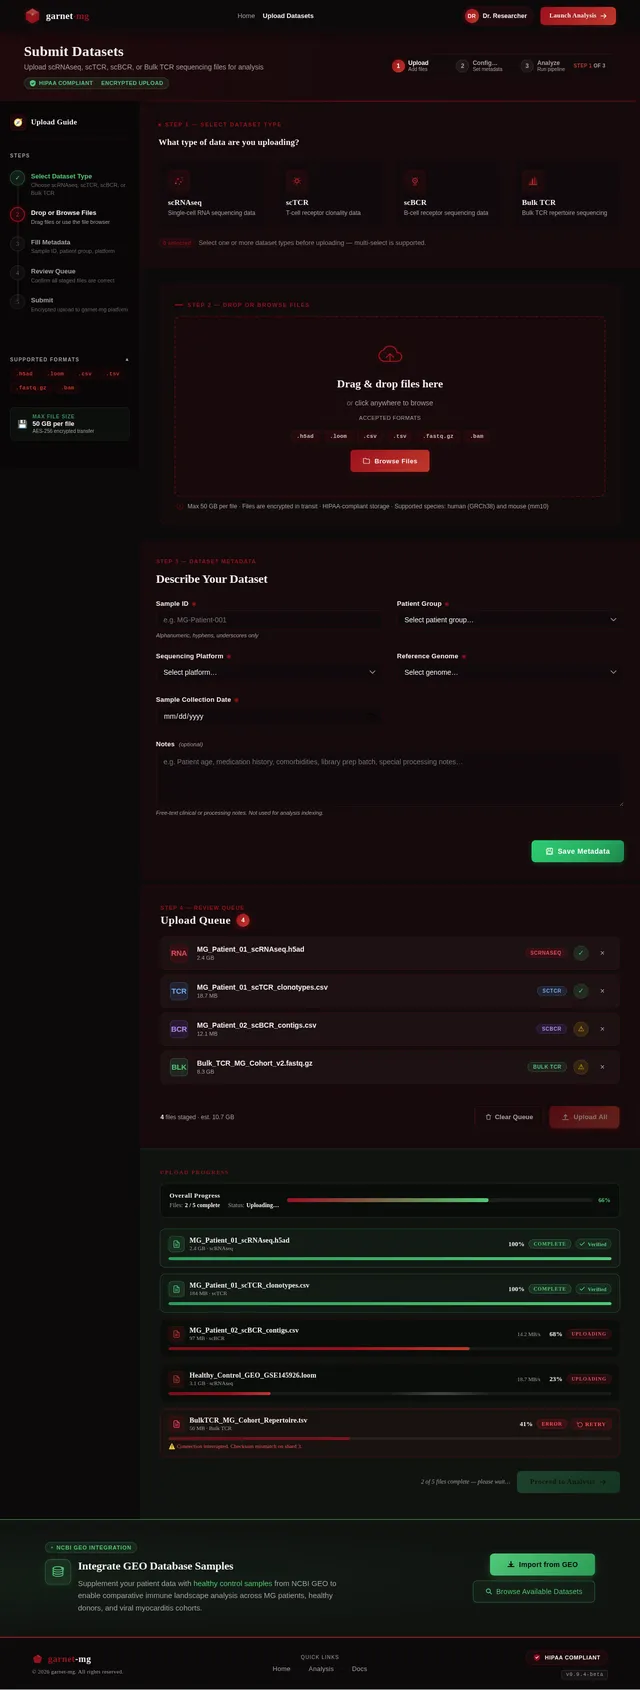
Build Upload Page
As a Frontend Developer, I want to implement the Upload page based on the existing v2 JSX design so that Researchers can submit scRNAseq, scTCR, scBCR, and Bulk TCR sequencing datasets. The page includes: TopBar (frosted-glass, breadcrumb), UploadPageHeader (page title, HIPAA chip, 3-step progress indicator), UploadSidebar (upload guide checklist, supported formats, max file size), DatasetTypeSelector (4 toggleable cards), FileDropZone (drag-and-drop with garnet dashed border), MetadataForm (2-column grid: Sample ID, Patient Group, Platform, Reference Genome, Date, Notes), UploadQueuePanel (staged files list with metadata completeness), UploadProgressTracker (per-file progress bars, garnet-to-emerald on complete), GEOIntegrationBanner, Footer. On mobile: sidebar collapses to horizontal step strip. Navigates from Home; leads to Analysis page.
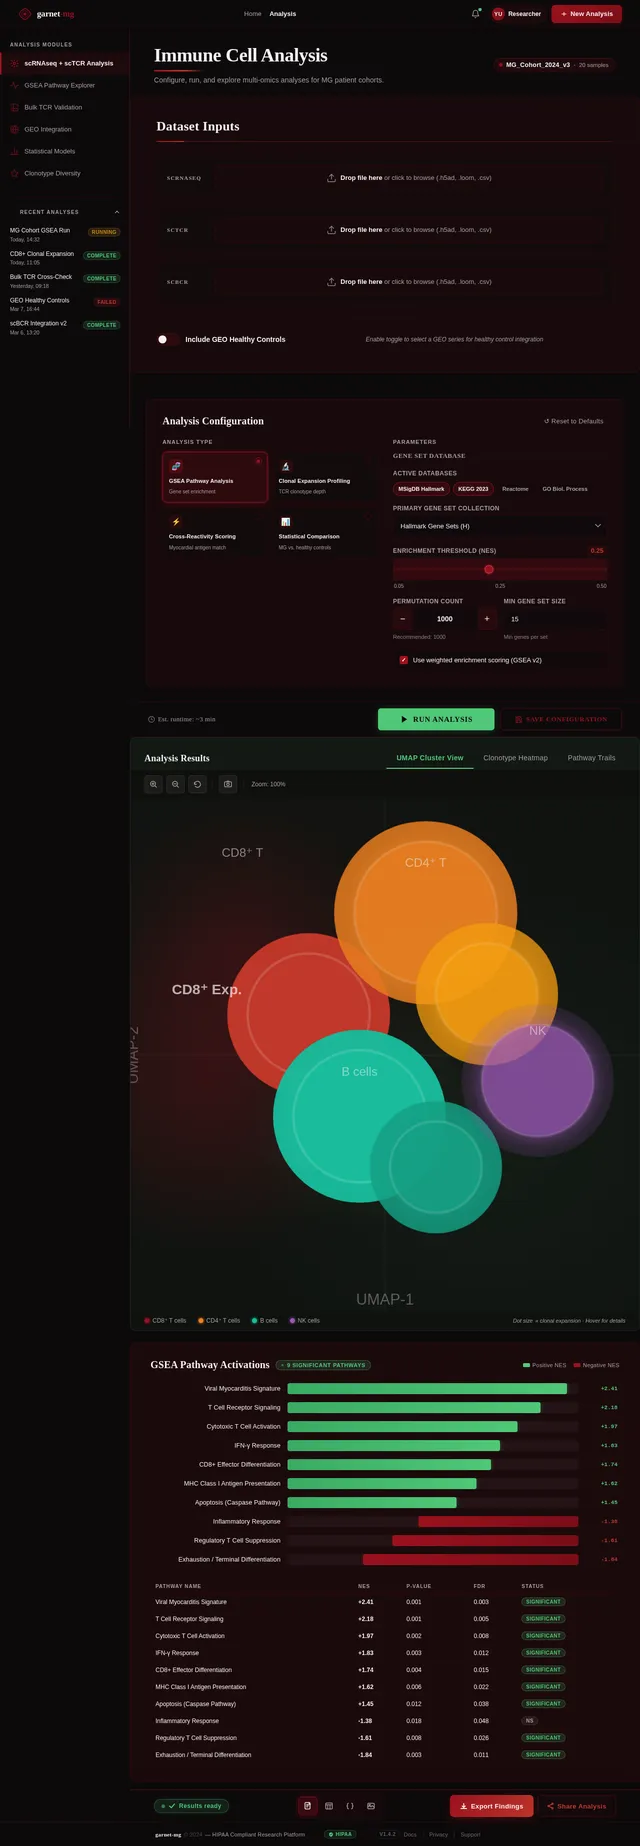
Build Analysis Page
As a Frontend Developer, I want to implement the Analysis page based on the existing v2 JSX design so that Researchers and Data Analysts can configure and run multi-omics analyses. The page includes: AnalysisTopBar (frosted-glass, breadcrumb, notification bell), AnalysisSidebar (module nav: scRNAseq+scTCR, GSEA, Bulk TCR, GEO Integration, Statistical Models, Clonotype Diversity; recent analyses list with status badges), AnalysisPageHeader (title, subtitle, dataset status chip), DatasetInputPanel (scRNAseq/scTCR/scBCR dropzones, GEO toggle), AnalysisConfigPanel (analysis type radio cards, dynamic parameter form), RunAnalysisCTA (estimated runtime, Run Analysis button with progress state, Save Configuration), ResultsVisualizationPanel (UMAP/Heatmap/Pathway tabs, interactive scatter plot, cluster tooltips), GSEAPathwayOutput (ranked bar chart, pathway detail drawer, data table), AnalysisExportBar (format icons, Export Findings button), AnalysisFooter. Navigates from Upload; leads to Results.
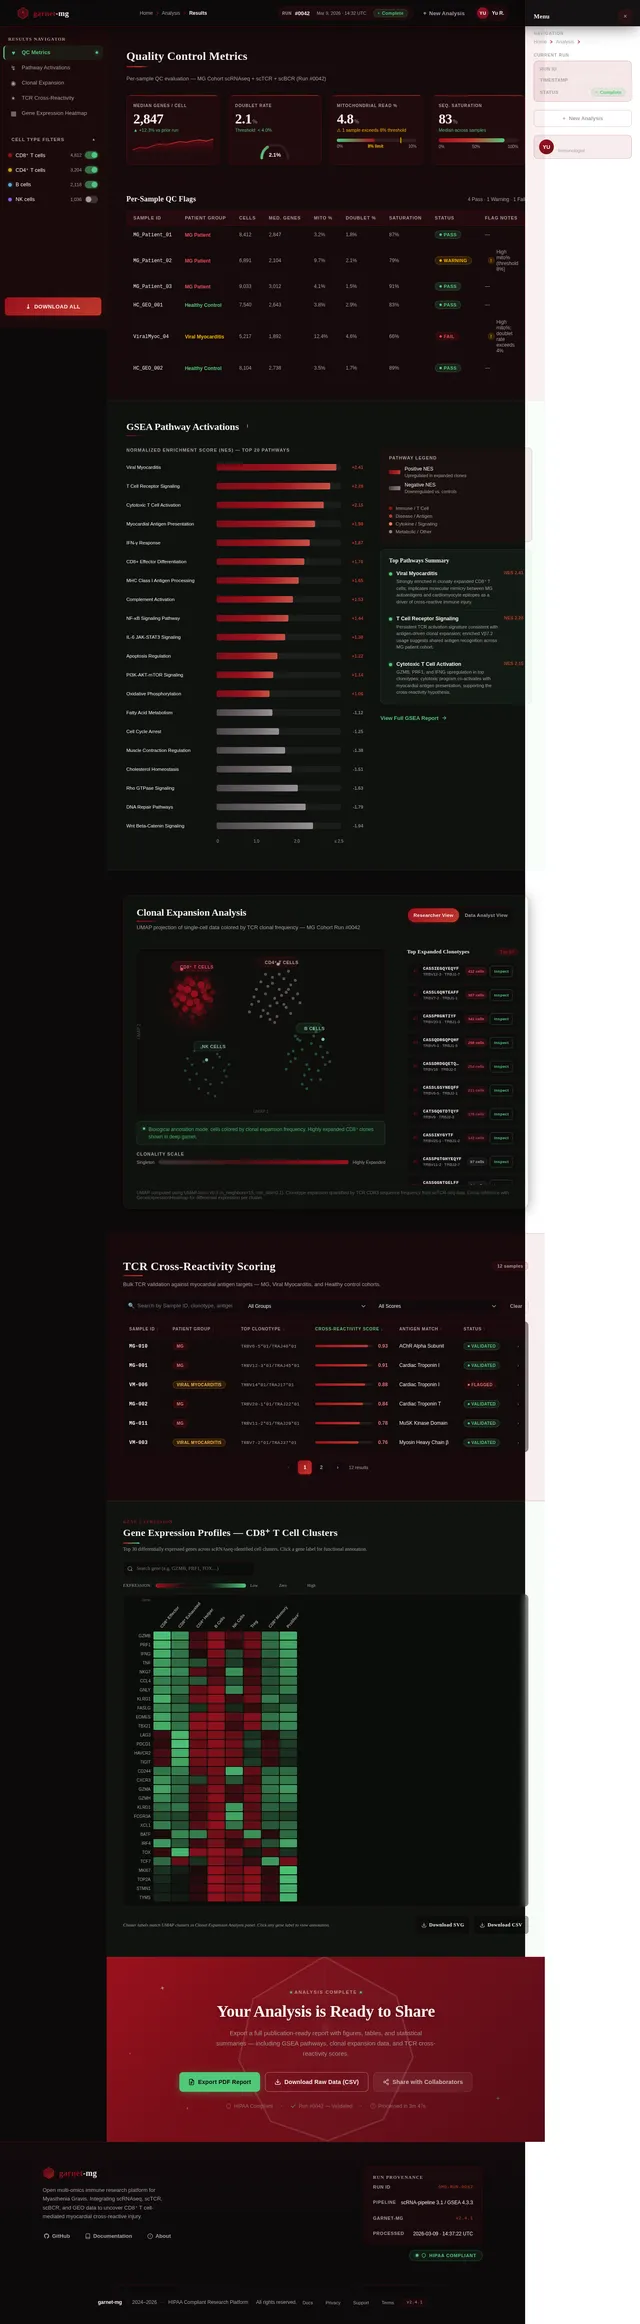
Build Results Page
As a Frontend Developer, I want to implement the Results page based on the existing v2 JSX design so that Researchers can view pathway activations and analysis outcomes. The page presents GSEA enrichment results, UMAP cluster visualizations, clonotype expansion data, and statistical summaries for the completed analysis run. Includes navigation to Validation page and Report export. Navigates from Analysis; leads to Validation and Report pages.
Build Validation Page
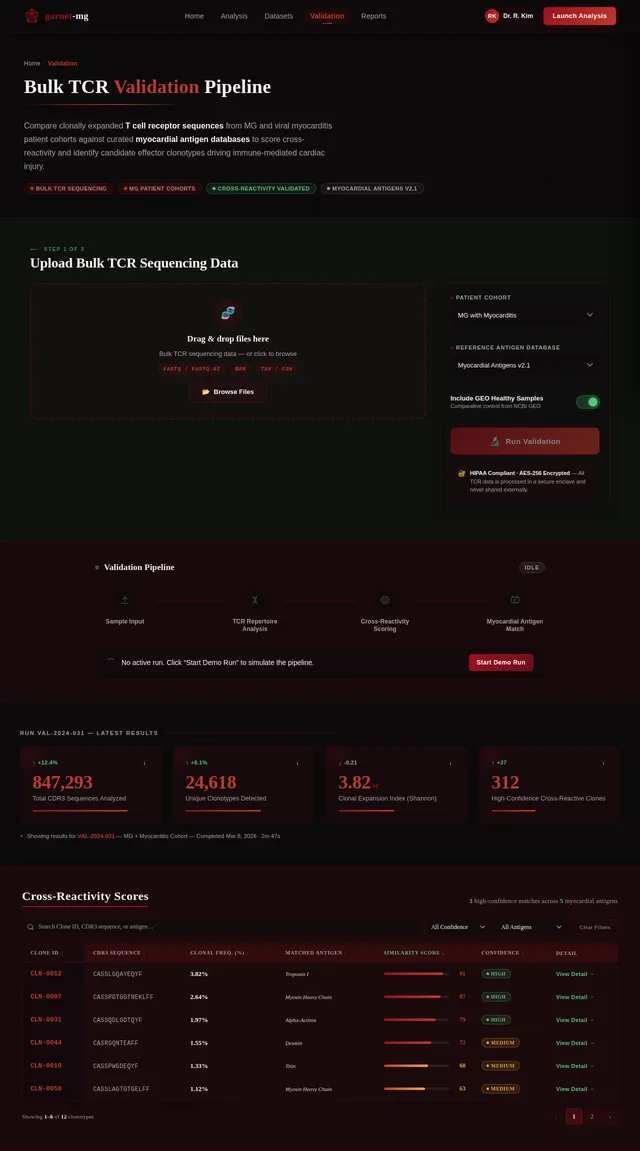
As a Frontend Developer, I want to implement the Validation page based on the existing v2 JSX design so that Researchers can compare clonally expanded TCR sequences from MG patients against myocardial antigen databases to score cross-reactivity. The page includes: NavBar (Validation active state), ValidationPageHero (breadcrumb, Merriweather headline 'Bulk TCR Validation Pipeline', garnet rule, subheadline, tag pills, gem watermark), ValidationUploadPanel (drag-and-drop for FASTQ/BAM/TSV, cohort dropdown, antigen database selector, GEO toggle, Run Validation CTA), PipelineStatusTracker (4-stage animated pipeline), TCRRepertoireStats (4 metric cards with animated counters), CrossReactivityScoreTable (sortable/filterable table with CDR3/antigen/score/confidence columns), ClonotypeDiversityChart (stacked bar + radar chart), MyocardialAntigenMatchPanel (antigen heatmap + top-5 summary), ValidationRunHistory (card list with status badges), ExportReportCTA, Footer. Navigates from Results; leads to Report.
Build Data Integration Page
As a Frontend Developer, I want to implement the Data Integration page based on the existing v2 JSX design so that Data Analysts can import GEO samples and merge datasets for comparative analysis. The page includes: GEO sample import interface, dataset merge controls, QC metric previews, and integration status tracking. Navigates from Home; leads to Analysis page.
Build Report Page
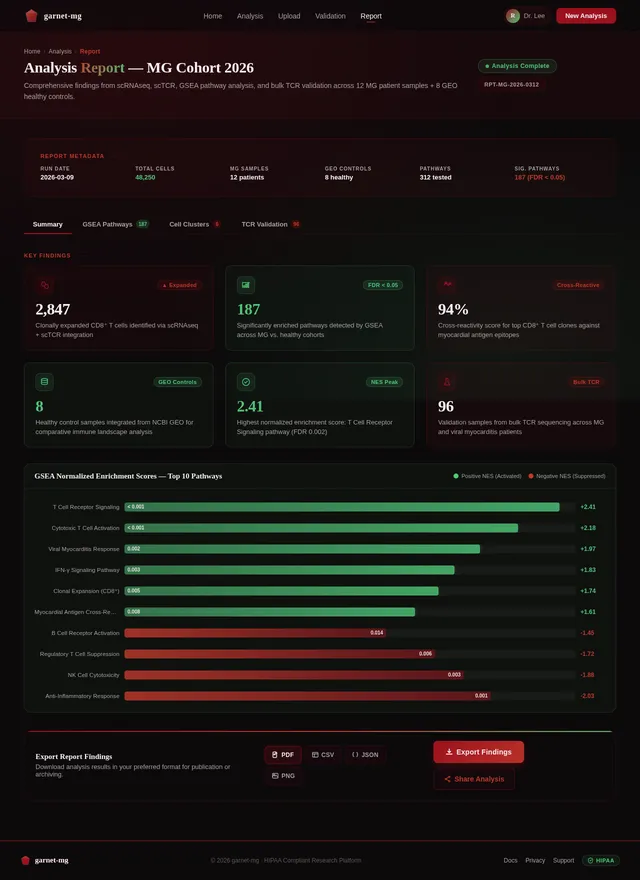
As a Frontend Developer, I want to implement the Report page based on the existing v2 JSX design so that Researchers and Data Analysts can export and review their analysis findings. The page includes a structured report viewer showing GSEA results, TCR cross-reactivity scores, clonotype data, and export options (PDF, CSV, JSON). Navigates from Validation; export triggers file download.
Implement GSEA Analysis API
As a Backend Developer, I want to implement FastAPI endpoints to trigger and retrieve GSEA pathway analysis runs on uploaded scRNAseq/scTCR datasets so that Researchers can identify activated pathways in clonally expanded T cells. Endpoints: POST /analysis/gsea (params: gene set DB, threshold, permutations), GET /analysis/{run_id}/status, GET /analysis/{run_id}/results. Integrates with Langchain/LiteLLM for orchestration. Results include NES scores, p-values, FDR, enriched pathway lists.
Implement Bulk TCR Validation API
As a Backend Developer, I want to implement FastAPI endpoints to run the bulk TCR validation pipeline (Sample Input → TCR Repertoire Analysis → Cross-Reactivity Scoring → Myocardial Antigen Match) so that Researchers can validate cross-reactivity findings. Endpoints: POST /validation/run (cohort, antigen database, GEO toggle), GET /validation/{run_id}/status, GET /validation/{run_id}/results (CDR3 sequences, clonal frequency, similarity scores, confidence levels). Supports 500 MG + 100 viral myocarditis samples.
Implement Clonotype Analysis API
As a Backend Developer, I want to implement FastAPI endpoints for clonotype diversity analysis (Shannon entropy, Simpson index, Chao1, ACE, Observed clones, Coverage) and clonal expansion profiling across patient cohorts (MG+myocarditis, MG only, Healthy Control) so that Researchers can quantify immune repertoire dynamics. Endpoints: POST /analysis/clonotype, GET /analysis/{run_id}/diversity-metrics, GET /analysis/{run_id}/expansion-profile.
Implement Statistical Models API
As a Data Engineer, I want to implement backend endpoints for statistical comparison models (differential abundance testing, QC metrics computation, dataset merging/integration) so that Data Analysts can run comparative analyses between MG patient and GEO healthy control datasets. Endpoints: POST /analysis/statistical, GET /analysis/{run_id}/qc-metrics, POST /datasets/merge.
Implement Report Export API
As a Backend Developer, I want to implement FastAPI endpoints to generate and export analysis reports in PDF, CSV, JSON, and PNG formats so that Researchers can download and share their validation findings. Endpoints: POST /reports/generate (analysis_run_id, format), GET /reports/{report_id}/download. PDF includes GSEA results, TCR cross-reactivity scores, clonotype data, and charts.
Integrate AI Hypothesis Generation
As an AI Engineer, I want to integrate GPT-based LLM (via LiteLLM routing and Langchain) to provide AI-assisted hypothesis generation and user-friendly result interpretation on the Analysis and Results pages so that Researchers can receive contextual insights about their immune landscape findings. Implement: POST /ai/interpret (analysis_run_id), streaming response endpoint, prompt templates for GSEA/TCR cross-reactivity context.
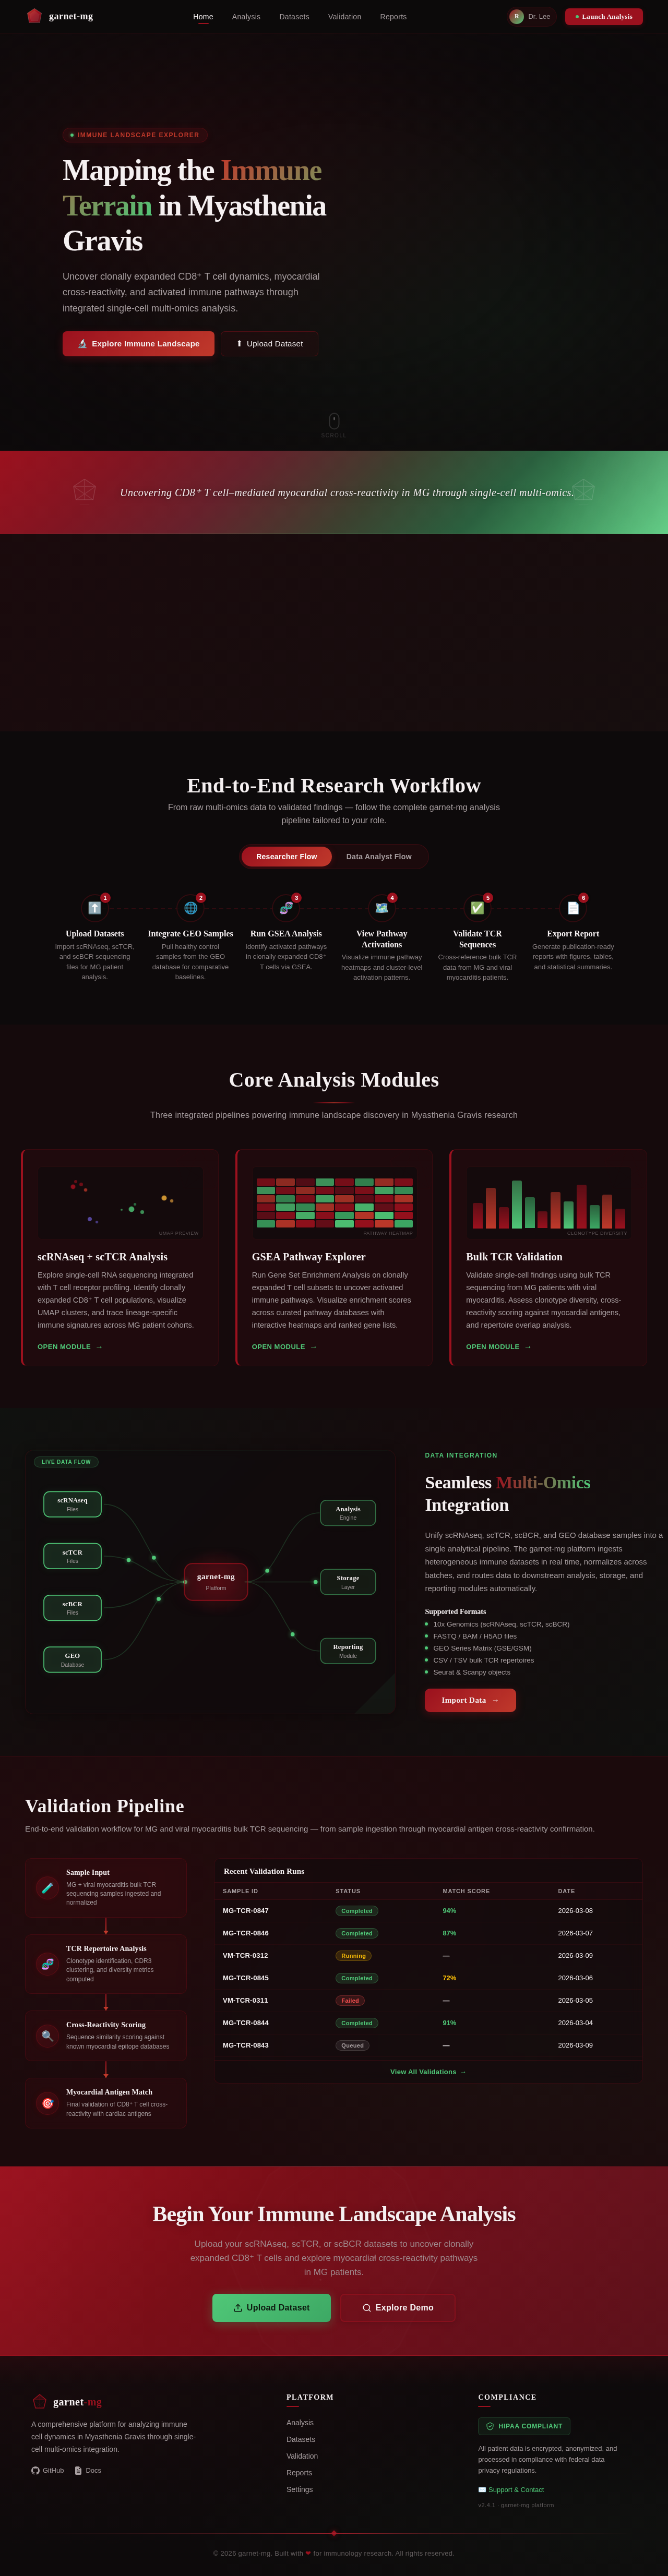
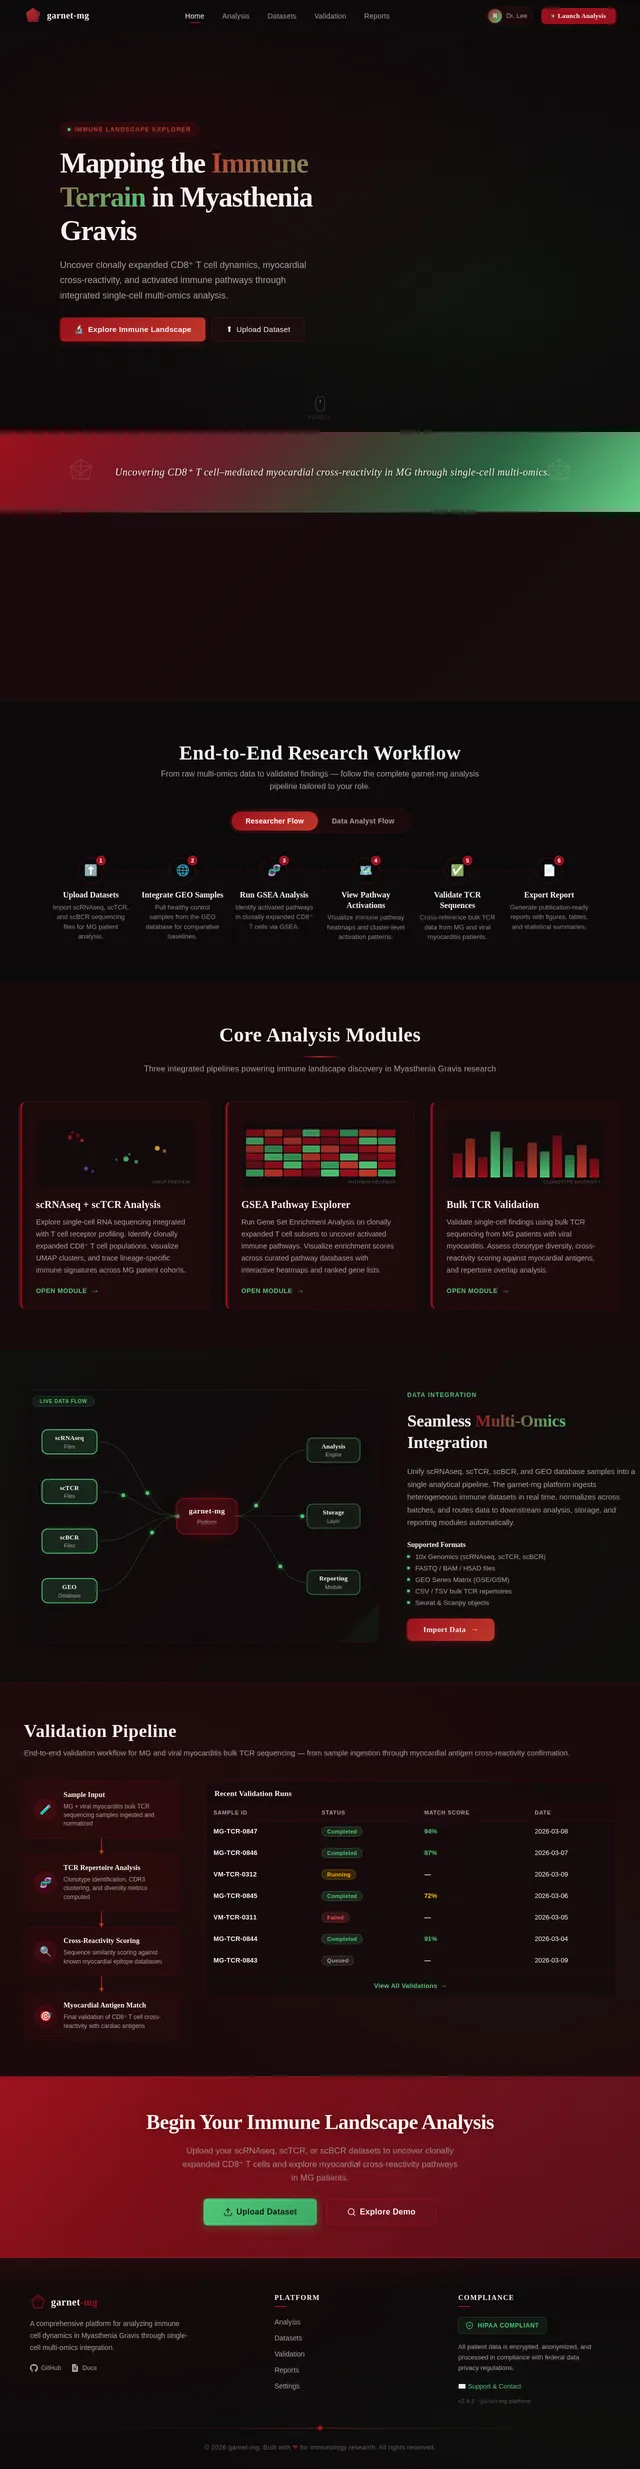
Mapping the Immune Terrain in Myasthenia Gravis
Uncover clonally expanded CD8⁺ T cell dynamics, myocardial cross-reactivity, and activated immune pathways through integrated single-cell multi-omics analysis.
Uncovering CD8⁺ T cell–mediated myocardial cross-reactivity in MG through single-cell multi-omics.
End-to-End Research Workflow
From raw multi-omics data to validated findings — follow the complete garnet-mg analysis pipeline tailored to your role.
Upload Datasets
Import scRNAseq, scTCR, and scBCR sequencing files for MG patient analysis.
Integrate GEO Samples
Pull healthy control samples from the GEO database for comparative baselines.
Run GSEA Analysis
Identify activated pathways in clonally expanded CD8⁺ T cells via GSEA.
View Pathway Activations
Visualize immune pathway heatmaps and cluster-level activation patterns.
Validate TCR Sequences
Cross-reference bulk TCR data from MG and viral myocarditis patients.
Export Report
Generate publication-ready reports with figures, tables, and statistical summaries.
Core Analysis Modules
Three integrated pipelines powering immune landscape discovery in Myasthenia Gravis research

scRNAseq + scTCR Analysis
Explore single-cell RNA sequencing integrated with T cell receptor profiling. Identify clonally expanded CD8⁺ T cell populations, visualize UMAP clusters, and trace lineage-specific immune signatures across MG patient cohorts.
GSEA Pathway Explorer
Run Gene Set Enrichment Analysis on clonally expanded T cell subsets to uncover activated immune pathways. Visualize enrichment scores across curated pathway databases with interactive heatmaps and ranked gene lists.
Bulk TCR Validation
Validate single-cell findings using bulk TCR sequencing from MG patients with viral myocarditis. Assess clonotype diversity, cross-reactivity scoring against myocardial antigens, and repertoire overlap analysis.
Data Integration
Seamless Multi-Omics Integration
Unify scRNAseq, scTCR, scBCR, and GEO database samples into a single analytical pipeline. The garnet-mg platform ingests heterogeneous immune datasets in real time, normalizes across batches, and routes data to downstream analysis, storage, and reporting modules automatically.
Supported Formats
- 10x Genomics (scRNAseq, scTCR, scBCR)
- FASTQ / BAM / H5AD files
- GEO Series Matrix (GSE/GSM)
- CSV / TSV bulk TCR repertoires
- Seurat & Scanpy objects
Validation Pipeline
End-to-end validation workflow for MG and viral myocarditis bulk TCR sequencing — from sample ingestion through myocardial antigen cross-reactivity confirmation.
| Sample ID | Status | Match Score | Date |
|---|---|---|---|
| MG-TCR-0847 | Completed | 94% | 2026-03-08 |
| MG-TCR-0846 | Completed | 87% | 2026-03-07 |
| VM-TCR-0312 | Running | — | 2026-03-09 |
| MG-TCR-0845 | Completed | 72% | 2026-03-06 |
| VM-TCR-0311 | Failed | — | 2026-03-05 |
| MG-TCR-0844 | Completed | 91% | 2026-03-04 |
| MG-TCR-0843 | Queued | — | 2026-03-09 |
| VM-TCR-0310 | Completed | 68% | 2026-03-03 |
Begin Your Immune Landscape Analysis
Upload your scRNAseq, scTCR, or scBCR datasets to uncover clonally expanded CD8⁺ T cells and explore myocardial cross-reactivity pathways in MG patients.
No comments yet. Be the first!