export-market
 Vishwajeet Musande
Build a complete B.Tech final-year project named **ExportWise AI: AI-Based Export Market Recommendation and Trade Analytics System**. I am a beginner, so generate the entire project step by step with working Python code, folder structure, installation commands, and clear instructions. ### Technology Stack - Frontend: Streamlit - Backend: Python - Machine Learning: scikit-learn - Data Processing: Pandas, NumPy - Visualization: Plotly, Matplotlib - Dataset: Real historical import-export data from UN Comtrade or another reliable public source ### Main Features 1. Modern professional website with sidebar navigation. 2. Export product selection (rice, chilli, cotton, spices, etc.). 3. AI-based country recommendation for Indian exporters. 4. Country-wise export market analysis. 5. Historical export trends and interactive graphs. 6. Export value prediction using Machine Learning. 7. Export profit calculator with shipping, duties and other costs. 8. Downloadable prediction reports. ### Machine Learning Requirements Implement and train these regression algorithms: - Linear Regression - Decision Tree Regressor - Random Forest Regressor Compare them using: - MAE - RMSE - R² Score - Actual vs Predicted Graph Also implement classification algorithms: - Logistic Regression - Decision Tree Classifier - Random Forest Classifier Predict export opportunity categories: High, Medium and Low. Evaluate classification models using: - Accuracy (%) - Precision - Recall - F1-score - Confusion Matrix ### Dataset Requirements Use genuine historical export data where available. Never invent real-world statistics. Provide a separate clearly labeled synthetic sample dataset only for initial testing. Prevent data leakage. Use chronological train-test splitting for time-series predictions and calculate all evaluation metrics on unseen test data. Clearly explain how opportunity labels are defined. Do not create labels directly from the same features used for prediction. ### Website Pages 1. Home Dashboard 2. Export Market Recommendation 3. Country Comparison 4. Export Demand Prediction 5. ML Algorithm Comparison 6. Profit Calculator 7. About Project ### Research Paper Requirements Include: - Problem Statement - Objectives - System Architecture - Methodology - Dataset Description - Algorithm Comparison - Experimental Results - Conclusion - Future Scope ### Development Instructions 1. Create the complete project folder structure. 2. Generate requirements.txt. 3. Create a working Streamlit application. 4. Implement data preprocessing. 5. Train and save ML models using joblib. 6. Integrate models into the website. 7. Add error handling and input validation. 8. Provide commands to run everything locally. 9. Make the website suitable for a final-year college demonstration. 10. Do not fabricate model accuracy or research results. Start by creating the minimum working project, then implement features one by one. Explain exactly which files to create and which commands to execute. Do not skip installation steps.


Comments (0)
Sign in to leave a comment
System Requirements
System Requirements Document for ExportWise AI
1. Introduction
ExportWise AI is an AI-Based Export Market Recommendation and Trade Analytics System built as a complete B.Tech final-year project for Vishwajeet Musande. Its intent is to help Indian exporters decide where to sell a chosen agricultural export product — rice, chilli, cotton, spices and similar goods — by combining genuine historical import-export data from UN Comtrade (or another reliable public source) with machine-learning evidence: country recommendations, country-wise market analysis, historical trend graphs, export value prediction, a profit calculator that accounts for shipping, duties and other costs, and downloadable prediction reports.
The audience is twofold. Indian exporters use the analytics to plan an export. Project evaluators — college examiners and reviewers — inspect the machine-learning comparison, the evaluation metrics and the research paper to confirm that results come from unseen test data and that no accuracy figure or research result has been fabricated.
The project is delivered as a working Streamlit application with a Python backend, scikit-learn models saved with joblib, Pandas/NumPy data processing, and Plotly/Matplotlib visualizations. It is written for a beginner: the complete folder structure, requirements.txt, installation commands and local run commands are part of the deliverable, and the build proceeds from a minimum working project to features one by one.
2. System Overview
ExportWise AI is a single Streamlit web application with sidebar navigation across seven pages: Home Dashboard, Export Market Recommendation, Country Comparison, Export Demand Prediction, ML Algorithm Comparison, Profit Calculator and About Project. All pages are openly reachable; no sign-in, account or role-based permission is part of the product.
The application is backed by a shared Python service that serves the data and model APIs the Streamlit pages call. Application-owned persistent data (the loaded historical and synthetic datasets, trained model artifacts and their evaluation records) is stored in MariaDB. A LiteLLM gateway, backed by its own PostgreSQL instance, is available to the backend for model-provider calls; it does not add product behavior. The React frontend service in the provisioned inventory is retained as infrastructure but the accepted product surface is the Streamlit application.
Two active human personas use the system: the Indian Exporter, who selects a product and consumes recommendations, comparisons, trends, predictions and profit calculations; and the Project Evaluator, who reviews the ML algorithm comparison, the metrics and the research paper for the final-year demonstration.
Accepted behavior covers: product selection; AI-based country recommendation for Indian exporters; country-wise export market analysis; historical export trends as interactive graphs; ML export value prediction; an export profit calculator with shipping, duties and other costs; downloadable prediction reports; training and comparison of Linear Regression, Decision Tree Regressor and Random Forest Regressor on MAE, RMSE, R² Score and an Actual vs Predicted graph; training and comparison of Logistic Regression, Decision Tree Classifier and Random Forest Classifier predicting High/Medium/Low export opportunity with Accuracy (%), Precision, Recall, F1-score and a Confusion Matrix; a clearly labeled synthetic sample dataset for initial testing only; chronological train-test splitting with all metrics on unseen test data; a documented opportunity-label definition that does not reuse prediction features; and a research paper with Problem Statement, Objectives, System Architecture, Methodology, Dataset Description, Algorithm Comparison, Experimental Results, Conclusion and Future Scope.
Removed from scope
- None. No concept from the authoritative requirement thread was removed or replaced.
2a. Product Interpretation and Delivery Boundary
ExportWise AI is delivered as a first-party Streamlit application. Every page is public and anonymous: an exporter or an evaluator opens the app and works immediately, with no account creation, sign-in or session identity. This matches the source, which never asks for accounts, and the accepted access contract, which marks every page none.
The product's data authority is external and read-only. Historical trade figures come from UN Comtrade or another reliable public source and are never invented; a separate, clearly labeled synthetic sample dataset exists only so the project can be tested before real data is loaded. The application owns the derived artifacts — preprocessed tables, trained models saved with joblib, and evaluation records computed on unseen test data — and stores them in MariaDB so the pages read consistent, reproducible results.
The backend is a shared Python service that exposes the data, recommendation, prediction, comparison and report endpoints the Streamlit pages consume. The LiteLLM gateway and its PostgreSQL store are provisioned infrastructure for backend model-provider calls and carry no product requirement. The React frontend service remains in the deployment inventory but is not the accepted product surface.
Everything described in this document is current. No future-horizon capability is claimed as delivered.
2b. Source Content Inventory
The reference directive designates UN Comtrade (or another reliable public source) as an authoritative content_source for genuine historical import-export data. The following factual structure is what the product must carry from that source; no specific numeric values are asserted here because none were supplied, and none may be invented.
- Source: UN Comtrade historical import-export records, or another reliable public public trade-statistics source.
- Trade record fields required for analysis: reporting country (exporter), partner country (destination market), product/commodity, trade flow (export), period (year), trade value, and quantity where available.
- Product coverage: at minimum rice, chilli, cotton and spices, plus other products present in the source data.
- Country coverage: destination markets for Indian exports as recorded in the source.
- Time coverage: the historical years present in the loaded extract, used for trend graphs and chronological splitting.
- Synthetic sample dataset: a separate file, clearly labeled as synthetic and for initial testing only, structurally matching the real trade records so the pipeline can run before real data is loaded.
2c. Page Content and Component Coverage
Home Dashboard
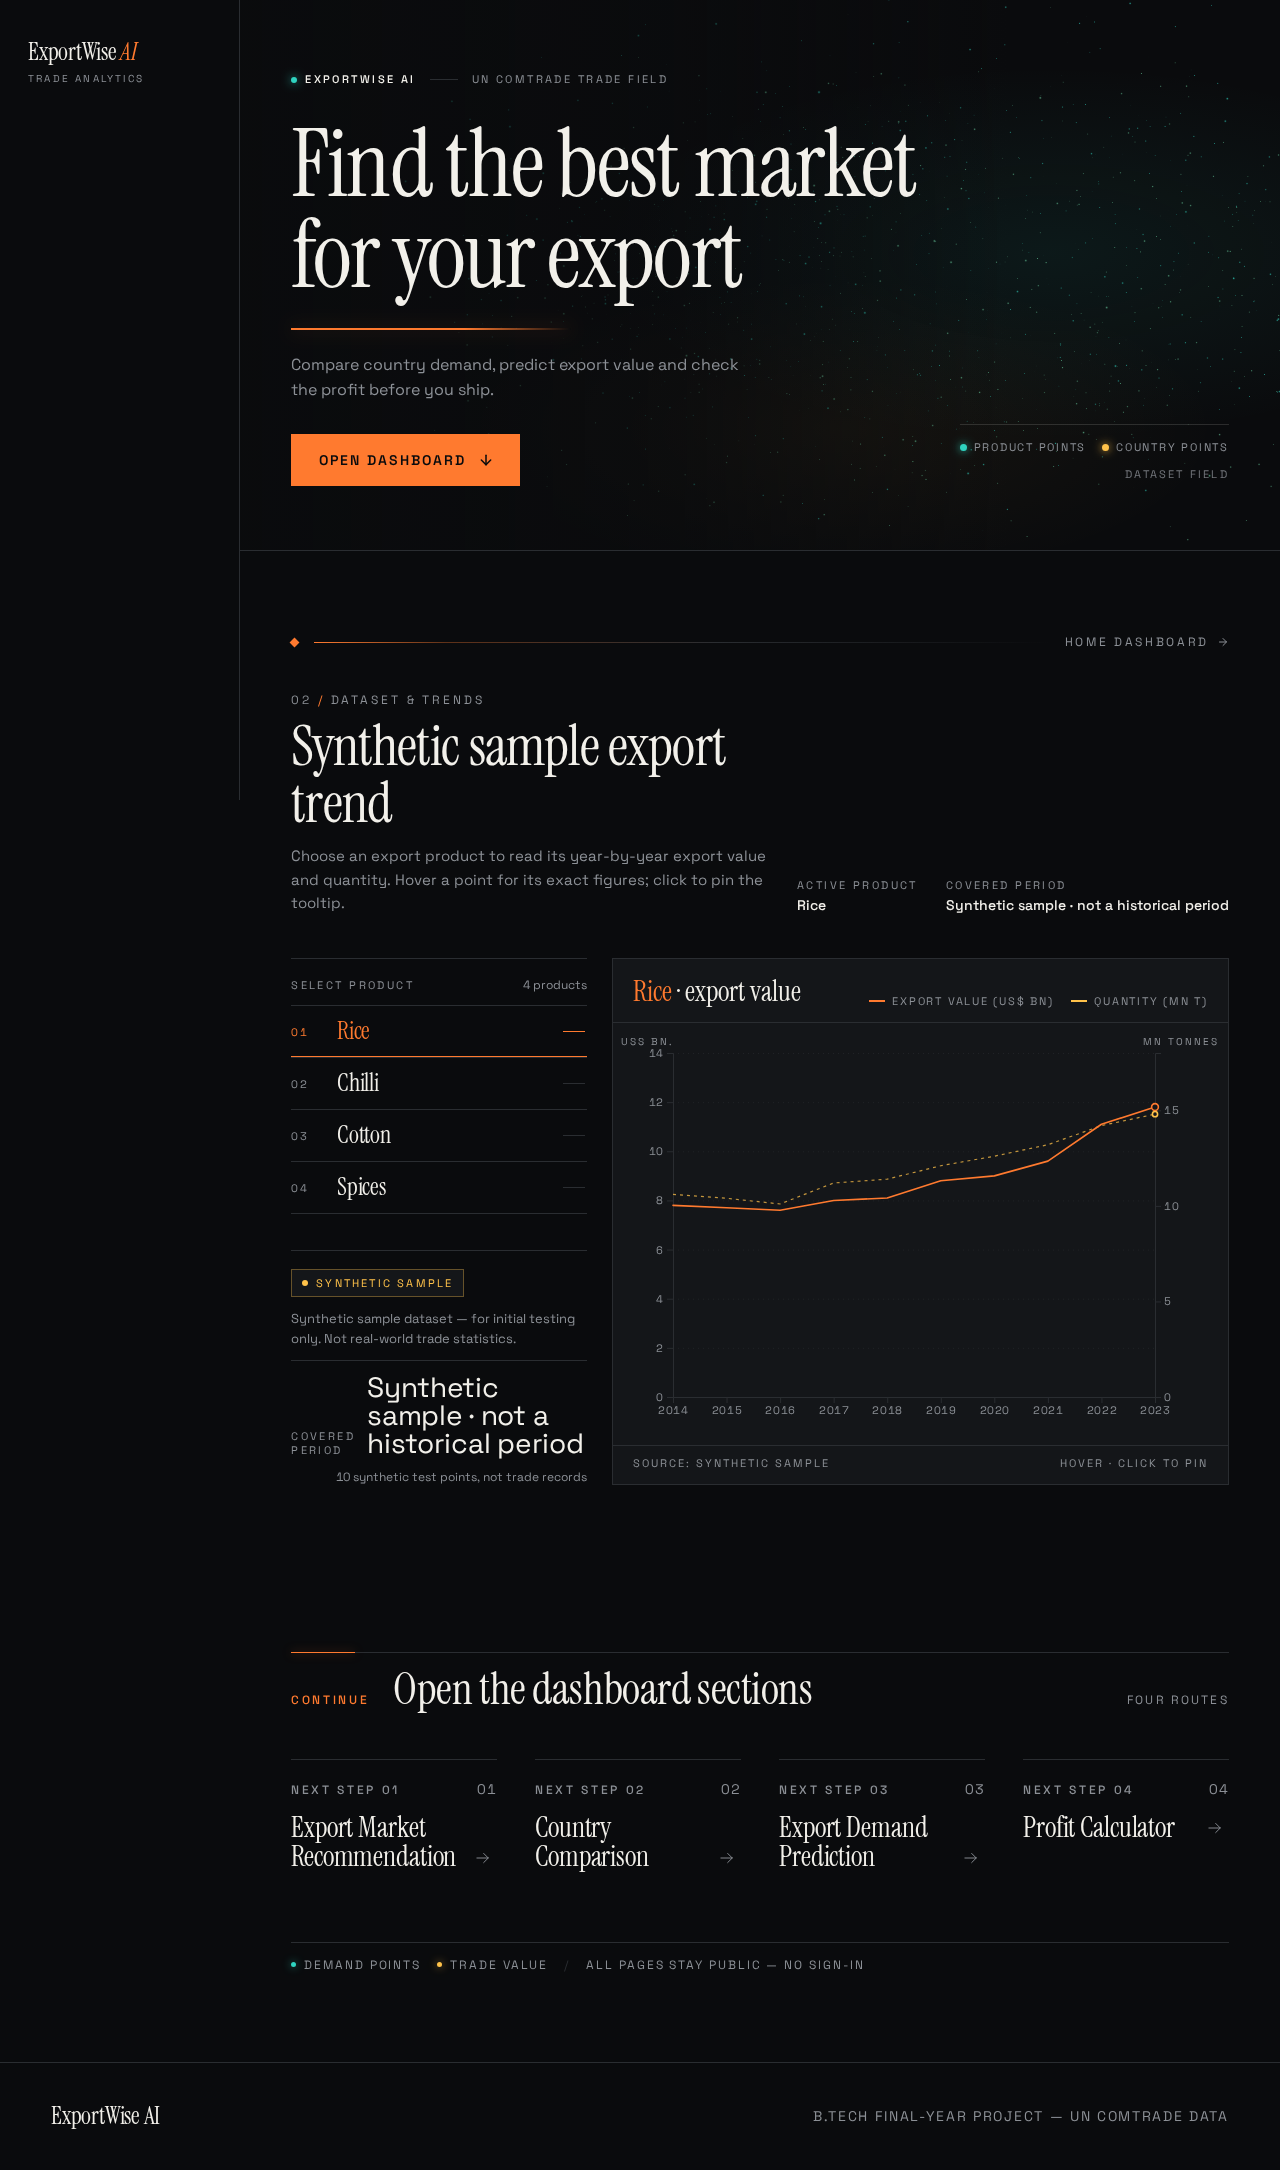
- Information and state: the anonymous entry surface. Shows the product's purpose, the currently active export product, headline historical export trend graphs, and a compact summary of the loaded dataset (source label — real or synthetic — and the covered period).
- Primary actions: choose or change the active export product; open the dashboard sections that lead to recommendation, comparison, prediction and profit work.
- Supporting actions: read the dataset source label; follow sidebar navigation to any other page.
- Domain entities: trade record, product, destination country, period, trade value.
- Component responsibilities: hero region carrying the entry headline, subline and "Open dashboard" call to action; product selector; trend chart component (interactive, Plotly); dataset-provenance badge that states plainly whether real or synthetic data is loaded.
- States: loading while the dataset summary and trends are fetched; empty when no dataset is loaded, with a clear instruction to load real or synthetic data; success with trends rendered; error when the data source is unreachable or malformed, with a retry and the reason shown; recovery returns to the last successfully loaded product.
Export Market Recommendation
- Information and state: ranked AI country recommendations for the selected product, each row showing country, a recommendation score or rank, and the supporting market signal; the active product is marked.
- Primary actions: select the export product; request recommendations; read the ranked list.
- Supporting actions: open a country's detail in Country Comparison; move to Export Demand Prediction for the top recommendation.
- Domain entities: product, destination country, recommendation rank/score, opportunity category (High/Medium/Low).
- Component responsibilities: product selector; recommendation table rendered as museum-label rows with tabular numerals and hairline rules; top recommendation highlighted with the single accent; classifier output component supplying the opportunity category.
- States: loading while the model scores countries; empty when the selected product has no data; success with a ranked list; error when the model artifact is missing or the input is invalid, with a message naming the missing artifact and a recovery instruction to run training; recovery re-runs the recommendation for the last valid product.
Country Comparison
- Information and state: side-by-side export market analysis for a selected product across chosen countries — trade values, trend direction and opportunity category per country.
- Primary actions: select the product; select two or more countries to compare; read the comparison.
- Supporting actions: adjust the comparison period; return to Export Market Recommendation.
- Domain entities: product, country, period, trade value, opportunity category.
- Component responsibilities: product selector; multi-country selector; comparison chart component (interactive); comparison table with tabular numerals; validation component that requires at least two countries.
- States: loading while comparison data is fetched; empty when fewer than two countries are selected or no data exists for the product; success with chart and table; error when the data request fails, with the reason and a retry; recovery preserves the previous selection.
Export Demand Prediction
- Information and state: the ML-predicted export value for a chosen product and destination country under stated inputs, the model used, and the opportunity category; a downloadable prediction report reflecting exactly the displayed prediction.
- Primary actions: enter or select the prediction inputs (product, destination country, period and any model inputs the trained regressor requires); run the prediction; download the prediction report.
- Supporting actions: read which regression model produced the value; move to Profit Calculator with the predicted value.
- Domain entities: product, country, period, predicted export value, model identity, opportunity category, prediction report.
- Component responsibilities: input form with validation; prediction result panel; model-identity label; report-generation component producing the downloadable file; error display.
- States: loading while the model scores; empty before inputs are complete; success with the predicted value and an enabled download; error on invalid input (with the specific field named) or a missing model artifact (with a recovery instruction to run training); recovery returns the form with prior valid inputs intact.
ML Algorithm Comparison
- Information and state: regression comparison of Linear Regression, Decision Tree Regressor and Random Forest Regressor with MAE, RMSE and R² Score plus an Actual vs Predicted graph; classification comparison of Logistic Regression, Decision Tree Classifier and Random Forest Classifier with Accuracy (%), Precision, Recall, F1-score and a Confusion Matrix; a statement that all metrics are computed on unseen test data from a chronological split; the documented opportunity-label definition.
- Primary actions: view the regression metrics table and the Actual vs Predicted graph; view the classification metrics table and the Confusion Matrix; read the label definition.
- Supporting actions: switch between regression and classification views; read the split description.
- Domain entities: model, metric, split, label definition, confusion matrix.
- Component responsibilities: metrics tables with tabular numerals; Actual vs Predicted chart component; Confusion Matrix component; label-definition panel; provenance note stating metrics come from unseen test data.
- States: loading while evaluation records are fetched; empty when no evaluation has been run, with an instruction to run training; success with tables and graphs; error when evaluation records are missing or inconsistent, with the reason shown; recovery reloads the last successful evaluation.
Profit Calculator
- Information and state: the computed export profit from entered revenue-side and cost-side figures — shipping, duties and other costs — with the cost breakdown visible.
- Primary actions: enter the export value or quantity and price, shipping cost, duty and other costs; calculate profit.
- Supporting actions: prefill the export value from a prediction; clear and re-enter inputs.
- Domain entities: export value, shipping cost, duty, other costs, total cost, profit.
- Component responsibilities: numeric input form with validation; cost-breakdown table; profit result panel; validation messages.
- States: loading is not applicable beyond initial render; empty before inputs are entered; success with profit and breakdown; error on invalid or negative inputs, with the offending field named; recovery keeps valid entries and clears only the invalid one.
About Project
- Information and state: the research paper content — Problem Statement, Objectives, System Architecture, Methodology, Dataset Description, Algorithm Comparison, Experimental Results, Conclusion and Future Scope — plus the dataset description distinguishing real UN Comtrade data from the clearly labeled synthetic sample dataset.
- Primary actions: read each research-paper section; read the dataset description.
- Supporting actions: navigate between sections; cross-reference the ML Algorithm Comparison page for the underlying metrics.
- Domain entities: research-paper section, dataset description, system architecture description.
- Component responsibilities: section navigation; long-form content panels; dataset-provenance panel; architecture description component.
- States: static content render; error only if the content source fails to load, with a retry; no empty state because the content is part of the deliverable.
3. Functional Requirements
FR-1 — Product selection (explicit) As an Indian Exporter, I should select an export product such as rice, chilli, cotton or spices so that every analysis, recommendation and prediction is scoped to that product.
- Trigger/input: the exporter chooses a product from the selector on Home Dashboard, Export Market Recommendation, Country Comparison or Export Demand Prediction.
- Observable result: the active product is marked with the single accent and all downstream panels reload for that product.
- Access: public, no identity.
- Failure/recovery: if the product has no data, an empty state names the product and offers another selection; the previous valid product remains recoverable.
- Continuation: the exporter proceeds to recommendation, comparison, prediction or profit calculation for the selected product.
FR-2 — AI-based country recommendation (explicit) As an Indian Exporter, I should receive AI-based country recommendations for my selected product so that I know which destination markets to prioritize.
- Trigger/input: the exporter requests recommendations for the active product on Export Market Recommendation.
- Observable result: a ranked list of destination countries with the top recommendation highlighted, each row carrying its supporting market signal and opportunity category.
- Access: public, no identity.
- Failure/recovery: if the classifier artifact is missing or inputs are invalid, an error names the missing artifact and instructs the exporter to run training; the last valid ranking remains visible.
- Continuation: the exporter opens a country in Country Comparison or carries the top recommendation into Export Demand Prediction.
FR-3 — Country-wise export market analysis (explicit) As an Indian Exporter, I should view country-wise export market analysis so that I understand how each destination market performs for my product.
- Trigger/input: the exporter selects a product and one or more countries on Country Comparison.
- Observable result: trade values, trend direction and opportunity category per country, shown as a comparison chart and table.
- Access: public, no identity.
- Failure/recovery: fewer than two countries selected yields an empty state asking for a second country; a failed data request shows the reason and a retry that preserves the selection.
- Continuation: the exporter returns to recommendation or proceeds to prediction.
FR-4 — Historical export trends and interactive graphs (explicit) As an Indian Exporter, I should view historical export trends as interactive graphs so that I can see how demand for my product has moved over time.
- Trigger/input: the exporter opens Home Dashboard or Country Comparison with a product selected.
- Observable result: interactive Plotly trend graphs over the historical periods present in the loaded data.
- Access: public, no identity.
- Failure/recovery: if no dataset is loaded, an empty state instructs the exporter to load real or synthetic data; a malformed source shows an error with the reason and a retry.
- Continuation: the exporter uses the trend to inform recommendation, comparison or prediction.
FR-5 — Export value prediction with machine learning (explicit) As an Indian Exporter, I should predict export value with machine learning so that I can estimate what a destination market is worth before committing.
- Trigger/input: the exporter supplies the prediction inputs (product, destination country, period and the trained regressor's required inputs) on Export Demand Prediction.
- Observable result: a predicted export value, the identity of the regression model that produced it, and the opportunity category.
- Access: public, no identity.
- Failure/recovery: invalid input names the specific field; a missing model artifact instructs the exporter to run training; the form retains prior valid inputs on recovery.
- Continuation: the exporter downloads the prediction report or carries the value into Profit Calculator.
FR-6 — Export profit calculator (explicit) As an Indian Exporter, I should calculate export profit with shipping, duties and other costs so that I know whether a shipment is worthwhile.
- Trigger/input: the exporter enters export value (or quantity and price), shipping cost, duty and other costs on Profit Calculator.
- Observable result: total cost, profit and a visible cost breakdown.
- Access: public, no identity.
- Failure/recovery: negative or non-numeric entries are rejected with the offending field named; valid entries are preserved and only the invalid one is cleared.
- Continuation: the exporter revises inputs or returns to prediction to test another market.
FR-7 — Downloadable prediction reports (explicit) As an Indian Exporter, I should download a prediction report so that I can keep or share the prediction I generated.
- Trigger/input: after a successful prediction on Export Demand Prediction, the exporter activates the download.
- Observable result: a report file containing exactly the displayed prediction, its inputs, the model identity and the opportunity category.
- Access: public, no identity.
- Failure/recovery: the download control stays disabled until a prediction exists; a generation failure shows an error and allows re-running the prediction.
- Continuation: the exporter retains the report or returns to the prediction form.
FR-8 — Regression model training and comparison (explicit) As a Project Evaluator, I should see Linear Regression, Decision Tree Regressor and Random Forest Regressor trained and compared on MAE, RMSE and R² Score with an Actual vs Predicted graph so that I can judge which model performs best.
- Trigger/input: the evaluator opens ML Algorithm Comparison; the models are trained and saved with joblib before the page runs.
- Observable result: a regression metrics table for all three models and an Actual vs Predicted graph, all computed on unseen test data from a chronological split.
- Access: public, no identity.
- Failure/recovery: if evaluation records are absent, an empty state instructs the evaluator to run training; inconsistent records show the reason and reload the last successful evaluation.
- Continuation: the evaluator reads the classification comparison and the research paper.
FR-9 — Classification model training and comparison (explicit) As a Project Evaluator, I should see Logistic Regression, Decision Tree Classifier and Random Forest Classifier trained and compared on Accuracy (%), Precision, Recall, F1-score and a Confusion Matrix so that I can judge how well export opportunity is classified.
- Trigger/input: the evaluator opens ML Algorithm Comparison and selects the classification view.
- Observable result: a classification metrics table for all three models and a Confusion Matrix, computed on unseen test data.
- Access: public, no identity.
- Failure/recovery: missing evaluation records yield an empty state with a training instruction; a failed fetch shows the reason and a retry.
- Continuation: the evaluator cross-references the label definition and the research paper.
FR-10 — High/Medium/Low opportunity categories (explicit) As an Indian Exporter, I should see export opportunity classified as High, Medium or Low so that I can read market attractiveness at a glance.
- Trigger/input: the classifier scores a product-country pair on Export Market Recommendation or Export Demand Prediction.
- Observable result: one of High, Medium or Low shown with the recommendation or prediction.
- Access: public, no identity.
- Failure/recovery: if the classifier is unavailable, the category is omitted with a message rather than guessed.
- Continuation: the exporter uses the category alongside the recommendation and prediction.
FR-11 — Opportunity label definition (explicit) As a Project Evaluator, I should read how opportunity labels are defined so that I can confirm labels are not created directly from the prediction features.
- Trigger/input: the evaluator opens ML Algorithm Comparison or About Project.
- Observable result: a written label definition stating the rule used to assign High/Medium/Low and confirming that the label is not derived from the same features used for prediction.
- Access: public, no identity.
- Failure/recovery: if the definition is missing, the page states that it is unavailable rather than substituting an invented rule.
- Continuation: the evaluator compares the definition against the reported metrics.
FR-12 — Real historical data with labeled synthetic sample (explicit) As an Indian Exporter, I should see analyses built on genuine historical export data, with a clearly labeled synthetic sample dataset available only for initial testing, so that I can trust the figures.
- Trigger/input: the application loads the real UN Comtrade extract or, when real data is not yet available, the synthetic sample dataset.
- Observable result: a provenance badge on Home Dashboard and About Project stating plainly whether real or synthetic data is loaded; no real-world statistic is ever invented.
- Access: public, no identity.
- Failure/recovery: an unreachable or malformed source shows an error with the reason and a retry; the last successfully loaded dataset remains usable.
- Continuation: the exporter continues analysis knowing the data provenance.
FR-13 — Leakage-safe chronological evaluation (explicit) As a Project Evaluator, I should see that a chronological train-test split is used and that all metrics are computed on unseen test data so that I can trust the reported results.
- Trigger/input: training runs before the pages serve results.
- Observable result: the split description and the provenance note on ML Algorithm Comparison state the chronological split and that metrics come from unseen test data.
- Access: public, no identity.
- Failure/recovery: if the split cannot be established, training fails with a clear message rather than reporting metrics from training data.
- Continuation: the evaluator reads the metrics with confidence in their provenance.
FR-14 — Research paper content (explicit) As a Project Evaluator, I should read the research paper with Problem Statement, Objectives, System Architecture, Methodology, Dataset Description, Algorithm Comparison, Experimental Results, Conclusion and Future Scope so that I can assess the project academically.
- Trigger/input: the evaluator opens About Project.
- Observable result: each named section rendered, with Experimental Results reflecting the actual computed metrics and no fabricated figures.
- Access: public, no identity.
- Failure/recovery: if content fails to load, an error with a retry is shown.
- Continuation: the evaluator cross-references ML Algorithm Comparison.
FR-15 — Beginner-ready project delivery (explicit)
As a Project Evaluator, I should receive the complete folder structure, requirements.txt, a working Streamlit application, data preprocessing, joblib-saved models, model integration, error handling, input validation and local run commands so that the project can be installed and demonstrated.
- Trigger/input: the evaluator follows the documented installation and run commands.
- Observable result: the Streamlit application starts locally and every page renders with the trained models loaded.
- Access: public, no identity.
- Failure/recovery: missing packages are resolved by installing
requirements.txt; missing models are resolved by running training; each failure message names the missing step. - Continuation: the evaluator demonstrates the application.
FR-16 — Dataset and model loading prerequisite (required_inference) As an Indian Exporter, I should have the real or labeled synthetic dataset loaded and the models trained and saved with joblib before prediction pages run so that predictions and recommendations are available.
- Trigger/input: the application starts and the backend loads the dataset and model artifacts.
- Observable result: pages serve results; if artifacts are absent, the affected page shows an empty state naming the missing step.
- Access: public, no identity.
- Failure/recovery: the empty state instructs the user to load data or run training; recovery re-checks artifacts on reload.
- Continuation: the user proceeds with the page's primary action.
4. User Personas
Indian Exporter
- Product context: an exporter of Indian agricultural goods — rice, chilli, cotton, spices and similar products — planning where to sell. They work anonymously in the Streamlit application and move between pages as a single continuous session.
- Primary goal: choose the best destination market for a product and confirm the shipment is profitable before committing.
- Distinct accepted responsibilities: selects the export product; requests AI country recommendations; compares countries on market analysis and historical trends; runs an ML export value prediction; downloads the prediction report; calculates profit with shipping, duties and other costs.
- Relevant inputs and decisions: which product to export; which destination countries to compare; the prediction inputs (product, country, period and the regressor's required inputs); the cost figures (shipping, duty, other costs); whether the predicted value and profit justify the shipment.
- Interactions with other participants: none directly. The exporter consumes results produced by the trained models and the loaded dataset; the Project Evaluator inspects the same models and data but does not interact with the exporter.
- Observable success: a ranked recommendation with a top country highlighted, a comparison that shows how markets differ, a trend graph that shows historical movement, a predicted export value with its model identity and opportunity category, a downloaded report, and a profit figure with a visible cost breakdown.
Project Evaluator
- Product context: a college examiner or reviewer assessing a B.Tech final-year project. They work anonymously and focus on the machine-learning evidence and the written research paper rather than on export planning.
- Primary goal: confirm that the models are genuinely trained and compared, that metrics come from unseen test data under a chronological split, that opportunity labels are defined independently of the prediction features, and that no accuracy or research result is fabricated.
- Distinct accepted responsibilities: reviews the regression comparison (Linear Regression, Decision Tree Regressor, Random Forest Regressor) on MAE, RMSE, R² Score and the Actual vs Predicted graph; reviews the classification comparison (Logistic Regression, Decision Tree Classifier, Random Forest Classifier) on Accuracy (%), Precision, Recall, F1-score and the Confusion Matrix; reads the opportunity-label definition; reads the research paper sections and the dataset description; verifies the real-versus-synthetic data distinction.
- Relevant inputs and decisions: the metrics tables and graphs on ML Algorithm Comparison; the label definition; the research paper on About Project; the dataset provenance badge. Their decision is whether the project meets academic standards and whether the reported results are trustworthy.
- Interactions with other participants: none directly. The evaluator inspects the same models and data the Indian Exporter relies on, but the two personas do not exchange state.
- Observable success: metrics tables and graphs that render from stored evaluation records, a stated chronological split and unseen-test-data provenance, a written label definition, and a complete research paper whose Experimental Results match the computed metrics.
5. Core User Flows
Flow A — Indian Exporter: find the best market for a product
- The exporter opens the application and lands on Home Dashboard, the anonymous entry surface. The hero shows the headline, subline and "Open dashboard" call to action; the dataset-provenance badge states whether real or synthetic data is loaded.
- The exporter selects an export product (for example rice) from the product selector. The active product is marked with the single accent and the historical trend graphs reload for that product.
- The exporter reads the interactive trend graph to see how demand has moved over the covered periods, then follows sidebar navigation to Export Market Recommendation.
- On Export Market Recommendation, the exporter requests recommendations for the active product. The system scores destination countries with the trained classifier and returns a ranked list; the top recommendation is highlighted and each row shows its supporting market signal and opportunity category (High, Medium or Low).
- The exporter opens a country of interest in Country Comparison, selects a second country, and reads the side-by-side trade values, trend direction and opportunity category as a chart and table.
- Failure/recovery: if the classifier artifact is missing, the recommendation page names the missing artifact and instructs the exporter to run training; the last valid ranking stays visible. If fewer than two countries are selected on Country Comparison, an empty state asks for a second country and the prior selection is preserved.
- Continuation: the exporter carries the top recommendation into Export Demand Prediction.
Flow B — Indian Exporter: predict export value and download a report
- From the recommendation or comparison, the exporter opens Export Demand Prediction with the product and destination country carried over.
- The exporter completes the prediction inputs — product, destination country, period and the trained regressor's required inputs — and runs the prediction.
- The system returns a predicted export value, the identity of the regression model that produced it, and the opportunity category.
- The exporter activates the download control. A prediction report is generated containing exactly the displayed prediction, its inputs, the model identity and the opportunity category, and the exporter downloads it.
- Failure/recovery: an invalid input names the specific field and the form retains prior valid inputs; a missing model artifact instructs the exporter to run training; a report-generation failure shows an error and allows re-running the prediction.
- Continuation: the exporter carries the predicted value into Profit Calculator.
Flow C — Indian Exporter: check profit before shipping
- The exporter opens Profit Calculator, optionally prefilled with the predicted export value from Flow B.
- The exporter enters the export value (or quantity and price), shipping cost, duty and other costs.
- The system computes total cost and profit and shows the cost breakdown.
- Failure/recovery: a negative or non-numeric entry is rejected with the offending field named; valid entries are preserved and only the invalid one is cleared.
- Continuation: the exporter revises inputs to test another scenario or returns to Export Demand Prediction to test another market.
Flow D — Project Evaluator: verify the machine-learning evidence
- The evaluator opens the application anonymously and follows sidebar navigation to ML Algorithm Comparison.
- In the regression view, the evaluator reads the metrics table for Linear Regression, Decision Tree Regressor and Random Forest Regressor — MAE, RMSE and R² Score — and the Actual vs Predicted graph. The provenance note states that a chronological split was used and that all metrics are computed on unseen test data.
- The evaluator switches to the classification view and reads the metrics table for Logistic Regression, Decision Tree Classifier and Random Forest Classifier — Accuracy (%), Precision, Recall and F1-score — and the Confusion Matrix.
- The evaluator reads the opportunity-label definition panel and confirms that labels are not created directly from the same features used for prediction.
- Failure/recovery: if evaluation records are absent, an empty state instructs the evaluator to run training; inconsistent records show the reason and reload the last successful evaluation.
- Continuation: the evaluator moves to About Project.
Flow E — Project Evaluator: read the research paper and dataset description
- The evaluator opens About Project and reads the research paper sections in order: Problem Statement, Objectives, System Architecture, Methodology, Dataset Description, Algorithm Comparison, Experimental Results, Conclusion and Future Scope.
- The evaluator reads the dataset description, which distinguishes the real UN Comtrade data from the clearly labeled synthetic sample dataset used only for initial testing.
- The evaluator cross-references the Experimental Results against the metrics seen on ML Algorithm Comparison and confirms that no accuracy figure or research result is fabricated.
- Failure/recovery: if the content fails to load, an error with a retry is shown.
- Continuation: the evaluator completes the assessment.
Flow F — Project Evaluator: install and run the project locally
- The evaluator follows the documented installation steps: create the project folder structure, install the packages listed in
requirements.txt, and load the real UN Comtrade data or the labeled synthetic sample dataset. - The evaluator runs the training step, which preprocesses the data, trains and saves the regression and classification models with joblib, and records the evaluation metrics on unseen test data.
- The evaluator starts the Streamlit application with the documented local run command.
- Failure/recovery: missing packages are resolved by installing
requirements.txt; missing models are resolved by running training; each failure message names the missing step. - Continuation: the evaluator demonstrates the application.
6. Visuals Colors and Theme
The creative direction is authoritative: Trade data made physical, after Refik Anadol. The muse is Refik Anadol; the headline idea is that the export dataset itself becomes the hero image — a luminous particle field on a dark museum ground that gives the ML results weight for a college demonstration.
Mode: dark.
Colour tokens (exact hex, by role)
- Background:
#0A0B0D— near-black ground covering most of the page. - Surface:
#141619— data cards and panels. - Text:
#F2F0EA— ink-white reading text. - Primary:
#F2F0EA— primary text and primary controls. - Accent:
#FF7A2F— hot tangerine, used only on the active product, the top recommended country and the call to action. - Muted:
#8C9096— secondary labels and metadata. - Border:
#2A2D31— 1px hairline on data cards. - Data flow teal:
#2FD3C0— low opacity in the particle field and data marks. - Data flow amber:
#FFC24A— low opacity in the particle field and data marks.
Typography
- Headings: Instrument Serif — large light serif headlines with tight leading.
- Body: Space Grotesk.
- Micro-labels: Space Grotesk, uppercase, wide tracking, for data fields.
- Type scale: 1.5 modular — display 40/56/88/128, label 14, body 16, data numeral 28. Data numerals are tabular.
Shape language: full-bleed dark fields and thin luminous rules. Data cards use sharp corners with a 1px #2A2D31 border. No soft blobs, no glass cards.
Layout: full-bleed generative hero, then a strict 12-column grid below. Sidebar navigation stays dark and narrow. Data rows align like museum wall labels — name, value and rank in tabular numerals with a hairline rule.
Spacing rhythm: generous vertical spacing between sections, each section opened by a thin luminous rule that links to its sidebar item; tight internal spacing inside data rows.
Imagery style: one generative particle field built from the export dataset — product and country points glow and drift. Small schematic diagrams for the model comparison. No playful illustration or mascots.
Accessibility: readable text and controls stay whole at 375px, 768px and 1280px, wrapping or scaling with clamp(...) to fit; no element covers any part of them. The indigo/blue-on-white SaaS template is forbidden.
7. Signature Design Concept
The public entry — Home Dashboard — opens on a full-bleed black canvas holding a slow particle field of export points, each point a product-country pair from the loaded dataset, glowing in teal #2FD3C0 and amber #FFC24A at low opacity and drifting continuously. Over the field, a nine-column Instrument Serif headline sits left at 40px to 128px: "Find the best market for your export", with the subline "Compare country demand, predict export value and check the profit before you ship." A thin tangerine #FF7A2F rule runs beneath the headline, and the "Open dashboard" call to action sits under the rule in the same accent. The sidebar stays dark and quiet at the left edge.
Below the hero, the strict 12-column grid begins. The active product is marked with the single tangerine accent; the historical trend graph renders as an interactive Plotly chart on a #141619 surface with a #2A2D31 hairline border; the dataset-provenance badge sits as an uppercase Space Grotesk micro-label. Country rows on the recommendation page read as museum labels — name, value and rank in tabular numerals with a hairline rule — and the top recommendation carries the one accent. The concept recomposes only accepted content, states and controls: the product selector, the trend graphs, the provenance badge and the navigation.
8. Interaction Model & Motion Direction
Interaction Model: Animated Motion Tempo: cinematic Hero Dimensionality: webgl
Landing Hero Motion Brief
- Focal subject: the generative particle field built from the export dataset — product and country points glowing and drifting on the near-black
#0A0B0Dcanvas. - Input → transformation → outcome thesis: as the page loads, the export points resolve from a diffuse drift into a readable field; as the visitor scrolls, the flow fades and the strict 12-column data grid below comes forward. The transformation uses only accepted behavior — the dataset points and the product selection — and produces the composed hero with the headline, rule and "Open dashboard" call to action.
- Motion vocabulary: slow continuous flow in the hero canvas only; scroll-linked fade of the flow; all other motion fast and functional at 150ms.
- Composed first frame: a full-bleed black canvas with the particle field already drifting, the nine-column Instrument Serif headline left at its display size, the thin tangerine rule beneath it, and the "Open dashboard" call to action under the rule; the dark sidebar quiet at the left.
- Reduced-motion state: with
prefers-reduced-motion, the particle field renders as a static composed arrangement of the same points, the scroll-linked fade is removed, and the headline, rule and call to action remain fully readable and operable.
Landing Hero 3D Scene Brief — DIRECTION-DERIVED
A real-time WebGL scene (React Three Fiber) renders one crafted particle field: each point is a product-country pair from the loaded dataset, positioned by its trade value and period, glowing in teal #2FD3C0 and amber #FFC24A at low opacity against #0A0B0D. The field drifts slowly and continuously; scroll-linked opacity fades it as the data grid below comes forward. The scene shows the product's defining state — the export dataset made physical — and never displays invented figures. Under reduced motion the scene renders a single static frame.
9. Non-Functional Requirements
- Data authenticity (explicit): use genuine historical export data from UN Comtrade or another reliable public source where available; never invent real-world statistics. Rationale: the project's credibility for a college demonstration depends on real figures.
- Synthetic data labeling (explicit): the synthetic sample dataset is a separate file, clearly labeled as synthetic and for initial testing only, and is never presented as real data. Rationale: prevents confusion between test data and real statistics.
- Leakage prevention (explicit): no feature used to build the opportunity label may also be used as a prediction feature; preprocessing must not leak test information into training. Rationale: preserves the validity of the reported metrics.
- Chronological splitting (explicit): time-series predictions use a chronological train-test split, never a random split. Rationale: mirrors real forecasting conditions.
- Unseen-test evaluation (explicit): all evaluation metrics — MAE, RMSE, R² Score, Accuracy (%), Precision, Recall, F1-score, Confusion Matrix and the Actual vs Predicted graph — are computed on unseen test data. Rationale: honest performance reporting.
- No fabricated results (explicit): model accuracy and research results are never fabricated; Experimental Results reflect the actual computed metrics. Rationale: academic integrity.
- Error handling and input validation (explicit): every input form validates its fields and names the offending field on failure; every data or model failure shows a reason and a recovery path. Rationale: beginner-friendly, demonstration-safe behavior.
- Reproducibility (required_inference): models are saved with joblib and evaluation records are stored so the pages read consistent results across reloads. Rationale: makes the demonstration repeatable.
- Responsive readability (explicit design constraint): headlines, labels, numbers, cards' text and controls stay entirely inside the viewport and their container at 375px, 768px and 1280px. Rationale: the creative direction's readability rule.
- Accessibility (explicit design constraint): a usable static arrangement is provided under
prefers-reduced-motion. Rationale: the creative direction's motion rule.
10. Tech Stack
- Frontend: Streamlit — the accepted product surface, with sidebar navigation across the seven pages.
- Backend: Python — a shared service exposing the data, recommendation, prediction, comparison and report endpoints the Streamlit pages consume.
- Machine Learning: scikit-learn — Linear Regression, Decision Tree Regressor, Random Forest Regressor, Logistic Regression, Decision Tree Classifier and Random Forest Classifier; models saved with joblib.
- Data processing: Pandas, NumPy.
- Visualization: Plotly (interactive graphs) and Matplotlib.
- Dataset: real historical import-export data from UN Comtrade or another reliable public source, plus a separate clearly labeled synthetic sample dataset for initial testing.
- Application storage: MariaDB for application-owned persistent data — loaded datasets, trained model artifacts and evaluation records.
- Model-provider gateway: LiteLLM, backed by its own PostgreSQL instance, available to the backend for model-provider calls; it carries no product requirement.
- Provisioned frontend service: a React application service remains in the deployment inventory; it is not the accepted product surface.
- Local run: documented installation of
requirements.txtand a documented Streamlit run command.
11. Assumptions and Constraints
- Assumption (required_inference): the real UN Comtrade extract is loaded before the demonstration; the synthetic sample dataset is used only for initial testing and is clearly labeled.
- Assumption (required_inference): training runs before the prediction and comparison pages are demonstrated, so joblib model artifacts and evaluation records exist.
- Assumption (required_inference): the opportunity label is defined by a rule that uses data not used as prediction features; the exact rule is documented on ML Algorithm Comparison and About Project.
- Constraint (explicit): no real-world statistic may be invented; the synthetic dataset is the only permitted non-real data and must be labeled.
- Constraint (explicit): no accuracy figure or research result may be fabricated.
- Constraint (explicit): chronological train-test splitting is mandatory for time-series predictions; all metrics are computed on unseen test data.
- Constraint (explicit): opportunity labels must not be created directly from the same features used for prediction.
- Constraint (explicit): the technology choices — Streamlit, Python, scikit-learn, Pandas, NumPy, Plotly, Matplotlib — are fixed and not substituted.
- Constraint (explicit): the seven pages are fixed: Home Dashboard, Export Market Recommendation, Country Comparison, Export Demand Prediction, ML Algorithm Comparison, Profit Calculator and About Project.
- Constraint (explicit design): the indigo/blue-on-white SaaS template is forbidden; the dark Anadol-inspired palette and typography are authoritative.
- Constraint (explicit): all pages are public and anonymous; no account, sign-in or role-based permission is part of the product.
12. Glossary
- ExportWise AI: the AI-Based Export Market Recommendation and Trade Analytics System described in this document.
- UN Comtrade: the United Nations Commodity Trade Statistics Database, the authoritative source of genuine historical import-export data.
- Synthetic sample dataset: a separate, clearly labeled dataset used only for initial testing before real data is loaded.
- Opportunity category: the High, Medium or Low classification of export opportunity produced by the classifiers.
- Opportunity label: the target value (High/Medium/Low) assigned by a documented rule that does not reuse the prediction features.
- Chronological train-test split: a time-ordered split in which earlier periods train the model and later periods form the unseen test set.
- Data leakage: the accidental use of test information or label-defining features during training, which invalidates metrics.
- MAE: Mean Absolute Error, a regression metric.
- RMSE: Root Mean Squared Error, a regression metric.
- R² Score: the coefficient of determination, a regression metric.
- Actual vs Predicted graph: a plot comparing true test values against model predictions.
- Confusion Matrix: a table of predicted versus actual classes for a classifier.
- Precision / Recall / F1-score: classification metrics reported alongside Accuracy (%).
- joblib: the Python library used to save and load trained model artifacts.
- Prediction report: the downloadable file containing a prediction, its inputs, the model identity and the opportunity category.
- Indian Exporter: the persona who plans an export using recommendations, comparisons, trends, predictions and profit calculations.
- Project Evaluator: the persona who reviews the ML comparison, metrics and research paper for the final-year demonstration.
- LiteLLM: the provisioned model-provider gateway used by the backend; it carries no product requirement.
ExportWise AIUN Comtrade trade field
Find the best market for your export
Compare country demand, predict export value and check the profit before you ship.
02 / Dataset & Trends
Synthetic sample export trend
Choose an export product to read its year-by-year export value and quantity. Hover a point for its exact figures; click to pin the tooltip.
Synthetic sample dataset — for initial testing only. Not real-world trade statistics.
Rice · export value
- Export value (US$ bn)
- Quantity (mn t)
No products are loaded yet.
The products collection is empty. Load the trade dataset — the synthetic sample for initial testing, or real UN Comtrade trade records — so the historical trend can be plotted. The project data store exposes no create endpoint for this collection.
Open the dashboard sections
- Next step 0101Export Market Recommendation
- Next step 0202Country Comparison
- Next step 0303Export Demand Prediction
- Next step 0404Profit Calculator
Demand pointsTrade valueAll pages stay public — no sign-in
ExportWise AIUN Comtrade trade field
Find the best market for your export
Compare country demand, predict export value and check the profit before you ship.
02 / Dataset & Trends
Synthetic sample export trend
Choose an export product to read its year-by-year export value and quantity. Hover a point for its exact figures; click to pin the tooltip.
Synthetic sample dataset — for initial testing only. Not real-world trade statistics.
Rice · export value
- Export value (US$ bn)
- Quantity (mn t)
No products are loaded yet.
The products collection is empty. Load the trade dataset — the synthetic sample for initial testing, or real UN Comtrade trade records — so the historical trend can be plotted. The project data store exposes no create endpoint for this collection.
Open the dashboard sections
- Next step 0101Export Market Recommendation
- Next step 0202Country Comparison
- Next step 0303Export Demand Prediction
- Next step 0404Profit Calculator
Demand pointsTrade valueAll pages stay public — no sign-in
No comments yet. Be the first!