end-to-end-dashbord
 hithkoush_
End-to-End Automated ETL & Sales Dashboard Architected an automated data pipeline extracting raw sales data, transforming it via SQL, and loading it into a data warehouse. Built a Tableau dashboard that reduced reporting time by 15 hours/week and identified a $500k revenue opportunity. Python SQL Airflow Tableau and do this for me and let it be like humanized.


Comments (0)
Sign in to leave a comment
System Requirements
End-to-End Dashboard System Requirements Document
Introduction
The "End-to-End Dashboard" project aims to streamline the process of extracting, transforming, and loading (ETL) sales data into a data warehouse, followed by the creation of a Tableau dashboard. This system will enhance efficiency and help identify revenue opportunities.
System Overview
The system will automate the ETL process using Python, SQL, and Airflow. The transformed data will be loaded into a data warehouse, and a Tableau dashboard will be developed to visualize sales data, thereby improving reporting efficiency and uncovering potential revenue opportunities.
Functional Requirements as Story Points
- As a Data Engineer, I should be able to automate the extraction of raw sales data using Python.
- As a Data Engineer, I should be able to transform sales data using SQL to prepare it for analysis.
- As a Data Engineer, I should be able to load transformed data into a data warehouse using Airflow.
- As a Business Analyst, I should be able to access a Tableau dashboard that visualizes sales data.
- As a Business Analyst, I should be able to use the dashboard to identify potential revenue opportunities.
- As a Business Analyst, I should be able to generate reports from the dashboard to save time on manual reporting.
User Personas
- Data Engineer: Responsible for setting up and maintaining the ETL pipeline.
- Business Analyst: Uses the dashboard to analyze sales data and generate insights.
Core User Flows
- Data Engineer sets up Python scripts for data extraction -> Data is extracted from source -> SQL transformations are applied -> Airflow schedules and executes the ETL process -> Data is loaded into the data warehouse.
- Business Analyst accesses the Tableau dashboard -> Analyzes sales data -> Identifies revenue opportunities -> Generates reports for stakeholders.
Visuals Colors and Theme
- primary: #1E3A8A (Deep Blue)
- primary_light: #3B82F6 (Light Blue)
- secondary: #F97316 (Orange)
- accent: #10B981 (Green)
- highlight: #F59E0B (Amber)
- bg: #F3F4F6 (Light Gray)
- surface: rgba(255, 255, 255, 0.8) (White)
- text: #111827 (Dark Gray)
- text_muted: #6B7280 (Muted Gray)
- border: rgba(209, 213, 219, 0.2) (Light Gray)
Signature Design Concept
The landing page will feature an interactive data pipeline animation. Users will see a dynamic flow of data represented by animated lines and nodes, symbolizing the ETL process. As users scroll, the animation will transform raw data icons into refined data cubes, which then populate a virtual dashboard. This visual metaphor will be built using motion/react for smooth transitions and interactions.
Landing Hero Motion Brief
The hero section will depict raw sales data entering a funnel, transforming into structured data cubes, and finally visualizing as a dynamic Tableau dashboard. This continuous loop will be created using CSS animations and motion/react, providing an engaging narrative of the data transformation process. The animation will pause on hover, allowing users to explore specific elements.
Interaction Model & Motion Direction
- Interaction Model: Animated
- The landing page will feature moderate scroll-triggered reveals and hover transitions. The dashboard will have spring physics on interactive elements, enhancing user engagement.
Non-Functional Requirements
- The system must handle large volumes of sales data efficiently.
- The ETL process should be reliable and recoverable in case of failures.
- The Tableau dashboard should load quickly and be responsive.
Tech Stack
- Frontend: Not applicable
- Backend: Python, SQL
- ETL Orchestration: Airflow
- Data Visualization: Tableau
- Database: As specified by the user, use a data warehouse suitable for the project needs.
Assumptions and Constraints
- The system will primarily handle sales data.
- The ETL process will be scheduled to run daily.
- The Tableau dashboard will be accessible to authorized users only.
Glossary
- ETL: Extract, Transform, Load
- SQL: Structured Query Language
- Airflow: A platform to programmatically author, schedule, and monitor workflows
- Tableau: A data visualization tool used for creating interactive and shareable dashboards
This document outlines the requirements for the "End-to-End Dashboard" project, ensuring a comprehensive understanding of the system's capabilities and design.
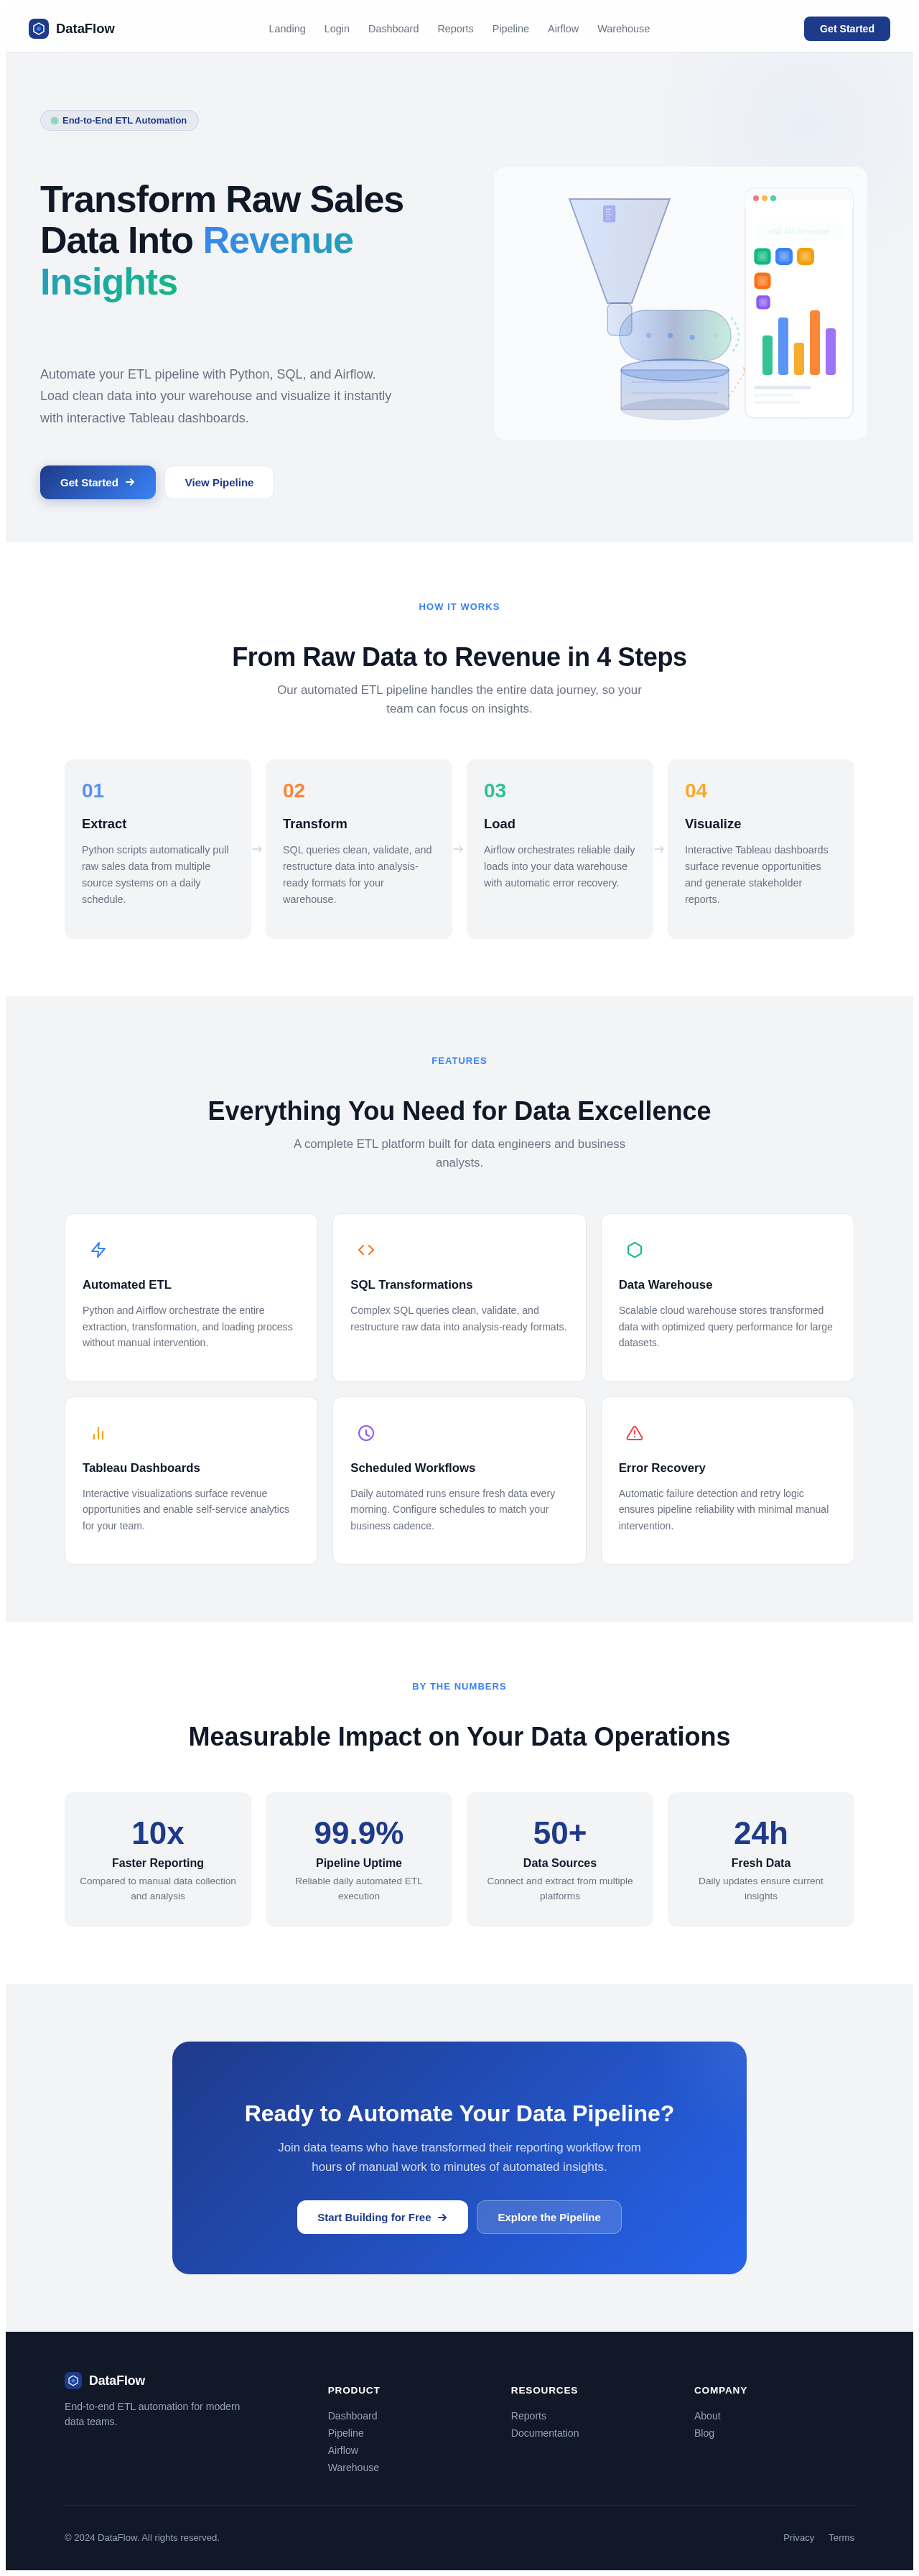
Transform Raw Sales Data Into Revenue Insights
Automate your ETL pipeline with Python, SQL, and Airflow. Load clean data into your warehouse and visualize it instantly with interactive Tableau dashboards.
From Raw Data to Revenue in 4 Steps
Our automated ETL pipeline handles the entire data journey, so your team can focus on insights.
Extract
Python scripts automatically pull raw sales data from multiple source systems on a daily schedule.
Transform
SQL queries clean, validate, and restructure data into analysis-ready formats for your warehouse.
Load
Airflow orchestrates reliable daily loads into your data warehouse with automatic error recovery.
Visualize
Interactive Tableau dashboards surface revenue opportunities and generate stakeholder reports.
Everything You Need for Data Excellence
A complete ETL platform built for data engineers and business analysts.
Automated ETL
Python and Airflow orchestrate the entire extraction, transformation, and loading process without manual intervention.
SQL Transformations
Complex SQL queries clean, validate, and restructure raw data into analysis-ready formats.
Data Warehouse
Scalable cloud warehouse stores transformed data with optimized query performance for large datasets.
Tableau Dashboards
Interactive visualizations surface revenue opportunities and enable self-service analytics for your team.
Scheduled Workflows
Daily automated runs ensure fresh data every morning. Configure schedules to match your business cadence.
Error Recovery
Automatic failure detection and retry logic ensures pipeline reliability with minimal manual intervention.
Measurable Impact on Your Data Operations
Ready to Automate Your Data Pipeline?
Join data teams who have transformed their reporting workflow from hours of manual work to minutes of automated insights.
Transform Raw Sales Data Into Revenue Insights
Automate your ETL pipeline with Python, SQL, and Airflow. Load clean data into your warehouse and visualize it instantly with interactive Tableau dashboards.
From Raw Data to Revenue in 4 Steps
Our automated ETL pipeline handles the entire data journey, so your team can focus on insights.
Extract
Python scripts automatically pull raw sales data from multiple source systems on a daily schedule.
Transform
SQL queries clean, validate, and restructure data into analysis-ready formats for your warehouse.
Load
Airflow orchestrates reliable daily loads into your data warehouse with automatic error recovery.
Visualize
Interactive Tableau dashboards surface revenue opportunities and generate stakeholder reports.
Everything You Need for Data Excellence
A complete ETL platform built for data engineers and business analysts.
Automated ETL
Python and Airflow orchestrate the entire extraction, transformation, and loading process without manual intervention.
SQL Transformations
Complex SQL queries clean, validate, and restructure raw data into analysis-ready formats.
Data Warehouse
Scalable cloud warehouse stores transformed data with optimized query performance for large datasets.
Tableau Dashboards
Interactive visualizations surface revenue opportunities and enable self-service analytics for your team.
Scheduled Workflows
Daily automated runs ensure fresh data every morning. Configure schedules to match your business cadence.
Error Recovery
Automatic failure detection and retry logic ensures pipeline reliability with minimal manual intervention.
Measurable Impact on Your Data Operations
Ready to Automate Your Data Pipeline?
Join data teams who have transformed their reporting workflow from hours of manual work to minutes of automated insights.
No comments yet. Be the first!