crop-disease
 Anushka Tiwari
Build a complete, modern, professional, and interactive website for my BTech Computer Science Deep Learning project called **CropCare AI — Crop Disease Detection and Classification Using Deep Learning**. ## 1. Project Objective The objective is to develop a Deep Learning-based system that detects and classifies crop diseases from leaf images, helping in early disease identification and reducing crop losses. ## 2. Technology Stack Use the following technologies: - Backend: Python 3.11 with Flask - Deep Learning: TensorFlow/Keras - Image Processing: OpenCV and Pillow - Data Analysis: NumPy, Pandas, Scikit-learn - Frontend: HTML5, CSS3, JavaScript, Bootstrap 5 - Charts: Chart.js - Testing: Pytest Do not use Java, Spring Boot, React, or Node.js. Keep the application primarily Python-based, with HTML, CSS, and JavaScript for the frontend. ## 3. Design and Visual Style Create a premium agricultural AI dashboard with: - A forest-green, emerald-green, white, and warm-cream color palette. - A clean, modern layout with subtle animations and smooth transitions. - Professional typography, rounded cards, soft shadows, and elegant icons. - High-quality agricultural imagery, crop leaves, and plant disease illustrations. - A responsive design for desktop, tablets, and mobile devices. - A modern SaaS-style interface suitable for a university project demonstration and faculty evaluation. Avoid a basic template or a plain white website. Make the interface visually impressive but easy to understand and navigate. ## 4. Main Website Pages ### Page 1: Home / Dashboard Create an attractive landing page with: - Logo and project name: CropCare AI. - Hero heading: “Detect Crop Diseases. Protect Every Harvest.” - Subtitle explaining how deep learning identifies crop diseases from leaf images. - A prominent “Detect Disease” button. - Overview cards for total images evaluated, supported disease classes, available models, and model accuracy. - A workflow section: Upload Image → AI Analysis → Disease Prediction → Recommended Next Steps. - A section explaining the project's objectives and benefits. Never display fabricated model accuracy or fake statistics. Show actual values when available and otherwise display “Not evaluated yet.” ### Page 2: Disease Detection Create a fully functional image-upload interface where users can: - Upload JPG, JPEG, or PNG leaf images. - Drag and drop images into the upload area. - Preview the selected image before analysis. - Click “Analyze Leaf” to run actual model inference through the Python Flask backend. - View the predicted disease class, confidence score, inference time, and class-wise probabilities. - See a clear result panel with the uploaded leaf image and prediction. - Receive general educational information about the predicted disease and suggested next steps. If the trained model or its weights are unavailable, show a clear message explaining how to configure them. Never generate random or hardcoded predictions. ### Page 3: Dataset Explorer Build a dashboard for exploring the crop disease dataset: - Dataset summary and image counts. - Disease classes and sample leaf images. - Training, validation, and testing split distribution. - Class distribution charts. - Image preview and basic image information. - Dataset source and license information. Only display real dataset information when the dataset is available. ### Page 4: Deep Learning Lab Create an interactive educational section explaining the concepts used in the project: - Artificial neurons and perceptrons. - Multilayer Perceptrons (MLPs). - Convolutional Neural Networks (CNNs). - Forward propagation and backpropagation. - Activation functions such as ReLU, sigmoid, and softmax. - Loss functions and gradient descent. - Stochastic Gradient Descent, momentum, and Nesterov acceleration. - Tensor operations, matrix multiplication, broadcasting, reshaping, and inner products. - Weight initialization, normalization, regularization, and data augmentation. - Singular Value Decomposition (SVD) and gradient checking. Include clear diagrams, formulas, simple explanations, and small interactive demonstrations suitable for a Deep Learning viva. ### Page 5: Model Training and Experiments Create an experiment dashboard displaying: - Model architecture and configuration. - Training and validation loss curves. - Training and validation accuracy curves. - Epochs, batch size, learning rate, and optimizer. - Dataset split details. - Training status and experiment history. Support a simple MLP baseline and a CNN model. Include a pretrained model such as ResNet only if it can be implemented and tested properly. Do not claim that training has completed unless it actually has. Use real training logs and saved model files. ### Page 6: Model Comparison Compare the available models using actual results: - Accuracy. - Precision. - Recall. - F1-score. - Inference time. - Confusion matrix. Use clear tables and interactive charts. Show “Not evaluated yet” for missing results. ### Page 7: Error Analysis Include: - Confusion matrix visualization. - Per-class precision, recall, and F1-score. - Correctly classified and misclassified examples. - False positives and false negatives. - Overfitting and underfitting analysis. - Limitations and possible causes of incorrect predictions. ### Page 8: Project Documentation Create a documentation section containing: - Problem statement. - Objectives and motivation. - System architecture diagram. - Dataset description and licensing. - Data preprocessing methodology. - Model architecture. - Training methodology. - Evaluation metrics and actual results. - Limitations and future improvements. - References and individual contribution. Include a project checklist for the final demonstration and viva. ## 5. Backend Requirements Build a genuine Python Flask backend with: - Image upload and validation. - A prediction endpoint. - Efficient model loading. - Preprocessing consistent with the model's training pipeline. - Actual TensorFlow/Keras model inference. - Input validation and useful error messages. - Safe handling of uploaded files. - Clear separation between frontend, backend, model, and training code. Create an organized project structure containing `app.py`, `routes/`, `model/`, `training/`, `dataset/`, `templates/`, `static/css/`, `static/js/`, `tests/`, `docs/`, `requirements.txt`, and `README.md`. ## 6. Quality and Reliability - Every navigation link, button, form, upload area, and chart should work as intended. - Do not create fake functionality, simulated predictions, fabricated metrics, or placeholder buttons that pretend to work. - Use genuine model outputs wherever available. - Handle missing datasets and model weights gracefully. - Include clear setup instructions and testing instructions. - Make the website easy to run locally using Python. - Keep the implementation modular, readable, and suitable for academic evaluation. ## 7. Final Deliverable Build the complete CropCare AI website with a polished frontend, a Python Flask backend, working image-upload functionality, and integration with the actual deep learning model. First inspect the available project files and existing model implementation if provided. Reuse the existing implementation where appropriate instead of unnecessarily rebuilding it. Do not overwrite or delete existing project files without checking them first. Prioritize a working disease-detection pipeline, a professional interface, genuine evaluation metrics, and clear explanations that I can confidently present during my individual Deep Learning project evaluation and viva.


Comments (0)
Sign in to leave a comment
System Requirements
System Requirements Document for CropCare AI
1. Introduction
CropCare AI — Crop Disease Detection and Classification Using Deep Learning — is a BTech Computer Science Deep Learning project delivered as a complete, modern, professional, and interactive website. Its purpose is to detect and classify crop diseases from leaf images, helping in early disease identification and reducing crop losses. The site is built for a university project demonstration and faculty evaluation, and it must be presentable with confidence during an individual Deep Learning project evaluation and viva.
The product is a genuine Python Flask application: a real TensorFlow/Keras model performs inference on uploaded leaf images, real training logs and saved model files back the experiment and comparison views, and real dataset information backs the dataset explorer. Where a real value does not exist, the interface says so — "Not evaluated yet" — rather than inventing one. The audience is the Student Researcher who builds, runs, and explains the project, and the Faculty Evaluator who inspects the pipeline, metrics, and documentation during evaluation.
Success Criteria and KPIs
- A leaf image in JPG, JPEG, or PNG can be uploaded, previewed, and analyzed through the Flask backend, returning a predicted disease class, confidence score, inference time, and class-wise probabilities from the actual model.
- No fabricated model accuracy, fake statistics, random or hardcoded predictions, simulated functionality, or placeholder buttons exist anywhere in the site; missing values render as "Not evaluated yet" or as a clear configuration message.
- Every navigation link, button, form, upload area, and chart works as intended.
- The site runs locally with Python 3.11 and Flask, with clear setup and testing instructions.
- The Deep Learning Lab, Model Training and Experiments, Model Comparison, Error Analysis, and Project Documentation pages together support a complete viva walkthrough.
2. System Overview
CropCare AI is a single Python Flask web application with eight pages. The Flask backend serves the HTML5/CSS3/JavaScript/Bootstrap 5 frontend, exposes a prediction endpoint that runs actual TensorFlow/Keras inference, and reads real dataset metadata, training logs, saved model files, and evaluation results from the project's organized directory structure (app.py, routes/, model/, training/, dataset/, templates/, static/css/, static/js/, tests/, docs/, requirements.txt, README.md). Chart.js renders all charts. Pytest covers the backend and pipeline.
The active human actors are the Student Researcher and the Faculty Evaluator. Both browse the site anonymously; no account, login, or role-based permission is part of the accepted scope. The Student Researcher uploads leaf images and reads real predictions, studies the Deep Learning Lab, and reviews training and documentation content. The Faculty Evaluator inspects real training logs, model comparison metrics, error analysis, and the demonstration checklist.
The application is primarily Python-based, with HTML, CSS, and JavaScript for the frontend. Java, Spring Boot, React, and Node.js are excluded. The provisioned infrastructure inventory lists a shared backend process, a MariaDB database, a React frontend, and a LiteLLM gateway backed by PostgreSQL; these are infrastructure facts only. The accepted product is a Flask application with a server-rendered Bootstrap frontend, and no accepted workflow requires a React UI, a LiteLLM model-provider call, or application-owned persistent data. The Flask backend is the shared backend process for all feature routes; the provisioned database and gateway do not create domain entities, authentication, or model-provider behavior.
Removed from scope
- Java (also: Spring Boot)
- React
- Node.js
2a. Product Interpretation and Delivery Boundary
CropCare AI is delivered as a locally runnable Python Flask website. All eight pages are first-party, publicly reachable surfaces with no access requirement: a visitor opens the site and can immediately browse the dashboard, upload a leaf, explore the dataset, read the Deep Learning Lab, inspect training experiments, compare models, review error analysis, and read the project documentation. There is no sign-in, no user account, and no differentiated permission; the site presents the same genuine project state to every visitor.
The delivery boundary is defined by truthfulness. The Disease Detection page runs real inference only when the trained model and weights are configured; otherwise it shows a clear message explaining how to configure them and never produces a prediction. The Dataset Explorer shows real dataset information only when the dataset is available. Model Training and Experiments, Model Comparison, and Error Analysis show real logs, saved model files, and evaluation results, and display "Not evaluated yet" for anything not yet measured. Training is never reported as complete unless it actually completed.
The current scope covers the eight accepted pages and the Flask backend that supports them. Future improvements are described only in the Project Documentation page as narrative content and are not current features.
2b. Source Content Inventory
The reference directive for "existing project files and model implementation" is declared as content_source and feature_reference with the instruction to inspect first, reuse where appropriate, and not overwrite or delete existing files without checking them first. No verified factual entities, collection items, field values, dates, contacts, links, or media references were supplied in the authoritative thread beyond the project structure and technology list already captured above; the inventory therefore records only the required project structure and the reuse obligation.
- Required project structure:
app.py,routes/,model/,training/,dataset/,templates/,static/css/,static/js/,tests/,docs/,requirements.txt,README.md. - Reuse obligation: inspect available project files and any existing model implementation first; reuse the existing implementation where appropriate instead of unnecessarily rebuilding it; do not overwrite or delete existing project files without checking them first.
- No additional verified dataset names, class lists, image counts, licenses, or metric values were supplied; these must come from the real project artifacts at runtime and are shown only when genuinely available.
2c. Page Content and Component Coverage
Home / Dashboard
- Information and state: CropCare AI logo and project name; hero heading "Detect Crop Diseases. Protect Every Harvest."; subtitle explaining how deep learning identifies crop diseases from leaf images; overview cards for total images evaluated, supported disease classes, available models, and model accuracy; workflow section Upload Image → AI Analysis → Disease Prediction → Recommended Next Steps; objectives and benefits section.
- Primary action: prominent "Detect Disease" button navigating to Disease Detection.
- Supporting actions: navigation to all other pages; workflow step labels.
- Domain entities: overview metrics (total images evaluated, supported disease classes, available models, model accuracy), workflow steps, project objectives and benefits.
- Component responsibilities: hero block with logo, heading, subtitle, and CTA; four overview cards each rendering a real value or "Not evaluated yet"; ruled workflow sequence with four steps; objectives and benefits prose section.
- States: loading while overview values are read; success with real values; empty/missing values rendered as "Not evaluated yet" in the same type size as real values; error state if overview data cannot be read, with a clear message and no invented numbers.
Disease Detection
- Information and state: upload area accepting JPG, JPEG, and PNG leaf images; drag-and-drop target; selected-image preview before analysis; result panel showing the uploaded leaf image, predicted disease class, confidence score, inference time, and class-wise probabilities; general educational information about the predicted disease and suggested next steps.
- Primary action: "Analyze Leaf" button running actual model inference through the Python Flask backend.
- Supporting actions: browse/select a file; drag and drop a file; replace the selected image; re-run analysis.
- Domain entities: uploaded leaf image, prediction result (class, confidence, inference time, class-wise probabilities), disease educational information, suggested next steps.
- Component responsibilities: drop zone with file input; preview component; analyze control; result panel; probability display; educational information block.
- States: empty (no image selected); preview ready; analyzing (in-progress indicator); success with real prediction; validation error for unsupported file type or invalid image with a useful message; model-unavailable state with a clear message explaining how to configure the trained model and weights, and no prediction shown; inference error with a useful message and the ability to retry.
Dataset Explorer
- Information and state: dataset summary and image counts; disease classes and sample leaf images; training, validation, and testing split distribution; class distribution charts; image preview and basic image information; dataset source and license information.
- Primary actions: browse classes and samples; open an image preview.
- Supporting actions: switch between split views; read source and license details.
- Domain entities: dataset summary, image counts, disease classes, sample leaf images, split distribution, class distribution, image metadata, dataset source, license.
- Component responsibilities: summary panel; class gallery; split distribution chart (Chart.js); class distribution chart (Chart.js); image preview with basic information; source and license block.
- States: loading; success with real dataset information; dataset-unavailable state with a clear message and no invented counts, classes, or samples; error state with a useful message.
Deep Learning Lab
- Information and state: explanations with clear diagrams, formulas, and simple explanations for artificial neurons and perceptrons; Multilayer Perceptrons (MLPs); Convolutional Neural Networks (CNNs); forward propagation and backpropagation; activation functions such as ReLU, sigmoid, and softmax; loss functions and gradient descent; Stochastic Gradient Descent, momentum, and Nesterov acceleration; tensor operations, matrix multiplication, broadcasting, reshaping, and inner products; weight initialization, normalization, regularization, and data augmentation; Singular Value Decomposition (SVD) and gradient checking.
- Primary actions: read each concept section; operate the small interactive demonstrations.
- Supporting actions: navigate between concept sections.
- Domain entities: concept topics, diagrams, formulas, interactive demonstrations.
- Component responsibilities: concept section layout with illustrated band and numbered section label; diagram components; formula display; interactive demonstration widgets suitable for a Deep Learning viva.
- States: static content always available; interactive demonstrations render their initial state and respond to user input; no fabricated results are presented as model outputs.
Model Training and Experiments
- Information and state: model architecture and configuration; training and validation loss curves; training and validation accuracy curves; epochs, batch size, learning rate, and optimizer; dataset split details; training status and experiment history; support for a simple MLP baseline and a CNN model; a pretrained model such as ResNet only if it can be implemented and tested properly.
- Primary actions: review an experiment's configuration and curves; review training status and history.
- Supporting actions: select an experiment from history; read split details.
- Domain entities: model architecture, configuration (epochs, batch size, learning rate, optimizer), training and validation loss and accuracy series, dataset split details, training status, experiment history, saved model files, training logs.
- Component responsibilities: architecture and configuration panel; loss curve chart (Chart.js); accuracy curve chart (Chart.js); hyperparameter display; split details panel; status indicator; experiment history list.
- States: loading; success with real logs and saved model files; not-yet-trained state that does not claim completion; missing-log or missing-model state with a clear message; error state with a useful message.
Model Comparison
- Information and state: comparison of available models on accuracy, precision, recall, F1-score, inference time, and confusion matrix; clear tables and interactive charts; "Not evaluated yet" for missing results.
- Primary actions: compare models across metrics; inspect a model's confusion matrix.
- Supporting actions: switch chart views; read table values.
- Domain entities: model, accuracy, precision, recall, F1-score, inference time, confusion matrix.
- Component responsibilities: comparison table; interactive metric charts (Chart.js); confusion matrix display; missing-value rendering as "Not evaluated yet".
- States: loading; success with real results; partial results with "Not evaluated yet" for missing metrics; no-evaluated-models state with a clear message; error state with a useful message.
Error Analysis
- Information and state: confusion matrix visualization; per-class precision, recall, and F1-score; correctly classified and misclassified examples; false positives and false negatives; overfitting and underfitting analysis; limitations and possible causes of incorrect predictions.
- Primary actions: inspect the confusion matrix; review per-class metrics; review example classifications.
- Supporting actions: browse correct and misclassified examples; read limitations.
- Domain entities: confusion matrix, per-class precision/recall/F1, correctly classified examples, misclassified examples, false positives, false negatives, overfitting and underfitting analysis, limitations, possible causes.
- Component responsibilities: confusion matrix visualization; per-class metrics table; example galleries; false positive and false negative panels; overfitting/underfitting analysis block; limitations block.
- States: loading; success with real evaluation results; not-evaluated state with "Not evaluated yet" and no invented examples; error state with a useful message.
Project Documentation
- Information and state: problem statement; objectives and motivation; system architecture diagram; dataset description and licensing; data preprocessing methodology; model architecture; training methodology; evaluation metrics and actual results; limitations and future improvements; references and individual contribution; project checklist for the final demonstration and viva.
- Primary actions: read each documentation section; use the demonstration checklist.
- Supporting actions: navigate between sections.
- Domain entities: documentation sections, architecture diagram, checklist items, references, individual contribution.
- Component responsibilities: sectioned documentation layout; architecture diagram; actual-results block that shows real values or "Not evaluated yet"; checklist component.
- States: static content always available; actual-results block reflects real values or "Not evaluated yet"; no fabricated results.
3. Functional Requirements
FR-01 — Project website. As a Student Researcher, I should have a complete, modern, professional, and interactive website for CropCare AI — Crop Disease Detection and Classification Using Deep Learning, so that the project can be demonstrated and evaluated. (explicit) Acceptance: all eight pages are reachable and functional.
FR-02 — Disease detection purpose. As a Student Researcher, I should detect and classify crop diseases from leaf images, so that early disease identification is supported and crop losses can be reduced. (explicit) Acceptance: a real leaf image produces a real classification result.
FR-03 — Flask backend. As a Student Researcher, I should have a genuine Python 3.11 Flask backend, so that the site runs locally on Python. (explicit) Acceptance: the application starts and serves all pages locally.
FR-04 — TensorFlow/Keras inference. As a Student Researcher, I should have actual TensorFlow/Keras model inference, so that predictions come from the trained model. (explicit) Acceptance: the prediction endpoint returns outputs produced by the loaded Keras model.
FR-05 — Image processing. As a Student Researcher, I should have OpenCV and Pillow used for image processing, so that uploaded images are handled and prepared correctly. (explicit)
FR-06 — Data analysis. As a Student Researcher, I should have NumPy, Pandas, and Scikit-learn used for data analysis, so that dataset statistics and evaluation metrics are computed genuinely. (explicit)
FR-07 — Frontend stack. As a Student Researcher, I should have an HTML5, CSS3, JavaScript, and Bootstrap 5 frontend, so that the interface is built on the specified web technologies. (explicit)
FR-08 — Charts. As a Student Researcher, I should have Chart.js render the charts, so that dataset, training, and comparison charts are interactive. (explicit)
FR-09 — Testing. As a Student Researcher, I should have Pytest tests, so that the backend and pipeline can be verified. (explicit)
FR-10 — Palette. As a Faculty Evaluator, I should see a forest-green, emerald-green, white, and warm-cream color palette, so that the site reads as a premium agricultural AI dashboard. (explicit)
FR-11 — Motion and layout. As a Faculty Evaluator, I should see a clean, modern layout with subtle animations and smooth transitions, so that the interface feels polished without distraction. (explicit)
FR-12 — Typography and surfaces. As a Faculty Evaluator, I should see professional typography, rounded cards, soft shadows, and elegant icons, so that the interface looks professionally crafted. (explicit)
FR-13 — Imagery. As a Faculty Evaluator, I should see high-quality agricultural imagery, crop leaves, and plant disease illustrations, so that the agricultural context is visually clear. (explicit)
FR-14 — Responsive design. As a Faculty Evaluator, I should see a responsive design for desktop, tablets, and mobile devices, so that the site is usable on any screen. (explicit)
FR-15 — SaaS-style interface. As a Faculty Evaluator, I should see a modern SaaS-style interface suitable for a university project demonstration and faculty evaluation, so that the project presents well. (explicit)
FR-16 — Not a basic template. As a Faculty Evaluator, I should not see a basic template or a plain white website, so that the interface is visually impressive yet easy to understand and navigate. (explicit)
FR-17 — Home identity. As a Faculty Evaluator, I should see the CropCare AI logo and project name on the Home / Dashboard, so that the project is immediately identified. (explicit)
FR-18 — Hero heading. As a Faculty Evaluator, I should see the hero heading "Detect Crop Diseases. Protect Every Harvest." on the Home / Dashboard. (explicit)
FR-19 — Hero subtitle. As a Faculty Evaluator, I should see a subtitle explaining how deep learning identifies crop diseases from leaf images. (explicit)
FR-20 — Detect Disease button. As a Student Researcher, I should see a prominent "Detect Disease" button on the Home / Dashboard that leads to Disease Detection, so that I can start an analysis quickly. (explicit)
FR-21 — Overview cards. As a Faculty Evaluator, I should see overview cards for total images evaluated, supported disease classes, available models, and model accuracy, so that the project's real state is summarized. (explicit) Acceptance: each card shows a real value or "Not evaluated yet".
FR-22 — Workflow section. As a Faculty Evaluator, I should see a workflow section reading Upload Image → AI Analysis → Disease Prediction → Recommended Next Steps. (explicit)
FR-23 — Objectives and benefits. As a Faculty Evaluator, I should see a section explaining the project's objectives and benefits. (explicit)
FR-24 — No fabricated statistics. As a Faculty Evaluator, I should never see fabricated model accuracy or fake statistics; actual values appear when available and otherwise "Not evaluated yet". (explicit)
FR-25 — Image upload formats. As a Student Researcher, I should upload JPG, JPEG, or PNG leaf images on Disease Detection. (explicit) Acceptance: supported formats are accepted; other formats produce a useful validation message.
FR-26 — Drag and drop. As a Student Researcher, I should drag and drop images into the upload area. (explicit)
FR-27 — Preview. As a Student Researcher, I should preview the selected image before analysis. (explicit)
FR-28 — Analyze Leaf. As a Student Researcher, I should click "Analyze Leaf" to run actual model inference through the Python Flask backend. (explicit) Acceptance: the request reaches the backend prediction endpoint and returns real model output.
FR-29 — Result details. As a Student Researcher, I should view the predicted disease class, confidence score, inference time, and class-wise probabilities. (explicit)
FR-30 — Result panel. As a Student Researcher, I should see a clear result panel with the uploaded leaf image and prediction. (explicit)
FR-31 — Educational information. As a Student Researcher, I should receive general educational information about the predicted disease and suggested next steps. (explicit)
FR-32 — Model unavailable message. As a Student Researcher, I should see a clear message explaining how to configure the trained model and weights when they are unavailable, and never a random or hardcoded prediction. (explicit)
FR-33 — Dataset summary. As a Faculty Evaluator, I should see dataset summary and image counts on Dataset Explorer. (explicit)
FR-34 — Classes and samples. As a Faculty Evaluator, I should see disease classes and sample leaf images. (explicit)
FR-35 — Split distribution. As a Faculty Evaluator, I should see training, validation, and testing split distribution. (explicit)
FR-36 — Class distribution charts. As a Faculty Evaluator, I should see class distribution charts. (explicit)
FR-37 — Image preview and information. As a Faculty Evaluator, I should see image preview and basic image information. (explicit)
FR-38 — Source and license. As a Faculty Evaluator, I should see dataset source and license information. (explicit)
FR-39 — Real dataset only. As a Faculty Evaluator, I should see only real dataset information when the dataset is available. (explicit) Acceptance: when the dataset is unavailable, a clear message appears and no invented data is shown.
FR-40 — Neurons and perceptrons. As a Student Researcher, I should study artificial neurons and perceptrons in the Deep Learning Lab. (explicit)
FR-41 — MLPs. As a Student Researcher, I should study Multilayer Perceptrons (MLPs). (explicit)
FR-42 — CNNs. As a Student Researcher, I should study Convolutional Neural Networks (CNNs). (explicit)
FR-43 — Forward and backpropagation. As a Student Researcher, I should study forward propagation and backpropagation. (explicit)
FR-44 — Activation functions. As a Student Researcher, I should study activation functions such as ReLU, sigmoid, and softmax. (explicit)
FR-45 — Loss and gradient descent. As a Student Researcher, I should study loss functions and gradient descent. (explicit)
FR-46 — SGD, momentum, Nesterov. As a Student Researcher, I should study Stochastic Gradient Descent, momentum, and Nesterov acceleration. (explicit)
FR-47 — Tensor operations. As a Student Researcher, I should study tensor operations, matrix multiplication, broadcasting, reshaping, and inner products. (explicit)
FR-48 — Initialization, normalization, regularization, augmentation. As a Student Researcher, I should study weight initialization, normalization, regularization, and data augmentation. (explicit)
FR-49 — SVD and gradient checking. As a Student Researcher, I should study Singular Value Decomposition (SVD) and gradient checking. (explicit)
FR-50 — Lab presentation. As a Student Researcher, I should see clear diagrams, formulas, simple explanations, and small interactive demonstrations suitable for a Deep Learning viva. (explicit)
FR-51 — Architecture and configuration. As a Faculty Evaluator, I should see model architecture and configuration on Model Training and Experiments. (explicit)
FR-52 — Loss curves. As a Faculty Evaluator, I should see training and validation loss curves. (explicit)
FR-53 — Accuracy curves. As a Faculty Evaluator, I should see training and validation accuracy curves. (explicit)
FR-54 — Hyperparameters. As a Faculty Evaluator, I should see epochs, batch size, learning rate, and optimizer. (explicit)
FR-55 — Split details. As a Faculty Evaluator, I should see dataset split details. (explicit)
FR-56 — Status and history. As a Faculty Evaluator, I should see training status and experiment history. (explicit)
FR-57 — MLP baseline and CNN. As a Student Researcher, I should have a simple MLP baseline and a CNN model supported. (explicit)
FR-58 — Pretrained model condition. As a Student Researcher, I should include a pretrained model such as ResNet only if it can be implemented and tested properly. (explicit) Acceptance: it is shown only when genuinely implemented and tested.
FR-59 — No false completion. As a Faculty Evaluator, I should never see a claim that training completed unless it actually has; real training logs and saved model files are used. (explicit)
FR-60 — Model comparison metrics. As a Faculty Evaluator, I should compare available models on accuracy, precision, recall, F1-score, inference time, and confusion matrix. (explicit)
FR-61 — Tables and charts. As a Faculty Evaluator, I should see clear tables and interactive charts on Model Comparison. (explicit)
FR-62 — Not evaluated yet. As a Faculty Evaluator, I should see "Not evaluated yet" for missing results on Model Comparison. (explicit)
FR-63 — Confusion matrix visualization. As a Faculty Evaluator, I should see a confusion matrix visualization on Error Analysis. (explicit)
FR-64 — Per-class metrics. As a Faculty Evaluator, I should see per-class precision, recall, and F1-score. (explicit)
FR-65 — Correct and misclassified examples. As a Faculty Evaluator, I should see correctly classified and misclassified examples. (explicit)
FR-66 — False positives and negatives. As a Faculty Evaluator, I should see false positives and false negatives. (explicit)
FR-67 — Overfitting and underfitting. As a Faculty Evaluator, I should see overfitting and underfitting analysis. (explicit)
FR-68 — Limitations and causes. As a Faculty Evaluator, I should see limitations and possible causes of incorrect predictions. (explicit)
FR-69 — Problem statement. As a Faculty Evaluator, I should read the problem statement in Project Documentation. (explicit)
FR-70 — Objectives and motivation. As a Faculty Evaluator, I should read objectives and motivation. (explicit)
FR-71 — Architecture diagram. As a Faculty Evaluator, I should see a system architecture diagram. (explicit)
FR-72 — Dataset description and licensing. As a Faculty Evaluator, I should read dataset description and licensing. (explicit)
FR-73 — Preprocessing methodology. As a Faculty Evaluator, I should read data preprocessing methodology. (explicit)
FR-74 — Model architecture documentation. As a Faculty Evaluator, I should read the model architecture. (explicit)
FR-75 — Training methodology. As a Faculty Evaluator, I should read training methodology. (explicit)
FR-76 — Evaluation metrics and actual results. As a Faculty Evaluator, I should read evaluation metrics and actual results. (explicit)
FR-77 — Limitations and future improvements. As a Faculty Evaluator, I should read limitations and future improvements. (explicit)
FR-78 — References and contribution. As a Faculty Evaluator, I should read references and individual contribution. (explicit)
FR-79 — Demonstration checklist. As a Faculty Evaluator, I should use a project checklist for the final demonstration and viva. (explicit)
FR-80 — Upload and validation. As a Student Researcher, I should have image upload and validation in the Flask backend. (explicit)
FR-81 — Prediction endpoint. As a Student Researcher, I should have a prediction endpoint. (explicit)
FR-82 — Efficient model loading. As a Student Researcher, I should have efficient model loading. (explicit)
FR-83 — Consistent preprocessing. As a Student Researcher, I should have preprocessing consistent with the model's training pipeline. (explicit)
FR-84 — Input validation and errors. As a Student Researcher, I should receive input validation and useful error messages. (explicit)
FR-85 — Safe file handling. As a Student Researcher, I should have safe handling of uploaded files. (explicit)
FR-86 — Code separation. As a Student Researcher, I should have clear separation between frontend, backend, model, and training code. (explicit)
FR-87 — Project structure. As a Student Researcher, I should have an organized project structure containing app.py, routes/, model/, training/, dataset/, templates/, static/css/, static/js/, tests/, docs/, requirements.txt, and README.md. (explicit)
FR-88 — Working controls. As a Faculty Evaluator, I should find every navigation link, button, form, upload area, and chart working as intended. (explicit)
FR-89 — Genuine outputs. As a Faculty Evaluator, I should see genuine model outputs wherever available. (explicit)
FR-90 — Graceful missing data. As a Faculty Evaluator, I should see missing datasets and model weights handled gracefully. (explicit)
FR-91 — Setup and testing instructions. As a Student Researcher, I should have clear setup instructions and testing instructions. (explicit)
FR-92 — Local run. As a Student Researcher, I should run the website easily locally using Python. (explicit)
FR-93 — Modular and readable. As a Faculty Evaluator, I should find the implementation modular, readable, and suitable for academic evaluation. (explicit)
FR-94 — Complete deliverable. As a Student Researcher, I should have the complete CropCare AI website with a polished frontend, a Python Flask backend, working image-upload functionality, and integration with the actual deep learning model. (explicit)
FR-95 — Inspect and reuse. As a Student Researcher, I should have available project files and any existing model implementation inspected first and reused where appropriate, without overwriting or deleting existing files without checking them first. (explicit)
FR-96 — Evaluation priority. As a Faculty Evaluator, I should see a working disease-detection pipeline, a professional interface, genuine evaluation metrics, and clear explanations that support the individual Deep Learning project evaluation and viva. (explicit)
FR-97 — Local Flask runtime. As a Student Researcher, I should run the Flask backend locally with Python 3.11, so that the accepted journeys are executable. (required_inference)
FR-98 — Configured model and weights. As a Student Researcher, I should configure the trained TensorFlow/Keras model and weights for real inference, so that Disease Detection can return genuine predictions. (required_inference)
FR-99 — Available dataset. As a Student Researcher, I should make the dataset available, so that Dataset Explorer can show real information. (required_inference)
FR-100 — Real logs and saved models. As a Student Researcher, I should have real training logs and saved model files, so that Model Training and Experiments, Model Comparison, and Error Analysis can show genuine results. (required_inference)
4. User Personas
Student Researcher
The Student Researcher is the BTech Computer Science student who built CropCare AI and must present it during an individual Deep Learning project evaluation and viva. Her product context is the whole site: she runs the Flask application locally, uploads leaf images to demonstrate the working detection pipeline, and walks the evaluator through the dataset, the training experiments, the model comparison, and the error analysis.
Her primary goal is to demonstrate a genuine, working deep learning pipeline with real predictions and real metrics, and to explain the underlying concepts clearly. Her distinct accepted responsibilities are uploading and analyzing leaf images on Disease Detection and reading the predicted class, confidence, inference time, and class-wise probabilities; studying the Deep Learning Lab concepts — neurons and perceptrons, MLPs, CNNs, forward and backpropagation, ReLU/sigmoid/softmax, loss functions and gradient descent, SGD with momentum and Nesterov acceleration, tensor operations, initialization/normalization/regularization/augmentation, and SVD and gradient checking — with diagrams, formulas, and interactive demonstrations; and reviewing the training experiments and documentation. Her inputs are leaf images in JPG, JPEG, or PNG and her decisions are which image to analyze and which experiment or concept to present. She interacts with the Faculty Evaluator by walking through the pages and explaining results. Her observable success is a real prediction displayed with its confidence and probabilities, and a coherent viva narrative backed by real logs and metrics.
Faculty Evaluator
The Faculty Evaluator is the faculty member assessing the project during demonstration and viva. Their product context is verification: they check whether the pipeline is genuine, whether the reported metrics come from real training and evaluation, and whether the student can explain the deep learning concepts.
Their primary goal is to confirm that the project is real, complete, and academically sound. Their distinct accepted responsibilities are inspecting the real training logs, saved model files, and experiment history on Model Training and Experiments; comparing models on accuracy, precision, recall, F1-score, inference time, and confusion matrix on Model Comparison; reviewing the confusion matrix, per-class metrics, correct and misclassified examples, false positives and negatives, overfitting and underfitting analysis, and limitations on Error Analysis; and using the project checklist for the final demonstration and viva in Project Documentation. Their inputs are the displayed real values and the student's explanations; their decisions are whether the evidence is genuine and complete. They interact with the Student Researcher by questioning results and requesting demonstrations. Their observable success is finding real values or an honest "Not evaluated yet" everywhere, with no fabricated statistics and no non-working controls.
5. Core User Flows
Flow 1 — Student Researcher analyzes a leaf image
- The Student Researcher opens the Home / Dashboard and reads the hero heading, subtitle, overview cards, and workflow section; any metric without a real value reads "Not evaluated yet".
- She clicks the prominent "Detect Disease" button and arrives at Disease Detection.
- She selects a JPG, JPEG, or PNG leaf image by browsing or by dragging and dropping it into the upload area.
- The selected image is previewed before analysis.
- She clicks "Analyze Leaf"; the frontend sends the image to the Flask prediction endpoint, which validates the file, preprocesses it consistently with the training pipeline, and runs actual TensorFlow/Keras inference.
- The result panel shows the uploaded leaf image, the predicted disease class, the confidence score, the inference time, and the class-wise probabilities, followed by general educational information about the predicted disease and suggested next steps.
- Failure and recovery: if the file type is unsupported or the image is invalid, a useful validation message appears and she can select another image. If the trained model or weights are unavailable, a clear message explains how to configure them and no prediction is shown. If inference fails, a useful error message appears and she can retry.
- Continuation: she may analyze another leaf or move to the Deep Learning Lab, Model Training and Experiments, or Project Documentation to prepare her explanation.
Flow 2 — Student Researcher studies the Deep Learning Lab for the viva
- The Student Researcher opens the Deep Learning Lab.
- She reads each concept section in turn — artificial neurons and perceptrons, MLPs, CNNs, forward propagation and backpropagation, activation functions such as ReLU, sigmoid, and softmax, loss functions and gradient descent, SGD with momentum and Nesterov acceleration, tensor operations including matrix multiplication, broadcasting, reshaping, and inner products, weight initialization, normalization, regularization, and data augmentation, and SVD and gradient checking.
- For each concept she reads the diagram, the formula, and the simple explanation, and operates the small interactive demonstration.
- Continuation: she returns to the demonstration pages or Project Documentation to rehearse the viva narrative.
Flow 3 — Student Researcher reviews training experiments
- The Student Researcher opens Model Training and Experiments.
- She reviews the model architecture and configuration, including epochs, batch size, learning rate, and optimizer, and the dataset split details.
- She reads the training and validation loss curves and the training and validation accuracy curves rendered from real training logs.
- She checks the training status and experiment history; the page never claims training completed unless it actually has.
- Failure and recovery: if logs or saved model files are missing, a clear message appears instead of invented curves. Continuation: she selects another experiment from the history or moves to Model Comparison.
Flow 4 — Faculty Evaluator verifies training evidence
- The Faculty Evaluator opens Model Training and Experiments.
- They inspect the architecture and configuration, the loss and accuracy curves, the hyperparameters, the split details, the training status, and the experiment history.
- They confirm the curves and status derive from real training logs and saved model files, and that no completion is claimed without evidence.
- Failure and recovery: where evidence is missing, they see a clear message rather than fabricated content. Continuation: they proceed to Model Comparison and Error Analysis.
Flow 5 — Faculty Evaluator compares models
- The Faculty Evaluator opens Model Comparison.
- They read the comparison table across accuracy, precision, recall, F1-score, inference time, and confusion matrix, and interact with the charts.
- Any metric without a real result reads "Not evaluated yet".
- Continuation: they open Error Analysis to inspect the underlying errors.
Flow 6 — Faculty Evaluator reviews error analysis
- The Faculty Evaluator opens Error Analysis.
- They inspect the confusion matrix visualization and the per-class precision, recall, and F1-score.
- They review correctly classified and misclassified examples, and the false positives and false negatives.
- They read the overfitting and underfitting analysis and the limitations and possible causes of incorrect predictions.
- Failure and recovery: where evaluation results are not yet available, "Not evaluated yet" appears and no examples are invented. Continuation: they move to Project Documentation.
Flow 7 — Faculty Evaluator uses the documentation and checklist
- The Faculty Evaluator opens Project Documentation.
- They read the problem statement, objectives and motivation, the system architecture diagram, the dataset description and licensing, the data preprocessing methodology, the model architecture, the training methodology, and the evaluation metrics and actual results.
- They read the limitations and future improvements, the references, and the individual contribution.
- They use the project checklist for the final demonstration and viva to confirm each item.
- Continuation: they return to any page to request a live demonstration from the Student Researcher.
Flow 8 — Student Researcher explores the dataset
- The Student Researcher opens Dataset Explorer.
- She reads the dataset summary and image counts, the disease classes and sample leaf images, the training/validation/testing split distribution, and the class distribution charts.
- She opens an image preview with its basic image information and reads the dataset source and license information.
- Failure and recovery: if the dataset is unavailable, a clear message appears and no counts, classes, or samples are invented. Continuation: she returns to Model Training and Experiments or Project Documentation.
6. Visuals Colors and Theme
The creative direction is authoritative: warm editorial clarity after Frank Chimero — calm, academic, and trustworthy rather than a startup pitch. The user's explicit palette requirement (forest green, emerald green, white, warm cream) is satisfied by these tokens.
Mode: light.
Color tokens by role
- Background:
#F4EEE2(warm cream ground) - Surface:
#FFFDF7(paper-white cards) - Text:
#1E2B22(ink) - Primary:
#14532D(forest green — headings, rules, primary button block) - Accent:
#1F7A4D(emerald — actions and data) - Muted:
#6B7A6C(secondary text, labels) - Hairline: 1px warm border on surfaces
Typography
- Headings: Fraunces, 600 weight, tight leading, mixed case; small caps for labels.
- Body: Source Serif 4.
- Scale: 1.333 modular — desktop 64/44/30/21/17; mobile 34/28/22/17/16.
Shape and spacing
- Soft 14px card radii, 1px warm hairlines, flat surfaces; warmth carried by illustration and rules, not shadows.
- Single-column reading measure at 68 characters; cards in a 12-column grid; section openers use an illustrated band with a wide margin.
Imagery
- Warm flat illustration of leaves, cells, and network diagrams with hand-drawn accents; real leaf photos only from the dataset.
Motion
- Restrained: slow 300ms fades on section entry; small illustrated marks draw in once; no bounce.
Readability rule
- Headlines, wordmarks, labels, numbers, and card text and controls stay whole inside the viewport and their container at 375px, 768px, and 1280px, wrapping or scaling with
clamp(...); imagery and decoration may crop or bleed but never cover readable text or controls.
7. Signature Design Concept
The public entry is a cream editorial page. The headline "Detect Crop Diseases. Protect Every Harvest." is set left in Fraunces at 64px desktop and 34px mobile, spanning nine columns with a thin forest-green rule beneath it. Under the subline "Deep learning reads a leaf image and classifies its disease. You see the model result and the next steps." sits the "Detect Disease" call to action as a solid forest-green block. A large flat leaf illustration occupies the right column. Below, the four overview cards present total images evaluated, supported disease classes, available models, and model accuracy — each value or the words "Not evaluated yet" in the same type size. The workflow appears as a ruled horizontal sequence — Upload Image → AI Analysis → Disease Prediction → Recommended Next Steps — with small flat leaf icons, followed by the objectives and benefits section. Every page opens with a warm illustrated band and a numbered section label, carrying the same editorial rhythm.
8. Interaction Model & Motion Direction
Interaction Model: Animated Motion Tempo: restrained Hero Dimensionality: flat
Landing Hero Motion Brief
- Focal subject: the large flat leaf illustration in the right column against the cream ground.
- Thesis: on load, the headline and forest rule settle in with a slow 300ms fade; the leaf illustration's hand-drawn marks draw in once; the "Detect Disease" block and overview cards fade in sequence. Input (page load) → transformation (restrained staggered fades and a single draw-in) → outcome (a composed, readable editorial hero with the call to action prominent).
- Motion vocabulary: slow 300ms fades, one-time illustrated mark draw-in, no bounce, no gradient blobs, no glass panels.
- Composed first frame: headline left in Fraunces, thin forest rule beneath, subline, solid forest-green "Detect Disease" block, flat leaf illustration right, overview cards below.
- Reduced-motion state: all elements appear in their final positions with no fades or draw-ins; the layout remains fully readable and the call to action fully visible.
9. Non-Functional Requirements
- Truthfulness (explicit): never display fabricated model accuracy or fake statistics; show actual values when available and otherwise "Not evaluated yet". Never generate random or hardcoded predictions. Do not claim training completed unless it actually has. Do not create fake functionality, simulated predictions, fabricated metrics, or placeholder buttons that pretend to work.
- Genuine outputs (explicit): use genuine model outputs wherever available; use real training logs and saved model files.
- Graceful degradation (explicit): handle missing datasets and model weights gracefully with clear messages, including how to configure the trained model and weights.
- Safety (explicit): safe handling of uploaded files, input validation, and useful error messages.
- Consistency (explicit): preprocessing must be consistent with the model's training pipeline.
- Efficiency (explicit): efficient model loading.
- Reliability (explicit): every navigation link, button, form, upload area, and chart works as intended.
- Responsiveness (explicit): responsive design for desktop, tablets, and mobile devices.
- Maintainability (explicit): modular, readable implementation with clear separation between frontend, backend, model, and training code, suitable for academic evaluation.
- Local operability (explicit): easy to run locally using Python, with clear setup and testing instructions.
- Readability at every viewport (explicit): readable text and controls stay whole at 375px, 768px, and 1280px.
10. Tech Stack
- Backend: Python 3.11 with Flask.
- Deep Learning: TensorFlow/Keras.
- Image Processing: OpenCV and Pillow.
- Data Analysis: NumPy, Pandas, Scikit-learn.
- Frontend: HTML5, CSS3, JavaScript, Bootstrap 5.
- Charts: Chart.js.
- Testing: Pytest.
- Project structure:
app.py,routes/,model/,training/,dataset/,templates/,static/css/,static/js/,tests/,docs/,requirements.txt,README.md. - Excluded: Java, Spring Boot, React, Node.js. The application stays primarily Python-based, with HTML, CSS, and JavaScript for the frontend.
- Provisioned infrastructure inventory: a shared backend process for application APIs and domain modules (realized by the Flask application), a MariaDB database, a React frontend, and a LiteLLM gateway backed by PostgreSQL. These are infrastructure facts only; the accepted product uses the Flask backend and Bootstrap frontend, and no accepted workflow requires the React UI, the LiteLLM gateway, or application-owned persistent data. No additional infrastructure is required for the accepted workflows.
11. Assumptions and Constraints
- Assumption: the project is run locally by the Student Researcher with Python 3.11 and the dependencies in
requirements.txt. (required_inference) - Assumption: the trained TensorFlow/Keras model and weights are configured for real inference; until then Disease Detection shows the configuration message. (required_inference)
- Assumption: the dataset is available for Dataset Explorer; until then it shows a clear message. (required_inference)
- Assumption: real training logs and saved model files exist for training, comparison, and error analysis views; missing results render as "Not evaluated yet". (required_inference)
- Constraint: do not use Java, Spring Boot, React, or Node.js. (explicit)
- Constraint: keep the application primarily Python-based, with HTML, CSS, and JavaScript for the frontend. (explicit)
- Constraint: never display fabricated model accuracy or fake statistics. (explicit)
- Constraint: never generate random or hardcoded predictions. (explicit)
- Constraint: do not claim that training has completed unless it actually has. (explicit)
- Constraint: do not create fake functionality, simulated predictions, fabricated metrics, or placeholder buttons that pretend to work. (explicit)
- Constraint: do not overwrite or delete existing project files without checking them first; inspect and reuse existing implementation where appropriate. (explicit)
- Constraint: a pretrained model such as ResNet is included only if it can be implemented and tested properly. (explicit)
- Access: all eight pages are publicly reachable with no account or permission requirement; no authentication is part of the accepted scope. (explicit page contract)
12. Glossary
- CropCare AI: the project and website for crop disease detection and classification using deep learning.
- Leaf image: a JPG, JPEG, or PNG photograph of a crop leaf submitted for analysis.
- Prediction: the model's output for a leaf image, comprising the predicted disease class, confidence score, inference time, and class-wise probabilities.
- Confidence score: the model's probability assigned to the predicted class.
- Inference time: the time taken to run model inference for one image.
- Class-wise probabilities: the model's probability for each supported disease class.
- MLP: Multilayer Perceptron, the simple baseline model.
- CNN: Convolutional Neural Network, the primary model.
- ResNet: a pretrained model included only if it can be implemented and tested properly.
- Confusion matrix: a table of actual versus predicted classes used in comparison and error analysis.
- Precision, recall, F1-score: evaluation metrics reported per model and per class.
- Not evaluated yet: the exact wording shown wherever a real value is unavailable.
- Training logs: real records of training runs used for curves, status, and history.
- Saved model files: real persisted model artifacts used for inference and evaluation.
- Deep Learning Lab: the educational page explaining the project's deep learning concepts with diagrams, formulas, and interactive demonstrations.
- Viva: the individual oral evaluation of the Deep Learning project.
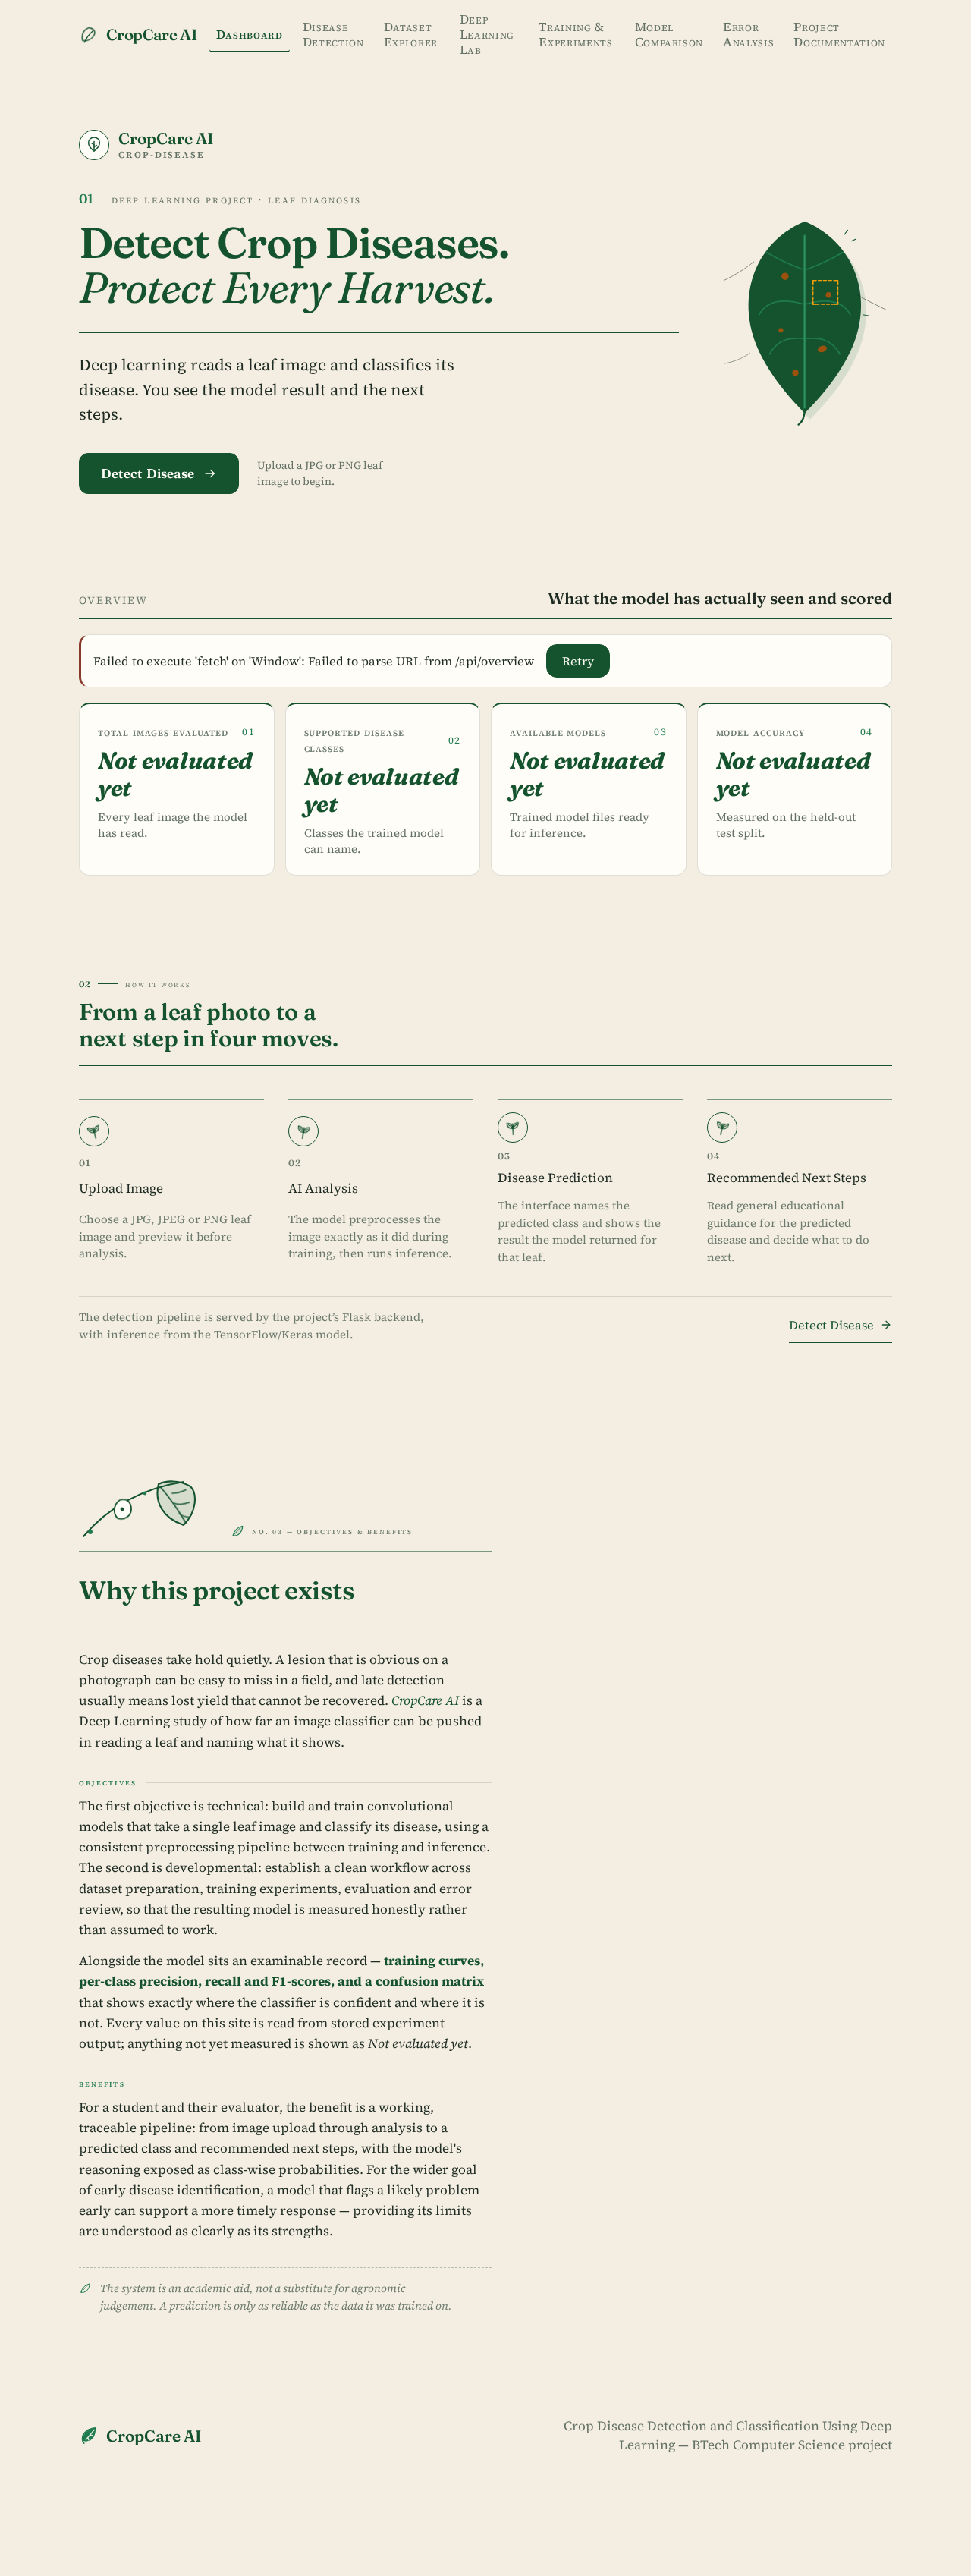
01Deep learning project · leaf diagnosis
Detect Crop Diseases. Protect Every Harvest.
Deep learning reads a leaf image and classifies its disease. You see the model result and the next steps.
What the model has actually seen and scored
Total images evaluated
Not evaluated yet
Supported disease classes
Not evaluated yet
Available models
Not evaluated yet
Model accuracy
Not evaluated yet
02How it works
From a leaf photo to a next step in four moves.
- Upload ImageChoose a JPG, JPEG or PNG leaf image and preview it before analysis.
- AI AnalysisThe model preprocesses the image exactly as it did during training, then runs inference.
- Disease PredictionThe interface names the predicted class and shows the result the model returned for that leaf.
- Recommended Next StepsRead general educational guidance for the predicted disease and decide what to do next.
No. 03 — Objectives & Benefits
Why this project exists
Crop diseases take hold quietly. A lesion that is obvious on a photograph can be easy to miss in a field, and late detection usually means lost yield that cannot be recovered. CropCare AI is a Deep Learning study of how far an image classifier can be pushed in reading a leaf and naming what it shows.
Objectives
The first objective is technical: build and train convolutional models that take a single leaf image and classify its disease, using a consistent preprocessing pipeline between training and inference. The second is developmental: establish a clean workflow across dataset preparation, training experiments, evaluation and error review, so that the resulting model is measured honestly rather than assumed to work.
Alongside the model sits an examinable record — training curves, per-class precision, recall and F1-scores, and a confusion matrix that shows exactly where the classifier is confident and where it is not. Every value on this site is read from stored experiment output; anything not yet measured is shown as Not evaluated yet.
Benefits
For a student and their evaluator, the benefit is a working, traceable pipeline: from image upload through analysis to a predicted class and recommended next steps, with the model's reasoning exposed as class-wise probabilities. For the wider goal of early disease identification, a model that flags a likely problem early can support a more timely response — providing its limits are understood as clearly as its strengths.
01Deep learning project · leaf diagnosis
Detect Crop Diseases. Protect Every Harvest.
Deep learning reads a leaf image and classifies its disease. You see the model result and the next steps.
What the model has actually seen and scored
Total images evaluated
Not evaluated yet
Supported disease classes
Not evaluated yet
Available models
Not evaluated yet
Model accuracy
Not evaluated yet
02How it works
From a leaf photo to a next step in four moves.
- Upload ImageChoose a JPG, JPEG or PNG leaf image and preview it before analysis.
- AI AnalysisThe model preprocesses the image exactly as it did during training, then runs inference.
- Disease PredictionThe interface names the predicted class and shows the result the model returned for that leaf.
- Recommended Next StepsRead general educational guidance for the predicted disease and decide what to do next.
No. 03 — Objectives & Benefits
Why this project exists
Crop diseases take hold quietly. A lesion that is obvious on a photograph can be easy to miss in a field, and late detection usually means lost yield that cannot be recovered. CropCare AI is a Deep Learning study of how far an image classifier can be pushed in reading a leaf and naming what it shows.
Objectives
The first objective is technical: build and train convolutional models that take a single leaf image and classify its disease, using a consistent preprocessing pipeline between training and inference. The second is developmental: establish a clean workflow across dataset preparation, training experiments, evaluation and error review, so that the resulting model is measured honestly rather than assumed to work.
Alongside the model sits an examinable record — training curves, per-class precision, recall and F1-scores, and a confusion matrix that shows exactly where the classifier is confident and where it is not. Every value on this site is read from stored experiment output; anything not yet measured is shown as Not evaluated yet.
Benefits
For a student and their evaluator, the benefit is a working, traceable pipeline: from image upload through analysis to a predicted class and recommended next steps, with the model's reasoning exposed as class-wise probabilities. For the wider goal of early disease identification, a model that flags a likely problem early can support a more timely response — providing its limits are understood as clearly as its strengths.
No comments yet. Be the first!