clever-system
 Satyam Maravaniya
GenBI System – Build Specification 🎯 Objective I want to build a system where: User uploads a CSV file File is stored inside PostgreSQL (Docker-based PostgreSQL container) User interacts via chat AI analyzes data, gives insights, answers queries AI can modify data (add/remove/update rows or columns) All changes are tracked User can revert (undo) any action System maintains full audit trail This must be built as a production-ready architecture. 🧠 Core Functional Requirements 1️⃣ File Upload & Storage User uploads CSV Backend parses CSV Create table dynamically in PostgreSQL Store original dataset Maintain version history table Use Docker-based PostgreSQL image 2️⃣ Chat-Based Data Interaction User can: Ask questions: Ask for insights: Trends Aggregations Outliers Ask for modifications: "Remove duplicates" "Delete rows where amount < 0" "Add new column profit = revenue - cost" "Update all dates to 2024 format" System must: Generate SQL or Python code Execute safely Update database Return result 3️⃣ Data Versioning & Revert Every modification creates new version Store: Previous state SQL executed Timestamp User action User can: Revert to any previous version View change history Maintain audit log table 4️⃣ Agentic Architecture Use: LangGraph Tool-based architecture Google Gemini API key The AI must act as: Data Analyst + Data Engineer Agent Agent Flow: Understand user query Decide which tool to use Execute tool Validate output Return response 🛠 Required Tools (LangGraph Tools) Create tools: Schema Inspection Tool SQL Query Tool Data Cleaning Tool Aggregation Tool Data Update Tool Version Control Tool Revert Tool Insight Generation Tool Each tool: Executes structured logic Returns structured output Logs operation 🏗 Technical Stack Backend Python FastAPI LangGraph Google Gemini API (API Key) PostgreSQL SQLAlchemy Docker Frontend Node.js (or Next.js) Chat Interface File Upload UI Version History Panel Revert Button Data Table Preview 🐳 Infrastructure Docker Setup Create: Dockerfile (Backend) Dockerfile (Frontend) Dockerfile (PostgreSQL optional if needed) docker-compose.yml Docker Compose services: backend (FastAPI) frontend (Node.js) postgres redis (optional for state/session) 🔐 Security & Safety No raw SQL execution without validation Validate generated SQL Use parameterized queries Restrict dangerous operations (DROP DATABASE, etc.) Role-based DB access Session isolation 🔄 System Flow User uploads CSV CSV stored into PostgreSQL Schema extracted Metadata sent to Gemini Agent decides action Tool executes SQL/Python Result returned Version stored Audit log updated User can revert 📊 Output & Tracking System must show: Query result SQL executed Version number Change log Previous versions Revert option 📦 Deliverables Required Generate: Full system architecture Folder structure FastAPI backend skeleton LangGraph agent flow Gemini prompt template Tool implementations (basic structure) PostgreSQL schema design Versioning strategy Dockerfile (backend & frontend) docker-compose.yml Example API endpoints Sample agent execution flow
Comments (0)
Sign in to leave a comment
System Requirements
System Requirements Document (SRD)
1. Introduction
The GenBI System is designed to revolutionize how users interact with and manage datasets. By combining AI-powered analytics, chat-based interaction, and robust version control, the system provides an intuitive and production-ready architecture for data manipulation and insights. The system allows users to upload CSV files, interact with the data via chat, and track every change with a full audit trail, ensuring transparency and control. Additionally, the system will provide human-readable explanations for version history changes, highlighting the impact on the dataset for better clarity and usability.
2. System Overview
The GenBI System enables users to:
- Upload CSV files for storage and analysis.
- Interact with the data through a chat interface powered by AI.
- Gain insights, perform data modifications, and track all changes.
- Revert to any previous version of the dataset with a detailed version history.
- View human-readable summaries of changes in the version history panel, including the impact on the dataset (e.g., rows/columns affected).
- Access both quick tooltips and expandable details for deeper insights into each version's changes.
The system is built on a robust backend architecture using Python, FastAPI, and PostgreSQL, with a Docker-based infrastructure for scalability and reliability. The AI is powered by Google Gemini, acting as both a Data Analyst and Data Engineer.
3. Functional Requirements as Story Points
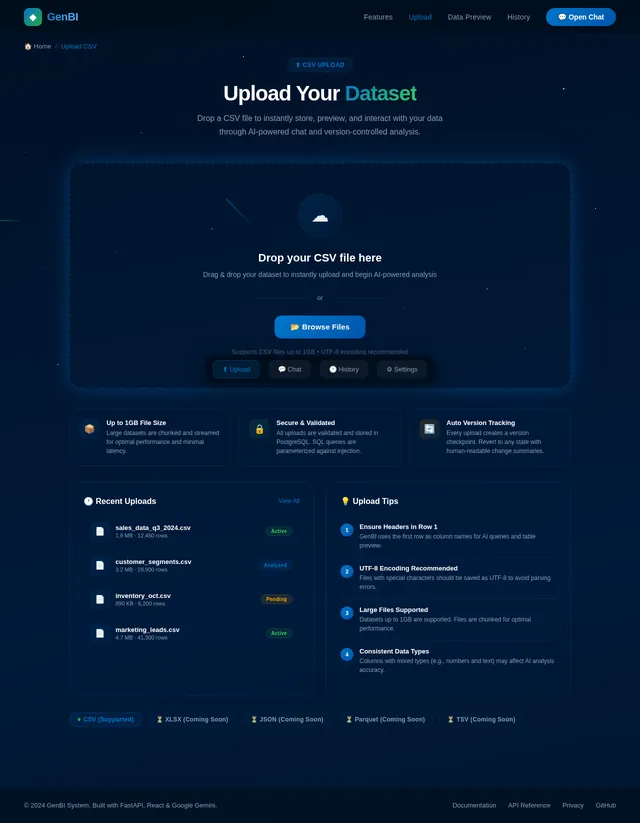
- As a User, I should be able to upload a CSV file.
- As a User, I should be able to view the uploaded data in a preview table.
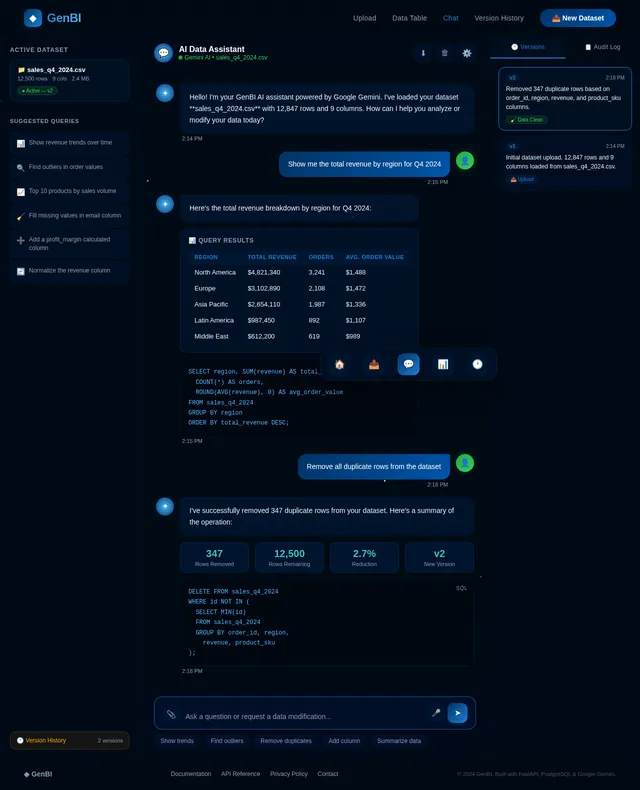
- As a User, I should be able to interact with the data via a chat interface.
- As a User, I should be able to ask questions about the data, such as trends, aggregations, and outliers.
- As a User, I should be able to request data modifications, such as removing duplicates, deleting rows, adding columns, or updating values.
- As a User, I should be able to see the results of my queries and modifications.
- As a User, I should be able to view a version history panel with summaries of changes.
- As a User, I should be able to see a more human-readable explanation of changes in the version history panel.
- As a User, I should be able to see how changes impacted the dataset, such as the number of rows or columns affected.
- As a User, I should be able to revert to any previous version of the dataset.
- As a User, I should be able to view the SQL executed for any change.
- As a User, I should be able to see a detailed audit log of all actions.
- As a User, I should be able to view quick tooltips for version history summaries.
- As a User, I should be able to expand version history entries to see detailed human-readable explanations and impact summaries.
4. User Personas
1. Data Analyst
- Goals: Gain insights from data, perform aggregations, and identify trends.
- Needs: A user-friendly interface for querying data and generating insights.
- Pain Points: Manual data analysis and lack of intuitive tools.
2. Data Engineer
- Goals: Modify datasets, clean data, and ensure data integrity.
- Needs: Tools for data cleaning, updating, and version control.
- Pain Points: Lack of robust versioning and audit trails.
3. General User
- Goals: Upload data, interact with it, and track changes.
- Needs: An intuitive chat interface and clear version history.
- Pain Points: Difficulty in understanding technical logs and reverting changes.
4. Power User
- Goals: Quickly perform advanced operations and revert changes efficiently.
- Needs: Command-based interactions like "undo last change" and detailed version history logs.
- Pain Points: Limited flexibility in reverting changes and lack of detailed impact summaries.
5. Visuals Colors and Theme
The GenBI System will use a modern, clean, and professional theme:
- Primary Colors: Deep Blue (#003366) and White (#FFFFFF) for a professional look.
- Secondary Colors: Light Gray (#F5F5F5) for backgrounds and accents, and Green (#28A745) for success indicators.
- Highlight Colors: Orange (#FFA500) for warnings and Red (#FF0000) for errors.
- Typography: Sans-serif fonts like Open Sans or Roboto for readability.
- Icons: Minimalistic, flat icons for tools and actions.
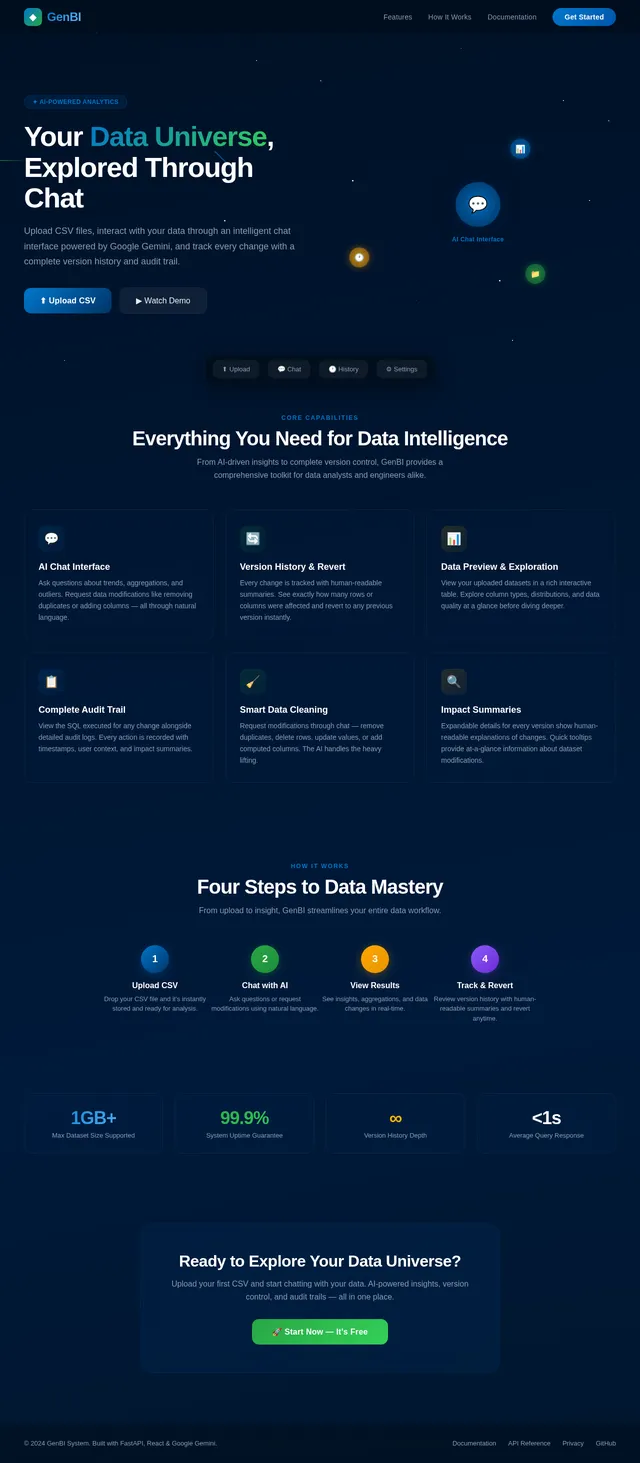
6. Signature Design Concept
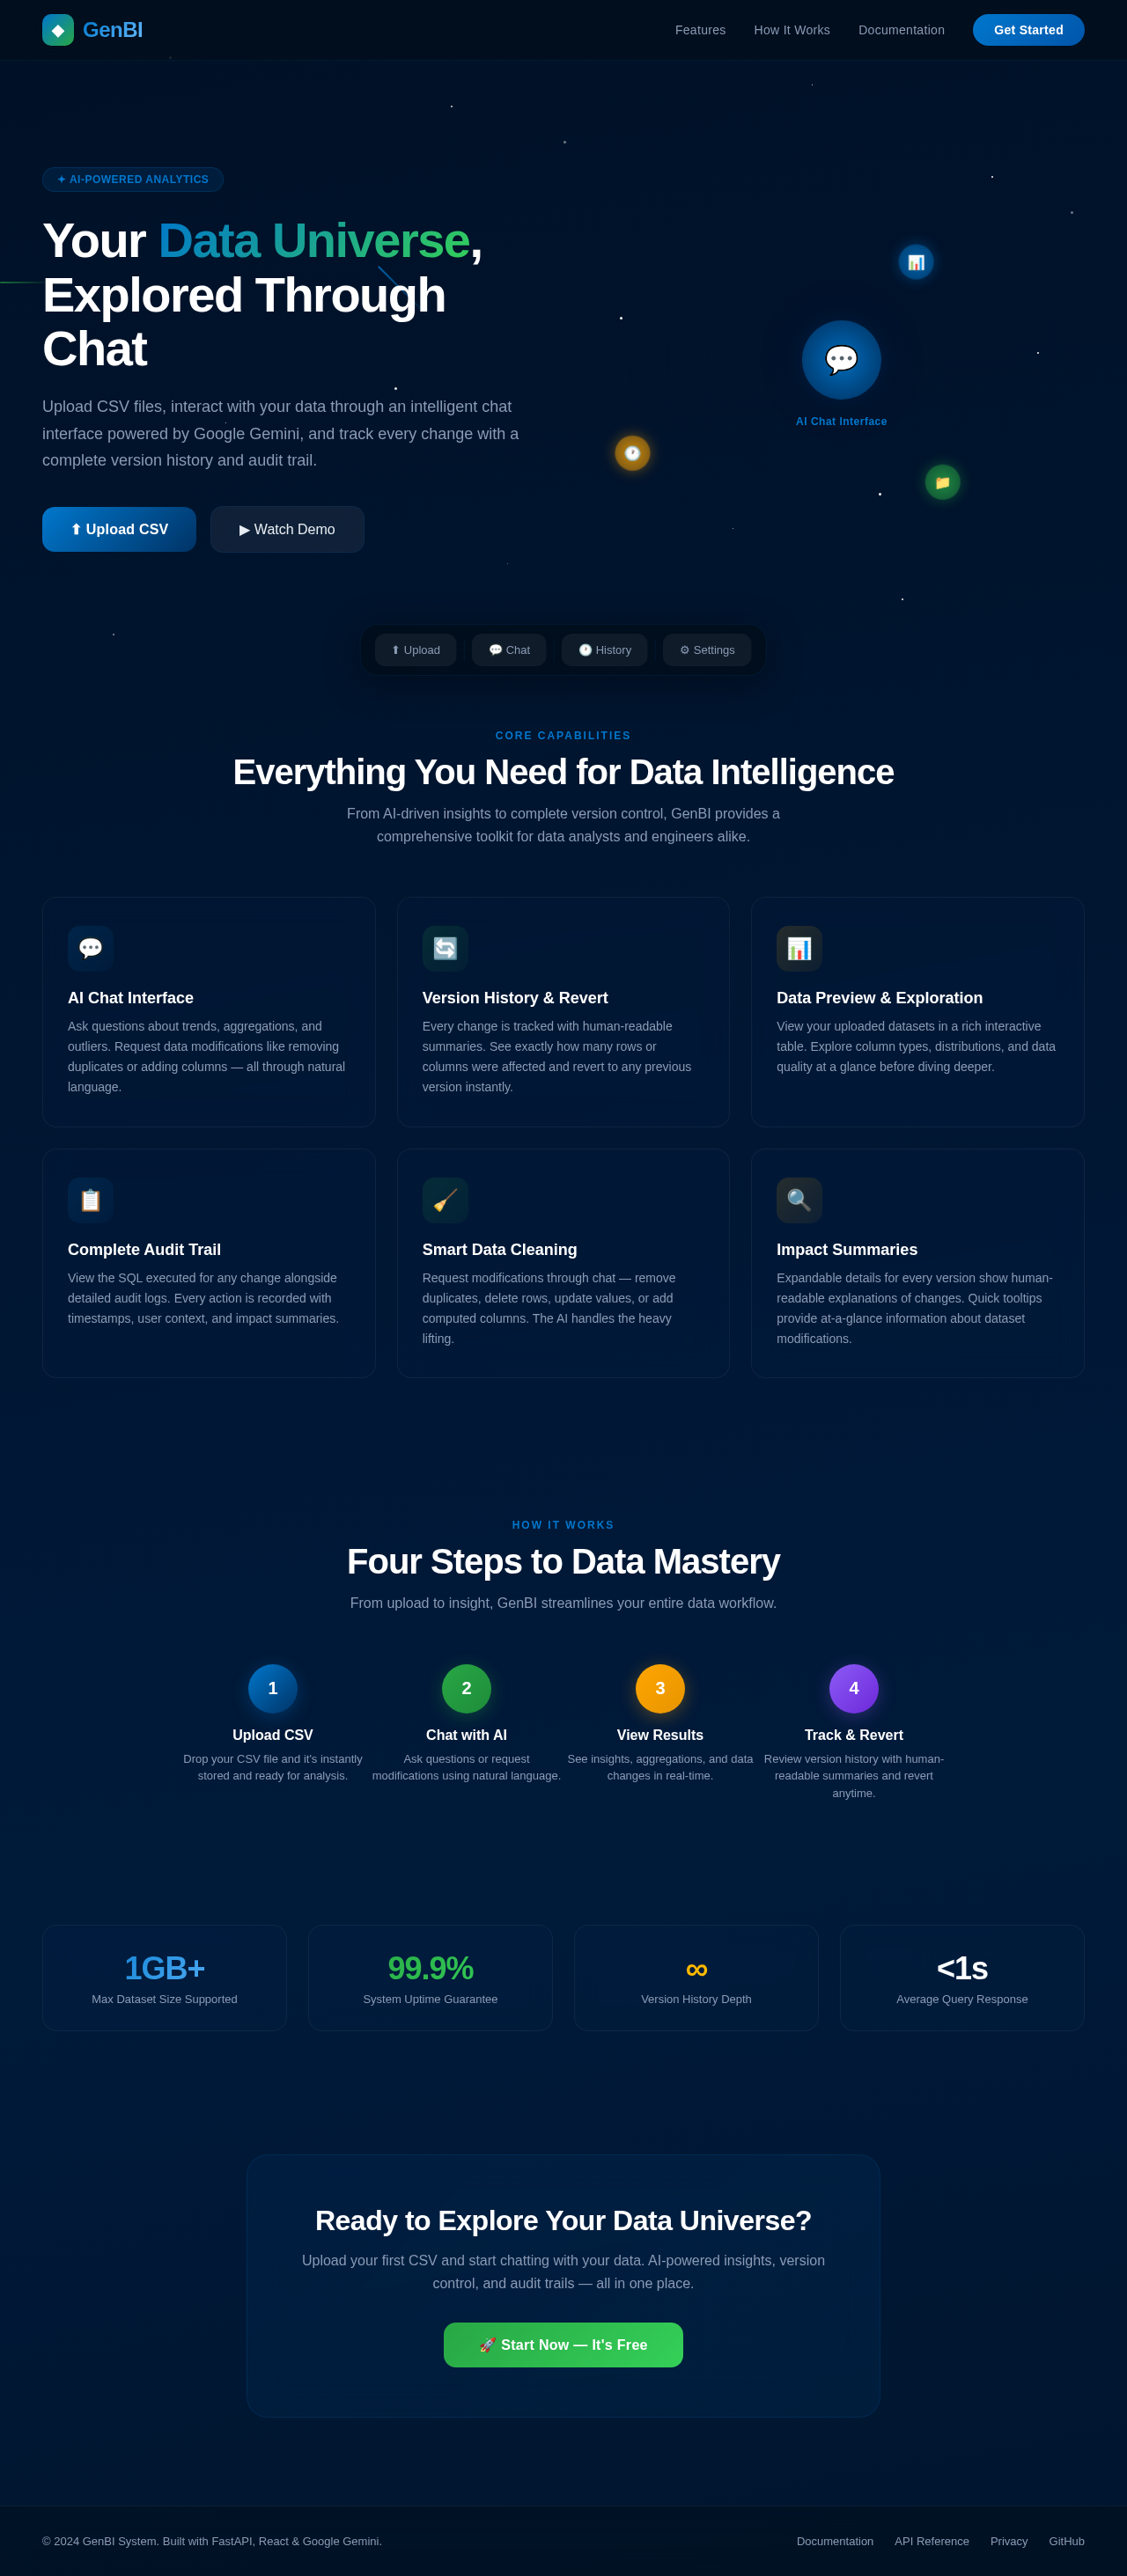
Interactive Data Universe Landing Page
The homepage will immerse users in an interactive galaxy of data. The screen will feature a 3D rotating universe where each star represents a dataset or tool. Users can:
- Hover over stars to see tooltips with dataset names or tool descriptions.
- Click on stars to "zoom in" and access specific datasets or tools.
- Navigate between stars using a smooth, physics-based drag-and-drop motion.
The background will feature a dynamic starfield animation, subtly shifting colors based on the time of day (e.g., warm tones at sunrise, cool tones at night). Micro-interactions include:
- Stars pulsing gently when hovered over.
- A comet-like animation when transitioning between sections.
- A glowing "central star" representing the chat interface, inviting users to interact.
The landing page will also include a floating toolbar for quick access to file uploads, version history, and settings. This concept ensures the first impression is both visually stunning and functionally engaging.
7. Non-Functional Requirements
- Performance: The system must handle datasets up to 1GB in size with minimal latency.
- Scalability: The architecture must support multiple concurrent users.
- Security: All SQL queries must be validated and parameterized to prevent SQL injection.
- Reliability: The system must maintain a 99.9% uptime.
- Usability: The interface must be intuitive for both technical and non-technical users.
- Clarity: Version history must include human-readable summaries of changes and their impact on the dataset.
- Accessibility: The system must support tooltips and expandable details for version history entries.
8. Tech Stack
Frontend
- React for Web
- Chat Interface
- File Upload UI
- Version History Panel
- Revert Button
- Data Table Preview
Backend
- Python
- FastAPI
- LangGraph
- Google Gemini API
Database
- PostgreSQL (Docker-based)
- SQLAlchemy for ORM
- Alembic for migrations
Infrastructure
- Docker
- docker-compose
AI Tools
- Google Gemini API for AI interactions
- LangGraph for tool-based architecture
9. Assumptions and Constraints
- Users will primarily interact with the system via the chat interface.
- The system will only support CSV file uploads initially.
- PostgreSQL will be used for all data storage and versioning.
- All AI interactions will be powered by Google Gemini.
- Human-readable explanations for version history changes will be generated dynamically.
- Impact summaries will include details such as the number of rows or columns affected.
10. Glossary
- CSV: Comma-Separated Values, a file format for tabular data.
- LangGraph: A tool-based architecture for AI workflows.
- Google Gemini: An AI model used for data analysis and interaction.
- Version History Panel: A UI component showing the history of changes made to the dataset.
- Audit Log: A record of all actions performed on the dataset.
- Human-Readable Explanation: A simplified summary of changes made to the dataset, such as "Removed duplicates in 'sales_data' (affected 200 rows)."
- Impact on Dataset: A description of how a change affected the dataset, such as the number of rows or columns modified.
- Tooltip: A small pop-up that provides quick information when hovering over an element.
- Expandable Details: A UI feature that allows users to click and view more detailed information about a specific item.
This updated SRD incorporates the requirement for human-readable explanations of version history changes, impact summaries, and their display in the history panel, ensuring clarity and usability for all users.
No comments yet. Be the first!