cedar-dashboard
 Shashank Rautkar
Build a premium production-ready frontend UI for my project named: DIGITAL TWIN Project Type: Smart Waste Management Dashboard with full backend integration. Tech Stack: React + Vite + Tailwind CSS + Framer Motion + Leaflet + Chart.js Deploy Target: AWS S3 Static Website Hosting (optimized build ready) Backend API: https://z29gy8hv2i.execute-api.ap-south-1.amazonaws.com/data Use GET + POST requests. Backend Response Parsing: const raw = await (await fetch(API)).json(); const parsed = raw.body ? JSON.parse(raw.body) : raw; const data = parsed.data ? parsed.data : parsed; Use: data.trucks || [] data.bins || [] data.alerts || data.bins || [] data.analytics || {} Create a modern futuristic Digital Twin control dashboard. UI Theme: Dark glassmorphism Neon accents Smooth animations Enterprise quality Fully responsive desktop/mobile Pages: 1 Dashboard 2 Fleet 3 Smart Bins 4 Analytics 5 Settings Top Navbar: DIGITAL TWIN logo Live clock Theme toggle Profile menu Logout Sidebar: Animated icons + page navigation Login / Signup: Modern auth UI using localStorage Remember login session Dashboard Features: KPI Cards: - Total Trucks - Total Bins - Overflow Bins - Active Jobs - Avg Response Time Live Map: Use browser geolocation for user location Fallback Pune India Leaflet Map: - Animated truck markers - Truck movement smooth transitions - Bin markers: red = critical yellow = warning green = normal - Pulse effect on critical bins - Animated route lines nearest truck to critical bin - User live location marker - Popups with full details Fleet Table: Truck ID Driver Status ETA Load % Bins Table: Bin ID Zone Fill % Status Predicted Hours Alerts Panel: Readable cards only Bin ID Zone Fill % Priority Time Charts: Bar chart zone fill % Doughnut status split Line chart overflow history Buttons: Refresh Data -> GET Demo Overflow -> POST {"action":"demo_run"} Cleanup Reset -> POST {"action":"full_cleanup"} Add Critical Bin -> POST random critical bin Theme Toggle POST Helper: fetch(API,{ method:"POST", headers:{"Content-Type":"application/json"}, body:JSON.stringify(payload) }) AI Widgets: Nearest truck recommendation Dispatch priority list Predicted fill alerts Extra UI: Loading screen Toast notifications Count-up KPI animation Hover glow effects Smooth page transitions Styled scrollbar Rules: No dummy data No console errors No broken buttons Auto refresh every 5 sec Production clean code Output: Complete frontend codebase ready for npm install, npm run build, upload dist folder to AWS S3 static hosting.

Comments (0)
Sign in to leave a comment
System Requirements
System Requirements Document (SRD)
Project Name: cedar-dashboard
1. Introduction
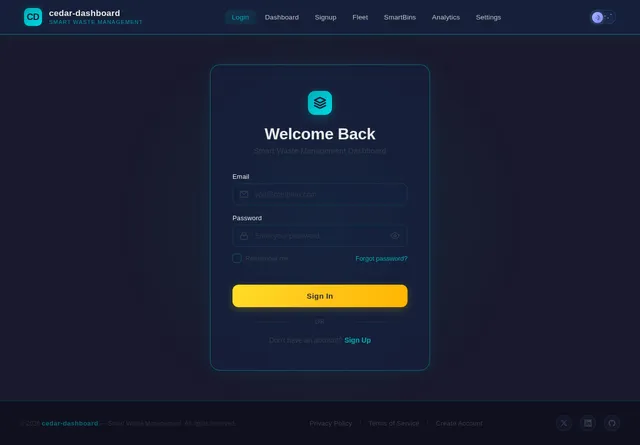
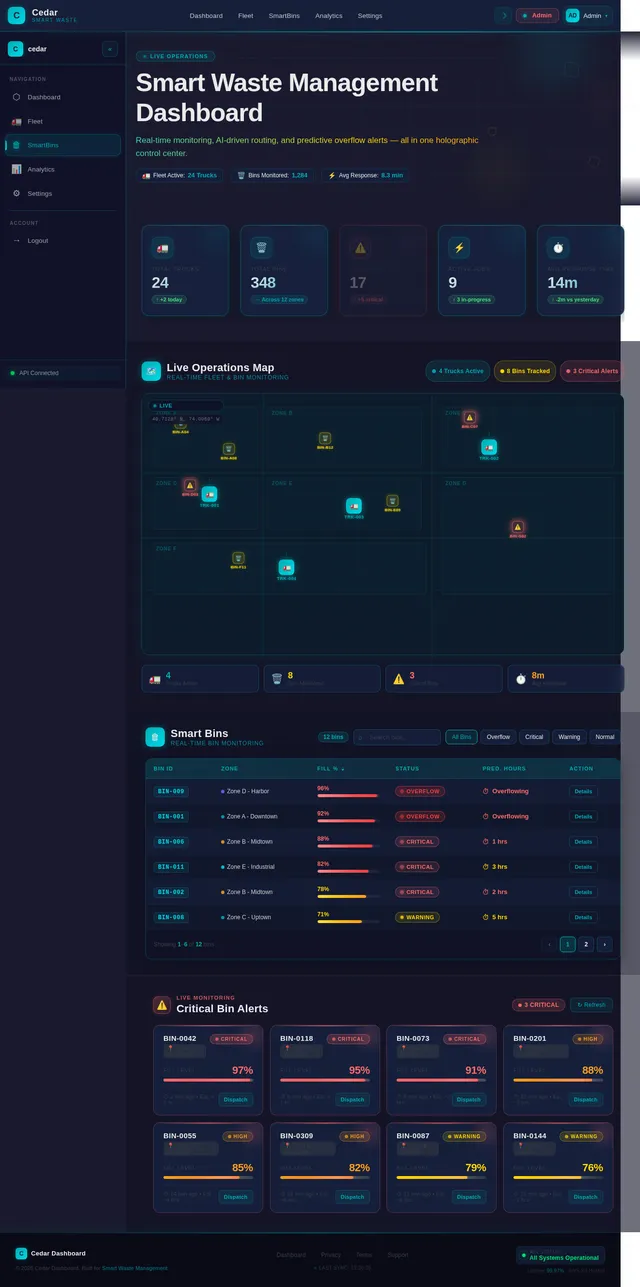
The cedar-dashboard is a premium, production-ready frontend UI designed for a Smart Waste Management Dashboard. It integrates seamlessly with a backend API to provide real-time data visualization, analytics, and control for waste management operations. The dashboard is built with a futuristic design aesthetic, leveraging dark glassmorphism, neon accents, and smooth animations to deliver a cutting-edge user experience.
This document outlines the system requirements for the cedar-dashboard, ensuring alignment with the project goals and user expectations.
2. System Overview
The cedar-dashboard is a modern, enterprise-grade digital twin control dashboard tailored for smart waste management. It provides users with real-time insights into fleet operations, bin statuses, and analytics, enabling efficient decision-making and resource allocation.
The system is designed to:
- Visualize live data from the backend API.
- Offer AI-driven recommendations for operational efficiency.
- Provide a responsive and interactive user interface for desktop and mobile users.
- Ensure seamless integration with backend services hosted on AWS.
Key Features:
- Real-time KPI cards and analytics.
- Interactive live map with animated markers and routes.
- AI widgets for predictive insights.
- Fully responsive design with enterprise-grade quality.
3. Functional Requirements
As User:
- I should be able to view real-time KPI cards (Total Trucks, Total Bins, Overflow Bins, Active Jobs, Avg Response Time).
- I should see a live map with animated truck and bin markers, including critical bin alerts.
- I should interact with a fleet table displaying truck details (Truck ID, Driver, Status, ETA, Load %).
- I should access a bins table with bin details (Bin ID, Zone, Fill %, Status, Predicted Hours).
- I should view an alerts panel with readable cards for critical bins.
- I should analyze data using bar charts, doughnut charts, and line charts.
- I should toggle between light and dark themes.
- I should log in and sign up with a modern authentication UI.
- I should receive toast notifications for system updates.
- I should see smooth animations and transitions across the UI.
As Admin:
- I should be able to refresh data using a GET request.
- I should trigger a demo overflow scenario using a POST request.
- I should reset the system using a POST request.
- I should add a random critical bin using a POST request.
- I should manage user sessions and logout functionality.
4. User Personas
1. Admin
- Role: Oversees system operations and manages critical actions.
- Needs: Full access to all features, including data refresh, system reset, and critical bin management.
2. User
- Role: Monitors real-time data and analytics for operational decision-making.
- Needs: Access to KPI cards, live map, tables, alerts, and charts.
5. Visuals Colors and Theme
The cedar-dashboard adopts a futuristic dark glassmorphism theme with neon accents. Below is the unique color palette:
- Background: #1A1A2E
- Surface: #16213E
- Text: #EAEAEA
- Accent: #00ADB5
- Muted: #393E46
This palette ensures high contrast, readability, and a modern aesthetic.
6. Signature Design Concept
Interactive Holographic Dashboard
The homepage of the cedar-dashboard will feature an interactive holographic interface that immerses users in a futuristic control center.
-
Visuals:
The background will simulate a 3D holographic grid with subtle animations, giving the impression of a high-tech command center. KPI cards will appear as floating glass panels with neon outlines, casting soft glows onto the grid. -
Animations:
- KPI cards will "hover" slightly when moused over, with a gentle bounce effect.
- The live map will feature animated truck and bin markers with glowing trails for moving trucks.
- Sidebar icons will light up with a ripple effect when clicked.
-
Interactions:
- Users can drag and rearrange KPI cards on the dashboard.
- Clicking on a bin marker will expand a detailed popup with animations.
- The theme toggle will feature a sun/moon morphing animation.
-
Micro-interactions:
- Buttons will emit a neon glow on hover.
- Toast notifications will slide in from the top-right corner with a fade effect.
This design will make the cedar-dashboard an unforgettable experience, blending functionality with futuristic aesthetics.
7. Non-Functional Requirements
- Performance: The dashboard must load within 2 seconds on a standard broadband connection.
- Scalability: The system should handle up to 10,000 concurrent users.
- Security: Implement HTTPS, secure authentication, and data encryption.
- Reliability: Ensure 99.9% uptime with auto-refresh functionality every 5 seconds.
- Responsiveness: The UI must adapt seamlessly to desktop and mobile devices.
8. Tech Stack
Frontend:
- React (Web)
- Vite (Build Tool)
- Tailwind CSS (Styling)
- Framer Motion (Animations)
- Leaflet (Maps)
- Chart.js (Charts)
Backend:
- Python
- FastAPI
Database:
- MySQL (RDBMS)
AI Tools:
- GPT 5.4 (User-friendly responses)
- Litellm (LLM Routing)
Orchestration:
- Docker
- Kubernetes
9. Assumptions and Constraints
- The backend API will remain stable and accessible at all times.
- User geolocation will be enabled for live map functionality.
- The system will be deployed on AWS S3 for static hosting.
- All POST requests will follow the specified payload structure.
10. Glossary
- KPI: Key Performance Indicator.
- Digital Twin: A virtual representation of a physical system.
- Glassmorphism: A design style featuring translucent surfaces and frosted glass effects.
- Neon Accents: Bright, glowing colors used for emphasis.
- Toast Notifications: Small, temporary messages displayed on the screen.
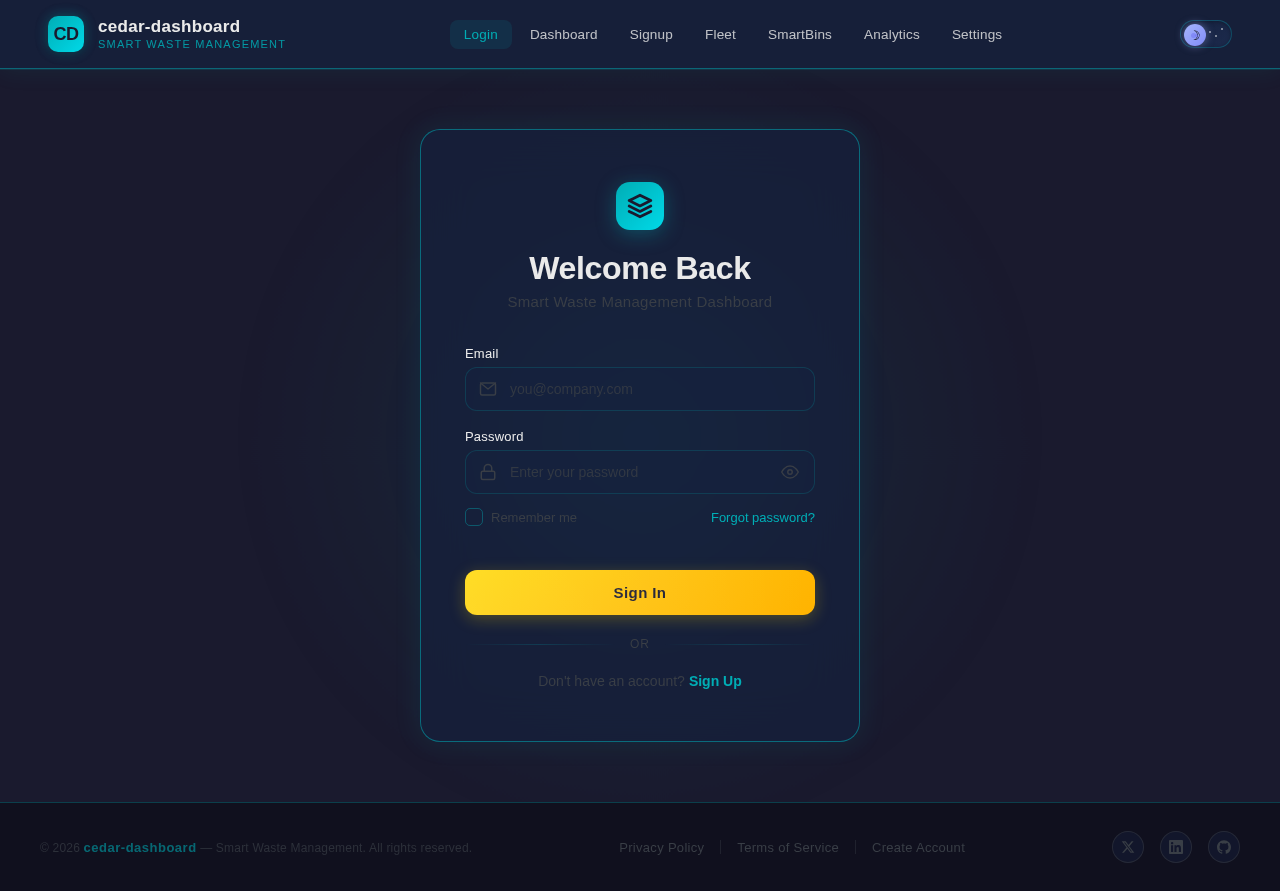
Welcome Back
Smart Waste Management Dashboard
No comments yet. Be the first!