autumn-carbon
 Prasana
create app using language python The problem statement “Carbon Footprint Monitoring in Smart Cities – Complete Analysis & Solution” basically means: 👉 Simple meaning It is about tracking, analyzing, and reducing the amount of carbon emissions (CO₂ and other greenhouse gases) produced in a smart city using technology. 🔍 Break it down 1. Carbon Footprint This refers to the total amount of harmful gases released into the environment due to: Vehicles 🚗 Industries 🏭 Electricity usage ⚡ Waste 🗑️ Example: If a city uses more fuel, electricity, and produces more waste → higher carbon footprint. 2. Monitoring This means: Collecting real-time data Measuring pollution levels Tracking sources of emissions Using: Sensors (IoT devices) Smart meters Satellite or AI data 3. Smart Cities A smart city uses technology like: IoT (Internet of Things) AI Data analytics to improve urban living (traffic, pollution, energy, etc.) 🎯 What the full problem is asking You need to design a system that can: ✅ 1. Measure emissions From traffic, industries, electricity usage ✅ 2. Analyze data Identify which area causes more pollution Detect peak pollution times ✅ 3. Provide solutions Suggest ways to reduce emissions Optimize traffic, energy usage Promote green alternatives ✅ 4. Visualize results Dashboard for government/public Real-time alerts 💡 Example (easy to understand) Imagine your app: Detects heavy traffic in an area 🚦 Calculates CO₂ emissions Suggests alternate routes Alerts government about high pollution 🚀 In one line: 👉 The problem is about building a smart system that tracks and reduces pollution in cities using technology. 🧠 1. System Architecture (End-to-End) 🔷 Layer 1: Data Collection (Input Layer) Sources of data: 🚗 Traffic sensors (vehicle count, speed) 🌫️ Air quality sensors (CO₂, PM2.5) ⚡ Smart meters (electricity usage) 🏭 Industrial emission APIs 📱 Mobile app (user travel data – optional) 👉 Tools: IoT devices (ESP32 – fits your project idea 🔥) GPS modules Public datasets (government APIs) 🔷 Layer 2: Communication Layer Transfers data to cloud MQTT / HTTP protocols WiFi / 4G / LoRa 👉 Tools: MQTT Broker (Mosquitto) REST APIs 🔷 Layer 3: Data Processing & Backend This is the brain 🧠 Store incoming data Clean & process Calculate carbon emissions 👉 Example logic: Vehicles × emission factor = CO₂ output 👉 Tools: Backend: Python (Flask / FastAPI) Database: MongoDB (real-time data) Firebase (easy for hackathon) 🔷 Layer 4: AI & Analytics Layer Predict pollution trends Identify hotspots Suggest optimizations 👉 Tools: Python (Pandas, NumPy) ML (Scikit-learn / TensorFlow) 🔷 Layer 5: Application Layer (Frontend) User interface (VERY important for judging) 📊 Dashboard for government 📱 Mobile app for citizens 👉 Shows: Real-time pollution map Carbon footprint per area Suggestions 👉 Tools: Flutter (you’re already using 🔥) Google Maps API (for visualization) 🔷 Layer 6: Action Layer (Smart Response) Traffic rerouting Alerts to users Energy-saving recommendations ✨ 2. Key Features (Make your project stand out) 🌍 Core Features Real-time carbon emission tracking Area-wise pollution heatmap Source identification (traffic, industry, energy) 🤖 Smart Features (HIGH IMPACT) AI-based pollution prediction Smart traffic suggestions Carbon footprint calculator (for individuals) 📱 User Features Personal carbon tracker Eco-friendly suggestions Notifications (high pollution alerts) 🏛️ Government/Admin Features Dashboard with analytics Identify high-emission zones Policy recommendation insights

Comments (0)
Sign in to leave a comment
System Requirements
System Requirements Document (SRD)
Project Name: autumn-carbon
1. Introduction
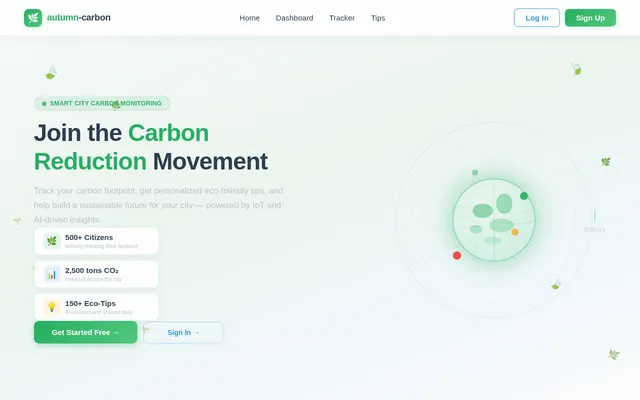
The autumn-carbon project aims to address the critical issue of carbon footprint monitoring and reduction in smart cities. By leveraging advanced technologies such as IoT, AI, and data analytics, this system will enable real-time tracking, analysis, and actionable solutions for reducing carbon emissions. The project is designed to cater to both city administrators and everyday citizens, fostering a collaborative approach to environmental sustainability.
This document outlines the system requirements for the autumn-carbon project, detailing its functional and non-functional requirements, user personas, design concepts, and technical architecture.
2. System Overview
The autumn-carbon system is a comprehensive platform designed to monitor, analyze, and reduce carbon emissions in smart cities. It integrates IoT devices, AI-driven analytics, and user-friendly interfaces to provide actionable insights and solutions.
Key Objectives:
- Real-Time Monitoring: Collect data on emissions from traffic, industries, electricity usage, and waste.
- Data Analysis: Identify pollution hotspots, predict trends, and suggest optimizations.
- User Engagement: Provide citizens with tools to track their personal carbon footprint and adopt eco-friendly practices.
- Government Insights: Equip city administrators with dashboards to monitor emissions and implement policies.
Target Users:
- City Administrators: For monitoring and decision-making.
- Everyday Citizens: For personal carbon tracking and eco-friendly suggestions.
3. Functional Requirements
Story Points:
- As a City Administrator, I should be able to monitor real-time carbon emissions across different areas of the city.
- As a City Administrator, I should be able to identify high-emission zones and their sources (traffic, industries, energy).
- As a City Administrator, I should receive AI-driven policy recommendations to reduce emissions.
- As a Citizen, I should be able to track my personal carbon footprint based on my activities.
- As a Citizen, I should receive eco-friendly suggestions to reduce my carbon footprint.
- As a Citizen, I should receive notifications about high pollution levels in my area.
- As a System, I should provide a real-time pollution heatmap for the city.
- As a System, I should predict future pollution trends using AI.
- As a System, I should suggest traffic rerouting to reduce congestion and emissions.
4. User Personas
1. City Administrator
Role: Government official responsible for urban planning and environmental policies.
Goals:
- Monitor and analyze city-wide emissions.
- Identify pollution hotspots and implement solutions.
- Use data-driven insights to create policies.
2. Citizen
Role: Everyday individual living in the smart city.
Goals:
- Track personal carbon footprint.
- Adopt eco-friendly practices.
- Stay informed about local pollution levels.
5. Visuals Colors and Theme
Unique Color Palette:
- Background: #F5F8FA (Soft Sky Blue)
- Surface: #FFFFFF (Pure White)
- Text: #2C3E50 (Deep Charcoal)
- Accent: #27AE60 (Eco Green)
- Muted Tones: #BDC3C7 (Light Gray)
This palette reflects a clean, eco-friendly, and modern aesthetic, aligning with the project's focus on sustainability and technology.
6. Signature Design Concept
Interactive Carbon Map with Dynamic Heat Zones
The homepage of the autumn-carbon platform will feature an interactive carbon map of the city. This map will display real-time pollution levels using dynamic heat zones that change color based on emission intensity (e.g., green for low emissions, red for high emissions).
Key Features:
- Hover Interactions: Users can hover over different areas to view detailed emission statistics (e.g., CO₂ levels, sources of pollution).
- Time-Lapse Animation: A slider allows users to view how pollution levels have changed over time, providing historical and predictive insights.
- AI-Driven Suggestions: Clicking on a hotspot will display actionable recommendations, such as traffic rerouting or energy-saving tips.
- Micro-Interactions: Subtle animations, such as pulsating hotspots and smooth transitions, enhance user engagement.
This design will create a vivid and memorable first impression, making the platform both functional and visually captivating.
7. Non-Functional Requirements
- Performance: The system must process real-time data with a latency of less than 2 seconds.
- Scalability: The platform should support up to 1 million users simultaneously.
- Security: All data must be encrypted during transmission and storage.
- Availability: The system should have 99.9% uptime.
- Localization: The platform should support Indian regional languages for broader accessibility.
8. Tech Stack
Frontend:
- React for Web
- React Native for Mobile App
Backend:
- Python
- FastAPI
Database:
- MongoDB for real-time data
- MySQL for structured data
AI Models:
- GPT 5.4 for user-friendly responses
- Claude 4.6 Opas for academic or coding work
- Google Nano Banana for image generation
AI Tools:
- Litellm for LLM Routing
- Langchain
Orchestration:
- Docker for local orchestration
- Kubernetes for server-side orchestration
9. Assumptions and Constraints
Assumptions:
- IoT devices and sensors will be deployed across the city for data collection.
- Citizens will have access to smartphones for using the mobile app.
- Government APIs will provide additional data on industrial emissions.
Constraints:
- Limited internet connectivity in some areas may affect real-time data collection.
- Budget constraints may limit the deployment of IoT devices.
10. Glossary
- Carbon Footprint: The total amount of greenhouse gases emitted by human activities.
- IoT (Internet of Things): A network of interconnected devices that collect and exchange data.
- AI (Artificial Intelligence): Technology that simulates human intelligence for data analysis and decision-making.
- PM2.5: Fine particulate matter that is harmful to health.
- MQTT: A lightweight messaging protocol for IoT devices.

Monitor & Reduce Your Carbon Footprint
Harness real-time insights, AI-driven analytics, and community-powered collective action to track emissions and build a sustainable city for everyone.
Real-Time Emission Monitoring
Explore dynamic heat zones across the city. Hover over hotspots to reveal CO₂ levels, pollution sources, and AI-powered recommendations for cleaner air.
Everything You Need to Reduce Emissions
From personal tracking to city-wide analytics, autumn-carbon gives citizens and administrators the tools to build a sustainable future.
Real-Time Monitoring
Track carbon emissions across your city as they happen with live data from IoT sensors and satellite feeds.
View Dashboard→Personal Tracker
Log your daily activities and see your individual carbon footprint with personalized breakdowns and goals.
Start Tracking→AI-Driven Insights
Machine learning models analyze emission patterns to predict trends and recommend targeted reduction strategies.
Explore Insights→Heatmap Visualization
Interactive city maps with dynamic heat zones reveal pollution hotspots color-coded by emission intensity.
See the Map→Eco-Friendly Tips
Receive tailored suggestions for greener commuting, energy use, and waste reduction based on your habits.
Get Tips→Community Dashboard
See how your neighborhood stacks up, join local challenges, and collaborate on city-wide sustainability goals.
Join Community→How autumn-carbon Works
From sensor deployment to actionable insights — four simple steps to a greener city.
Deploy Sensors
IoT sensors are installed across key city zones to capture real-time emission data from traffic, industry, and energy sources.
Collect Data
Continuous streams of environmental data are aggregated, validated, and stored securely in our cloud infrastructure.
AI Analysis
Machine learning models identify pollution hotspots, predict emission trends, and uncover hidden patterns in the data.
Actionable Insights
Personalized recommendations are delivered to citizens and administrators to drive measurable emission reductions.
Built for Everyone
Whether you are an everyday citizen or a city administrator, autumn-carbon empowers you with the right tools to drive meaningful change.
Citizen
Everyday Individual
Track your personal impact and make eco-friendly choices with real-time data and smart recommendations.
- Track Personal FootprintMonitor your daily carbon emissions based on activities and habits
- Eco-Friendly TipsReceive personalized suggestions to adopt greener practices
- Pollution AlertsGet real-time notifications about high pollution levels in your area
City Administrator
Government Official
Monitor city-wide emissions, identify pollution hotspots, and implement data-driven environmental policies.
- Monitor City EmissionsTrack real-time carbon emissions across all city zones and sectors
- Identify HotspotsPinpoint high-emission areas and analyze pollution sources
- Policy InsightsLeverage AI-driven recommendations to shape effective environmental policies
What Our Community Says
Join thousands of citizens and administrators who are making a real impact on urban sustainability.
“autumn-carbon completely changed how I think about my daily commute. I reduced my personal carbon footprint by 34% in just three months using the real-time tracking tools.”
“As a city planner, having access to the AI-driven heatmap has been invaluable. We identified three major emission hotspots and implemented targeted traffic rerouting that cut zone emissions by 22%.”
“The eco-friendly tips are surprisingly practical. The app suggested switching my energy provider and optimizing my home heating schedule. My household emissions dropped noticeably within weeks.”
Platform Features
Everything you need to monitor, analyze, and reduce carbon emissions in your smart city.
Live tracking of city-wide carbon emissions from traffic, industries, and energy sources with sub-2-second data refresh.
AI-driven analytics that predict pollution trends, identify hotspots, and generate policy recommendations automatically.
Track your individual carbon footprint based on daily activities like commute, energy usage, and lifestyle choices.
Collaborative dashboards, neighborhood comparisons, and community challenges to drive collective emission reduction.
Full-featured React Native mobile app for both citizens and administrators with push notifications and offline support.
RESTful API endpoints via FastAPI for third-party integrations, government portals, and custom data pipelines.
Ready to Make a Difference?
Join thousands of citizens and administrators building a sustainable city. Track emissions, discover insights, and take action with autumn-carbon.
Free to get started · No credit card required
Frequently Asked Questions
Everything you need to know about autumn-carbon. Can't find what you're looking for? Feel free to reach out to our team.
No comments yet. Be the first!