autumn-carbon
 Prasana
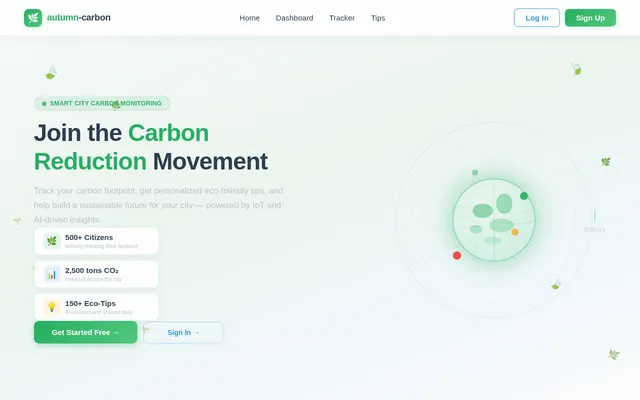
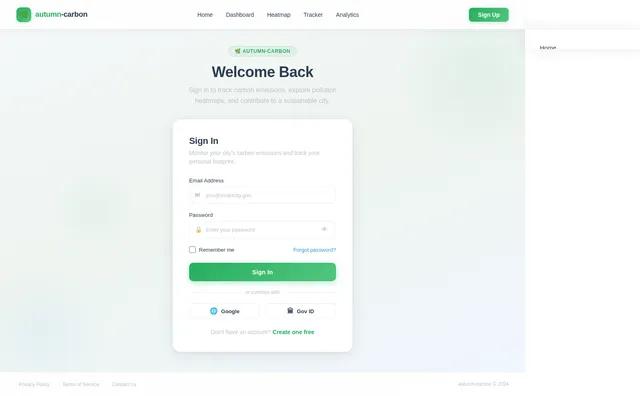
create app using language python The problem statement “Carbon Footprint Monitoring in Smart Cities – Complete Analysis & Solution” basically means: 👉 Simple meaning It is about tracking, analyzing, and reducing the amount of carbon emissions (CO₂ and other greenhouse gases) produced in a smart city using technology. 🔍 Break it down 1. Carbon Footprint This refers to the total amount of harmful gases released into the environment due to: Vehicles 🚗 Industries 🏭 Electricity usage ⚡ Waste 🗑️ Example: If a city uses more fuel, electricity, and produces more waste → higher carbon footprint. 2. Monitoring This means: Collecting real-time data Measuring pollution levels Tracking sources of emissions Using: Sensors (IoT devices) Smart meters Satellite or AI data 3. Smart Cities A smart city uses technology like: IoT (Internet of Things) AI Data analytics to improve urban living (traffic, pollution, energy, etc.) 🎯 What the full problem is asking You need to design a system that can: ✅ 1. Measure emissions From traffic, industries, electricity usage ✅ 2. Analyze data Identify which area causes more pollution Detect peak pollution times ✅ 3. Provide solutions Suggest ways to reduce emissions Optimize traffic, energy usage Promote green alternatives ✅ 4. Visualize results Dashboard for government/public Real-time alerts 💡 Example (easy to understand) Imagine your app: Detects heavy traffic in an area 🚦 Calculates CO₂ emissions Suggests alternate routes Alerts government about high pollution 🚀 In one line: 👉 The problem is about building a smart system that tracks and reduces pollution in cities using technology. 🧠 1. System Architecture (End-to-End) 🔷 Layer 1: Data Collection (Input Layer) Sources of data: 🚗 Traffic sensors (vehicle count, speed) 🌫️ Air quality sensors (CO₂, PM2.5) ⚡ Smart meters (electricity usage) 🏭 Industrial emission APIs 📱 Mobile app (user travel data – optional) 👉 Tools: IoT devices (ESP32 – fits your project idea 🔥) GPS modules Public datasets (government APIs) 🔷 Layer 2: Communication Layer Transfers data to cloud MQTT / HTTP protocols WiFi / 4G / LoRa 👉 Tools: MQTT Broker (Mosquitto) REST APIs 🔷 Layer 3: Data Processing & Backend This is the brain 🧠 Store incoming data Clean & process Calculate carbon emissions 👉 Example logic: Vehicles × emission factor = CO₂ output 👉 Tools: Backend: Python (Flask / FastAPI) Database: MongoDB (real-time data) Firebase (easy for hackathon) 🔷 Layer 4: AI & Analytics Layer Predict pollution trends Identify hotspots Suggest optimizations 👉 Tools: Python (Pandas, NumPy) ML (Scikit-learn / TensorFlow) 🔷 Layer 5: Application Layer (Frontend) User interface (VERY important for judging) 📊 Dashboard for government 📱 Mobile app for citizens 👉 Shows: Real-time pollution map Carbon footprint per area Suggestions 👉 Tools: Flutter (you’re already using 🔥) Google Maps API (for visualization) 🔷 Layer 6: Action Layer (Smart Response) Traffic rerouting Alerts to users Energy-saving recommendations ✨ 2. Key Features (Make your project stand out) 🌍 Core Features Real-time carbon emission tracking Area-wise pollution heatmap Source identification (traffic, industry, energy) 🤖 Smart Features (HIGH IMPACT) AI-based pollution prediction Smart traffic suggestions Carbon footprint calculator (for individuals) 📱 User Features Personal carbon tracker Eco-friendly suggestions Notifications (high pollution alerts) 🏛️ Government/Admin Features Dashboard with analytics Identify high-emission zones Policy recommendation insights

Comments (0)
Sign in to leave a comment
No comments yet. Be the first!