ai-charts-bot
 GAME Game
Ai charts bot website

Comments (0)
Sign in to leave a comment
System Requirements
System Requirements Document for ai-charts-bot
1. Introduction
ai-charts-bot is a website for an AI charts bot. It gives visitors a place to turn a plain-language request into a chart, and a place to look at charts the bot has produced.
The product intent is narrow and deliberate: a visitor arrives, describes what they want charted, the bot generates the chart, and the visitor can view it. There is no enterprise BI suite here, no account wall, no spreadsheet grid. The audience is analysts, founders, students, and data-curious visitors who want to type a prompt and watch a chart appear.
The experience is built around a single idea — data made flesh. The chart field is the page. The bot's own output is the background, the demo, and the gallery.
2. System Overview
ai-charts-bot is a first-party web application with three destinations:
- Landing — the anonymous public entry surface. It explains the AI charts bot and directs visitors toward creating or viewing charts.
- Create Chart — the workspace where a visitor submits a chart request and receives the generated chart.
- Charts — the destination where visitors open and view charts produced by the bot.
Two accepted human personas use the product: the Chart Creator, who describes what they want charted, reviews the generated chart, and adjusts it until the result is usable; and the Chart Viewer, who opens the site to look at charts the bot has produced rather than to create one.
The bot itself is a system actor. It receives a chart request, produces a chart, and returns it to the requesting surface. It is not a persona and has no page of its own.
2a. Product Interpretation and Delivery Boundary
Delivery. ai-charts-bot is delivered as a custom first-party web application. All three destinations are application-owned custom pages. There is no provider-owned surface, no external destination, and no headless-only delivery in the current scope.
Access. All three destinations are reachable without an account. The Landing page is the anonymous public entry. Create Chart and Charts are likewise reachable anonymously — a visitor can submit a chart request and view charts produced by the bot without establishing an identity. No sign-in, sign-up, invitation, or provisioning flow is part of the current product.
Current vs. future. Everything described in this document is current. No future-horizon requirements were accepted in the authoritative thread; the future section is therefore empty and no page, control, or state exists to serve it.
Exclusions. The product is a website for an AI charts bot and nothing more. It does not include account management, billing, team collaboration, permissions or role-based visibility, data-source connectors, scheduled or automated chart generation, or any adjacent BI capability. These are not prohibited by name in the source; they are simply not accepted requirements, and no page or control is created for them.
2c. Page Content and Component Coverage
Landing
- Information and state. The Landing page is the anonymous public entry to ai-charts-bot. It states what the bot does — you describe a chart in words, the bot produces it — and routes visitors to the two things they can do: create a chart or view charts. It carries no visitor-specific state and requires no identity.
- Primary actions. Enter the Create Chart workspace to submit a chart request. Enter the Charts destination to view charts produced by the bot.
- Supporting actions. Read the explanation of what the bot does. Read the example chart gallery to understand the range of output before committing to a request.
- Domain entities. Chart request (described, not yet submitted), generated chart (as shown in examples), bot model state.
- Component responsibilities.
- Generative chart field — the full-bleed near-black canvas that spans the viewport, its density and hue driven by a real sample dataset, drifting slowly. It is the page's dominant element and doubles as a live preview of the product's own output.
- Headline block — the product statement, set flush-left and overlapping the field, with the second line indented so type and data interleave.
- Prompt bar — a 1px-stroked input with an acid chartreuse blinking cursor and the placeholder
Revenue by region, last 6 quarters…. It is the entry affordance into Create Chart; submitting from here hands the visitor to the Create Chart workspace with their request. - Live readout panel — a floating thin-bordered panel showing live model stats (tokens, latency, series count) in tabular numerals.
- Example chart gallery — a horizontal filmstrip of chart plates, each captioned like an artwork label with its prompt, model version, and date.
- Left rail — a fixed 64px rail holding the wordmark, the page index, and a live model-state dot.
- Primary call to action — the route into Create Chart for visitors who have not typed a prompt.
- States.
- Loading — the generative field initialises; the readout panel shows placeholder values until the first sample frame resolves.
- Empty — not applicable; the Landing page always has content to show.
- Success — the field is drifting, the readout panel shows live model stats, the gallery filmstrip is populated, and both routes into the product are available.
- Error — if the generative field fails to initialise, the page falls back to a static near-black ground with the headline, prompt bar, and both routes intact; the model-state dot reads ember orange. The visitor can still proceed to Create Chart or Charts.
- Recovery — the field retries on the next visit or reload; no visitor action is required and no state is lost.
Create Chart
- Information and state. The Create Chart workspace is where a visitor turns a description into a chart. It holds the visitor's in-progress request — the prompt text and any data they supply — and the chart the bot returns. It is reachable anonymously and requires no identity.
- Primary actions. Submit a chart request to the bot. Review the generated chart.
- Supporting actions. Supply or paste the data the chart should be built from. Adjust the request and resubmit. Open the generated chart in the Charts destination.
- Domain entities. Chart request (prompt text, supplied data, parameters), generated chart (rendered output), bot model state (idle, generating, error).
- Component responsibilities.
- Prompt and data input pane — the left pane. Holds the prompt field where the visitor describes the chart they want, the data input where they supply the underlying values, and the request parameters.
- Live chart pane — the right pane. Renders the chart on the dark field as it resolves, with a floating readout panel over it.
- Floating readout panel — thin-bordered, 72% opaque, showing the current chart's readouts in tabular numerals.
- Submit control — commits the request to the bot.
- Model-state indicator — the left rail's dot, pulsing acid chartreuse while the bot is generating and ember orange on error.
- Left rail — the same fixed 64px rail as on Landing, carrying the wordmark, page index, and model-state dot.
- States.
- Loading — the bot is generating. The field inhales toward the input, the model-state dot pulses acid chartreuse, and the chart pane shows the resolving field rather than a finished chart.
- Empty — no request has been submitted yet. The prompt field is empty with its placeholder, the data input is empty, and the chart pane shows the drifting generative field with no chart geometry.
- Success — the bot has returned a chart. The chart resolves out of noise into hard geometry in the chart pane, the readout panel shows the chart's values, and the model-state dot returns to idle.
- Error — the bot could not produce a chart from the request. The model-state dot reads ember orange, the chart pane retains the last state, and the visitor's prompt and data remain in the input pane so nothing is lost.
- Recovery — the visitor edits the prompt or data and resubmits. The previous request is not discarded by the failure; the input pane still holds it.
Charts
- Information and state. The Charts destination is where visitors view charts produced by the bot. It presents charts as a sparse grid of plates on near-black, each captioned like an artwork label. It is reachable anonymously and requires no identity.
- Primary actions. Open a chart to view it.
- Supporting actions. Read a chart's caption — its prompt, model version, and date — to understand what produced it. Browse the grid.
- Domain entities. Generated chart (as a plate), chart caption (prompt, model version, date).
- Component responsibilities.
- Chart plate grid — the museum wall. A sparse grid of chart plates with generous gutters, each plate rendering a chart produced by the bot.
- Caption label — the artwork-style label beneath each plate, carrying the chart's prompt, model version, and date in uppercase 11px tracked type with tabular figures.
- Chart detail view — the enlarged view of a single chart opened from the grid, with its caption.
- Left rail — the same fixed 64px rail, carrying the wordmark, page index, and model-state dot.
- States.
- Loading — the grid resolves; plates fade in as their charts become available.
- Empty — no charts have been produced yet. The grid area shows the near-black ground with a short statement that no charts exist yet and a route into Create Chart, so the visitor is not stranded.
- Success — the grid is populated with chart plates and captions; opening a plate shows the chart at full size with its caption.
- Error — a chart fails to load. Its plate shows a thin-bordered placeholder with the caption intact and an ember-orange marker; the rest of the grid remains usable.
- Recovery — the failed plate retries on reload or on reopening; the visitor can continue browsing the remaining charts without leaving the page.
3. Functional Requirements
FR-1 — Website for an AI charts bot (explicit) As a visitor, I should be able to reach a website for an AI charts bot so that I have a place to create and view charts produced by the bot.
- Trigger: the visitor navigates to the site.
- Observable result: the Landing page loads and states what the bot does.
- Access: anonymous; no identity required.
- Failure/recovery: if the page fails to load, the visitor can reload; no state is lost.
- Continuation: the visitor proceeds to create a chart or view charts.
FR-2 — Create charts with the AI charts bot (explicit) As a Chart Creator, I should be able to create a chart with the AI charts bot so that I get a chart from what I described.
- Trigger: the visitor submits a chart request from the Create Chart workspace.
- Input: the prompt describing the chart, and any data the chart should be built from.
- Observable result: the bot returns a chart, which resolves into hard geometry in the chart pane; the model-state dot pulses acid chartreuse while generating and returns to idle on completion.
- Access: anonymous; no identity required.
- Failure/recovery: if the bot cannot produce a chart, the model-state dot reads ember orange and the visitor's prompt and data remain in the input pane so they can adjust and resubmit.
- Continuation: the visitor reviews the chart, adjusts the request, or opens the chart in the Charts destination.
FR-3 — View charts produced by the bot (explicit) As a Chart Viewer, I should be able to view charts produced by the bot so that I can see the chart content I came for.
- Trigger: the visitor opens the Charts destination.
- Observable result: the grid of chart plates loads, each captioned with its prompt, model version, and date; opening a plate shows the chart at full size.
- Access: anonymous; no identity required.
- Failure/recovery: if a chart fails to load, its plate shows a placeholder with the caption intact and an ember-orange marker, and the rest of the grid stays usable.
- Continuation: the visitor browses other charts or moves to Create Chart.
FR-4 — Anonymous entry and routing from Landing (required_inference) As a visitor, I should be able to understand what the bot does and reach either creating or viewing from the Landing page so that I can start the thing I came to do.
- Trigger: the visitor lands on the Landing page.
- Observable result: the page states what the bot does and offers a route into Create Chart and a route into Charts.
- Access: anonymous; no identity required.
- Failure/recovery: if the generative field fails to initialise, the page falls back to a static near-black ground with the headline, prompt bar, and both routes intact.
- Continuation: the visitor enters Create Chart or Charts.
FR-5 — Submit a chart request from the Landing prompt bar (required_inference) As a Chart Creator, I should be able to type my chart request into the prompt bar on the Landing page so that I can start creating without first navigating.
- Trigger: the visitor types into the prompt bar and submits.
- Observable result: the visitor is handed to the Create Chart workspace with their request carried over.
- Access: anonymous; no identity required.
- Failure/recovery: if the handoff fails, the visitor can navigate to Create Chart directly and retype the request.
- Continuation: the request is submitted to the bot from Create Chart.
FR-6 — Supply data for the chart (required_inference) As a Chart Creator, I should be able to supply the data my chart should be built from so that the bot charts my numbers rather than guessing them.
- Trigger: the visitor enters or pastes data into the data input in the Create Chart workspace.
- Observable result: the supplied data is held with the request and used when the request is submitted.
- Access: anonymous; no identity required.
- Failure/recovery: if the supplied data cannot be used, the request fails with the model-state dot ember orange and the data remains in the input pane.
- Continuation: the visitor corrects the data and resubmits.
FR-7 — Review the generated chart and adjust (required_inference) As a Chart Creator, I should be able to review the chart the bot returns and adjust my request so that I end up with a chart that is usable.
- Trigger: the bot returns a chart.
- Observable result: the chart renders in the chart pane with its readouts in the floating panel; the visitor can edit the prompt or data and resubmit.
- Access: anonymous; no identity required.
- Failure/recovery: if the returned chart is not what the visitor wanted, they edit and resubmit without losing the previous request.
- Continuation: the visitor keeps the chart or opens it in the Charts destination.
FR-8 — Open a chart from the gallery (required_inference) As a Chart Viewer, I should be able to open a chart from the grid so that I can see it at full size.
- Trigger: the visitor selects a chart plate in the Charts destination.
- Observable result: the chart opens at full size with its caption — prompt, model version, and date.
- Access: anonymous; no identity required.
- Failure/recovery: if the chart fails to load, the plate shows a placeholder with the caption intact and an ember-orange marker.
- Continuation: the visitor returns to the grid and opens another chart.
FR-9 — Read a chart's caption (required_inference) As a Chart Viewer, I should be able to read what produced a chart so that I understand the chart I am looking at.
- Trigger: the visitor reads a plate's caption or opens a chart.
- Observable result: the chart's prompt, model version, and date are shown in uppercase 11px tracked type with tabular figures.
- Access: anonymous; no identity required.
- Failure/recovery: if caption metadata is unavailable, the caption shows the fields it has rather than failing the plate.
- Continuation: the visitor continues browsing.
FR-10 — Live model state (required_inference) As a visitor, I should be able to see whether the bot is idle, generating, or in error so that I know what the product is doing.
- Trigger: the bot's state changes.
- Observable result: the left rail's model-state dot pulses acid chartreuse while generating and reads ember orange on error; it returns to idle on completion.
- Access: anonymous; no identity required.
- Failure/recovery: if the state indicator cannot update, the chart pane's own loading and error states still communicate the outcome.
- Continuation: the visitor waits, retries, or continues.
4. User Personas
Chart Creator
Product context. The Chart Creator arrives at ai-charts-bot with something in mind that they want to see as a chart — a set of numbers, a comparison, a trend. They are not looking for a BI tool; they are looking for the shortest path from a sentence to a legible visual. They may arrive from the Landing page's prompt bar or navigate straight into the Create Chart workspace.
Primary goal. To end up with a chart they can view and keep, produced from what they described.
Distinct accepted responsibilities. The Chart Creator is the only persona who submits a chart request to the bot. They describe what they want charted, supply the data the chart should be built from, submit the request, and review what comes back. They are also the only persona who adjusts and resubmits — the loop of refining a request until the output is usable belongs to them alone.
Relevant inputs and decisions. They decide what to ask for and what data to supply. They decide whether the returned chart is usable or needs another pass. They decide whether to keep the chart or move on.
Interactions with other accepted participants. The Chart Creator interacts with the bot, which receives their request and returns a chart. They do not interact with the Chart Viewer; the two personas use the product independently. A chart the Chart Creator produces becomes available in the Charts destination, where the Chart Viewer may later open it.
Observable success. A chart renders in the chart pane from their request, with its readouts visible, and they can open it in the Charts destination.
Chart Viewer
Product context. The Chart Viewer opens ai-charts-bot to look at charts the bot has produced, not to make one. They come to the Charts destination and treat it as a wall to browse — reading captions, opening plates, moving on.
Primary goal. To see the chart content they came for.
Distinct accepted responsibilities. The Chart Viewer is the only persona who browses and opens existing charts. They read the grid, open a plate to see a chart at full size, and read its caption to understand what produced it. They never submit a request to the bot.
Relevant inputs and decisions. They decide which chart to open and how long to look. They read the caption — prompt, model version, date — to interpret what they are seeing.
Interactions with other accepted participants. The Chart Viewer interacts with the bot only indirectly, by viewing charts it has already produced. They do not interact with the Chart Creator. If the grid is empty, their route out is into Create Chart, which is the Chart Creator's workspace.
Observable success. A chart opens at full size with its caption legible, and they can return to the grid and open another.
5. Core User Flows
Flow A — Chart Creator: create a chart from the Landing page
- The visitor arrives at the Landing page. The generative chart field is drifting across the viewport, the headline sits flush-left over it, and the live readout panel shows model stats in tabular numerals.
- The visitor reads the headline and the explanation of what the bot does, and understands that they describe a chart and the bot produces it.
- The visitor types their request into the prompt bar — for example,
Revenue by region, last 6 quarters…— and submits. - The visitor is handed to the Create Chart workspace with their request carried into the prompt field. The left pane holds the prompt and the data input; the right pane holds the chart field.
- The visitor supplies the data the chart should be built from in the data input, and sets the request parameters.
- The visitor submits the request. The field inhales toward the input, the model-state dot in the left rail pulses acid chartreuse, and the chart pane shows the resolving field rather than a finished chart.
- Over roughly 900ms the field explodes outward and the chart resolves out of noise into hard geometry in the chart pane. The floating readout panel shows the chart's values. The model-state dot returns to idle.
- The visitor reviews the chart. If it is not what they wanted, they edit the prompt or the data and resubmit from step 6 — the previous request is still in the input pane, so nothing is retyped from scratch.
- If the bot cannot produce a chart, the model-state dot reads ember orange and the chart pane retains its last state. The visitor's prompt and data remain in the input pane. They adjust and resubmit.
- Once the chart is usable, the visitor opens it in the Charts destination, where it appears as a plate with its caption.
Flow B — Chart Creator: create a chart directly in the workspace
- The visitor navigates to the Create Chart workspace without going through the Landing prompt bar.
- The prompt field is empty with its placeholder, the data input is empty, and the chart pane shows the drifting generative field with no chart geometry.
- The visitor types their request into the prompt field and supplies the data.
- The visitor submits. The model-state dot pulses acid chartreuse and the chart pane shows the resolving field.
- The chart resolves into hard geometry; the readout panel shows its values; the model-state dot returns to idle.
- The visitor reviews, adjusts if needed, and resubmits as in Flow A steps 8–9.
- The visitor opens the finished chart in the Charts destination.
Flow C — Chart Viewer: view charts produced by the bot
- The visitor arrives at the Landing page and takes the route into Charts.
- The Charts destination loads as a sparse grid of chart plates on near-black, with generous gutters. Each plate carries an artwork-style caption: the prompt that produced it, the model version, and the date.
- The visitor browses the grid, reading captions to decide what to open.
- The visitor selects a plate. The chart opens at full size with its caption.
- The visitor reads the chart. If a plate fails to load, it shows a thin-bordered placeholder with its caption intact and an ember-orange marker; the rest of the grid stays usable and the visitor continues browsing.
- The visitor returns to the grid and opens another chart, or moves to Create Chart to make one of their own.
Flow D — Chart Viewer: arriving to an empty wall
- The visitor opens the Charts destination.
- No charts have been produced yet. The grid area shows the near-black ground with a short statement that no charts exist yet.
- The page offers a route into Create Chart so the visitor is not stranded.
- The visitor either takes that route and becomes a Chart Creator for this session, or leaves.
6. Visuals, Colors and Theme
The visual direction is Data made flesh: generative light as the charting engine after Refik Anadol. The muse is Refik Anadol, whose language is data rendered as a living, luminous surface — which is exactly what an AI charts bot does. The emotional register is discovery and quiet awe: the moment raw numbers turn into something legible and beautiful. Not enterprise BI greyness, not playful SaaS, not a dashboard template.
Mode. Dark mode only. There is no light mode.
Palette.
| Role | Hex | Use |
|---|---|---|
| Background | #07080C | Near-black ink. Carries ~75% of every screen. |
| Surface | #111319 | Panels, floating readouts. |
| Hairline | #262A33 | 1px strokes on panels and plates. |
| Text | #F2F1EC | Warm off-white, never pure white, so luminous chart fields read brighter than the page. |
| Primary | #E8FF4D | Acid chartreuse. The data/action colour: prompt cursor, active series, primary CTA, focus rings. Under 8% of pixels. |
| Accent | #FF5C2E | Ember orange. The single hot signal for the generating state, errors, and the second data series. |
| Muted | #8A8D96 | Metadata, axis labels, timestamps. |
Charts draw from a 6-stop luminous ramp derived from primary → accent → #7CE7FF cyan → #B79BFF violet, always on dark grounds so contrast stays above 4.5:1 at body size.
Typography. Headings and body both use Instrument Sans. Headings at 600–700 with tight -0.03em tracking, sentence case for headlines — never all-caps at large sizes. Optical sizing is pushed big: hero headline 96–140px, section heads 48–64px. Uppercase micro-labels in 11px / 0.18em tracking are reserved for axis, HUD, and metadata only. Numerals are always tabular. Data readouts pair Instrument Sans with tabular figures and 0.02em tracking at 13/11px.
Type scale. 1.333 modular on a 4px baseline: 140 / 104 / 78 / 58 / 44 / 32 / 24 / 18 / 16 / 13 / 11.
Shape language. Full-bleed rectangular canvas with hard edges — no rounded cards. Overlay panels are thin-bordered rectangles (0–2px radius, 1px #262A33 stroke, 72% opaque #111319) that float over the generative field like HUD readouts. Section boundaries are soft vertical light-washes rather than lines. Data marks are crisp: 1.5px strokes, square caps, no drop shadows.
Layout. The chart field is the page. A fixed left rail (64px) holds the wordmark, page index, and a live model-state dot. Content sits in an asymmetric 12-column grid with the generative canvas bleeding behind columns 3–12. Landing scrolls as a sequence of full-viewport scenes: headline over field → prompt console → example chart gallery as a horizontal filmstrip → CTA. Create Chart is a two-pane workspace: left 5 columns = prompt + data input + parameters, right 7 columns = live chart on the dark field with a floating readout panel. Charts is a museum wall: a sparse grid of chart plates on near-black with generous gutters, each captioned like an artwork label.
**Im
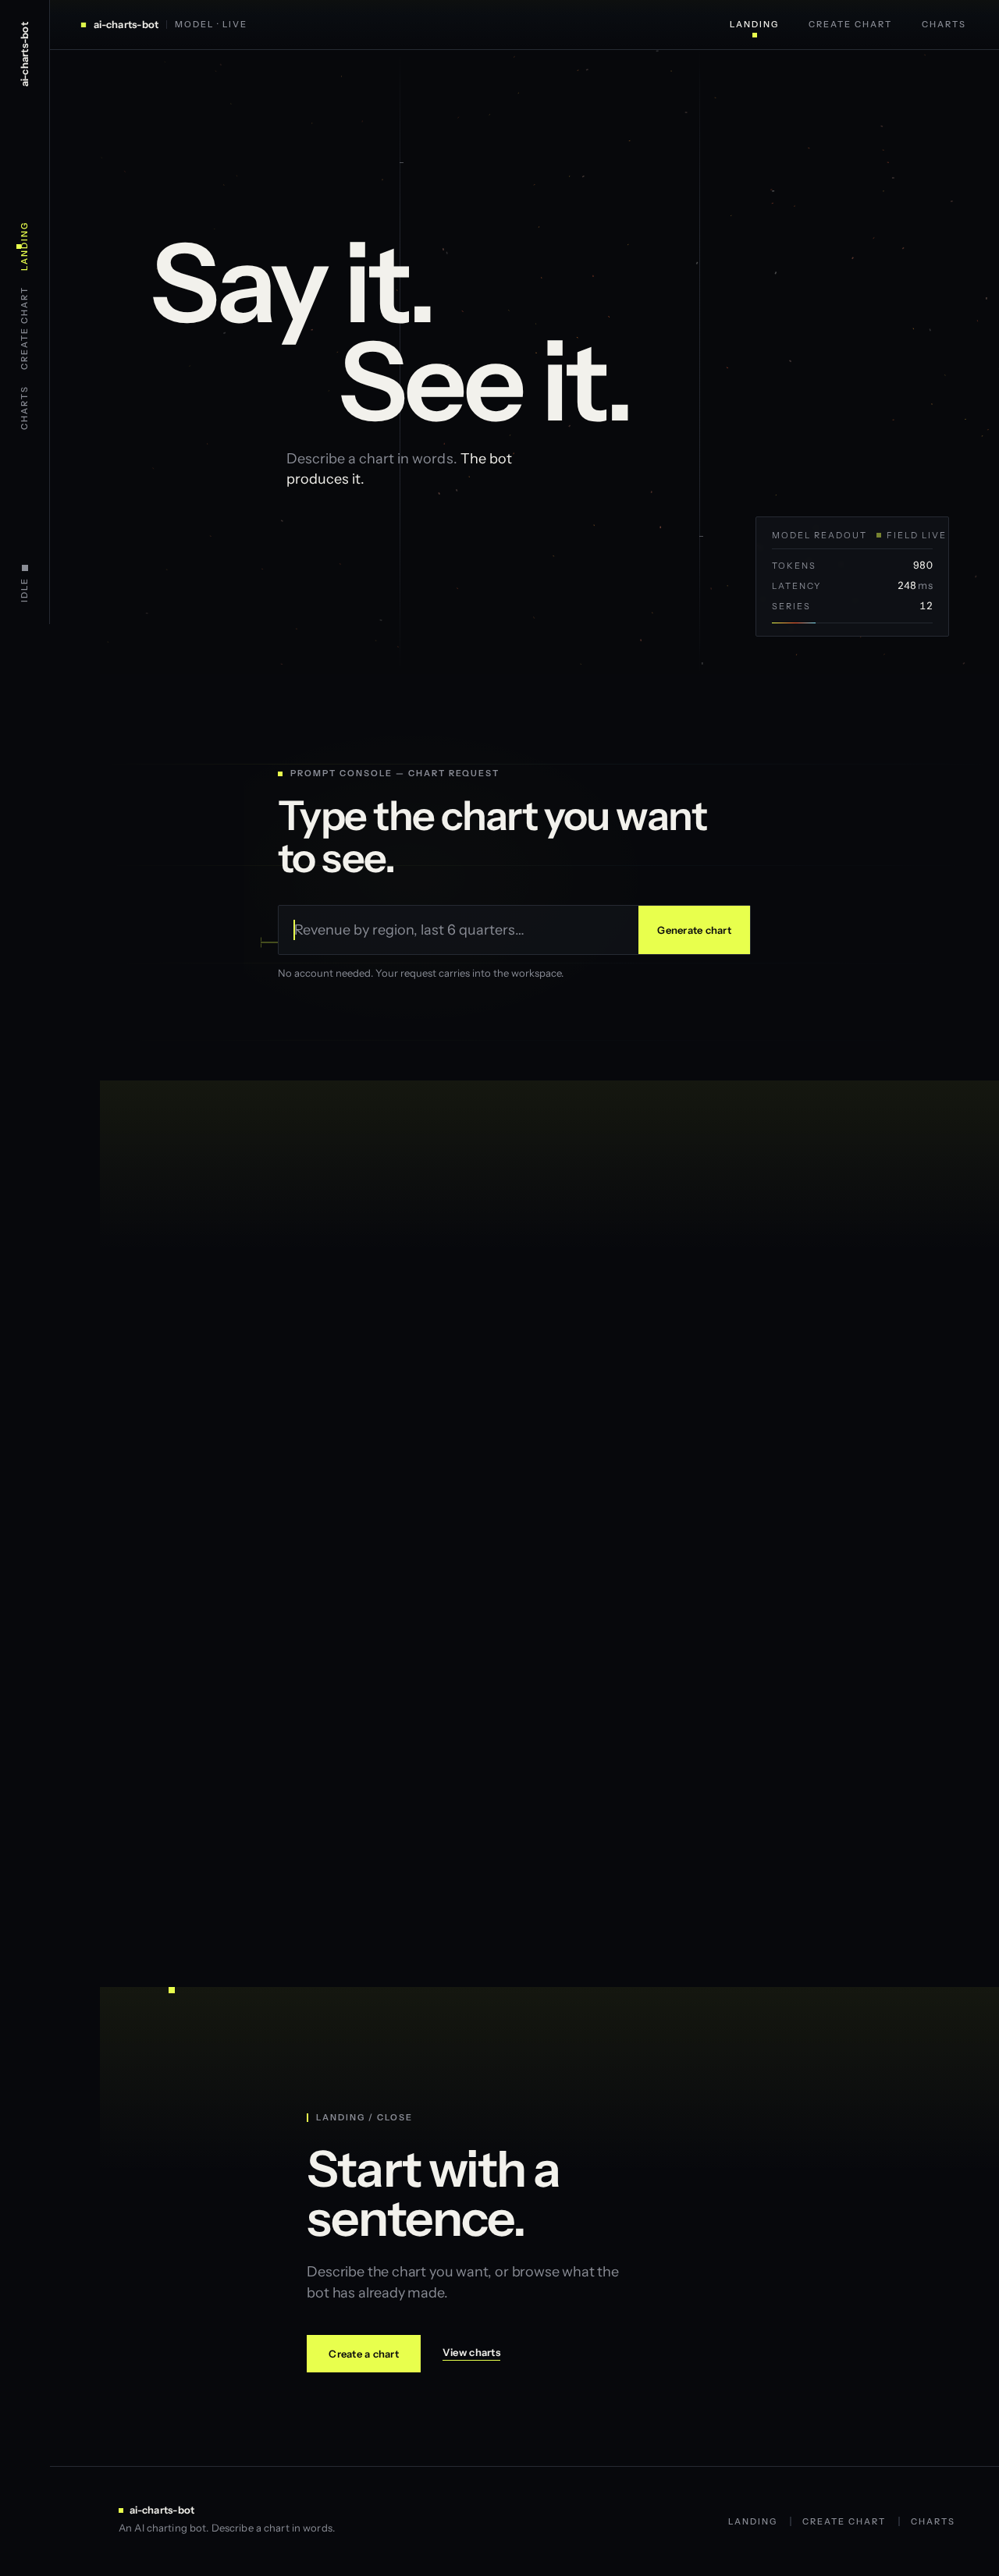
Prompt console — chart request
Type the chart you want to see.
No account needed. Your request carries into the workspace.
What the bot makes
Every plate below was produced from a single typed prompt — no spreadsheet, no chart editor. Each caption records the prompt, the model version and the date the chart was rendered.
Revenue by region, last 6 quarters
Weekly cohort retention, 12 weeks
p95 latency by service, trailing 30 days
Generation mix by source, 2025
Landing / Close
Start with a sentence.
Describe the chart you want, or browse what the bot has already made.
Prompt console — chart request
Type the chart you want to see.
No account needed. Your request carries into the workspace.
What the bot makes
Every plate below was produced from a single typed prompt — no spreadsheet, no chart editor. Each caption records the prompt, the model version and the date the chart was rendered.
Revenue by region, last 6 quarters
Weekly cohort retention, 12 weeks
p95 latency by service, trailing 30 days
Generation mix by source, 2025
Landing / Close
Start with a sentence.
Describe the chart you want, or browse what the bot has already made.
No comments yet. Be the first!