New-project
 GodFather
Build a modern AI operations dashboard for a company managing multiple LLM-powered applications. The dashboard should show total API usage, token consumption, estimated cost in inr, model performance, error matrix , and active users. Include filters by model and date range, a recent activity feed, usage charts, a model comparison table, and alerts for unusual spending or failed requests. Add a sidebar with Overview, Models, Usage, Logs, Projects, Billing, and Settings. The design should feel like a polished enterprise SaaS product, with a clean dark theme, responsive layout, clear data hierarchy, and subtle animations.


Comments (0)
Sign in to leave a comment
System Requirements
New-project System Requirements Document
Introduction
The New-project aims to develop a modern AI operations dashboard for a company managing multiple LLM-powered applications. This dashboard will provide comprehensive analytics and insights into API usage, token consumption, model performance, and more, all within a polished dark theme design.
System Overview
The New-project dashboard will serve as a centralized platform for monitoring and managing various aspects of LLM-powered applications. It will offer detailed analytics, model comparisons, and alerts to ensure efficient operations and cost management.
Functional Requirements as Story Points
- As a User, I should be able to view total API usage to monitor application performance.
- As a User, I should be able to track token consumption to manage resource allocation.
- As a User, I should be able to see estimated costs in INR to keep track of expenses.
- As a User, I should be able to evaluate model performance through detailed metrics.
- As a User, I should be able to view an error matrix to identify and address issues.
- As a User, I should be able to see the number of active users to gauge application engagement.
- As a User, I should be able to filter data by model and date range for targeted analysis.
- As a User, I should be able to view a recent activity feed to stay updated on application events.
- As a User, I should be able to access usage charts for visual insights into data trends.
- As a User, I should be able to compare models using a model comparison table for informed decision-making.
- As a User, I should be able to receive alerts for unusual spending or failed requests to take timely action.
- As a User, I should be able to navigate through a sidebar with sections for Overview, Models, Usage, Logs, Projects, Billing, and Settings for efficient access to different functionalities.
User Personas
- Admin: Responsible for overseeing the entire dashboard, managing settings, and ensuring smooth operations.
- Data Analyst: Focuses on analyzing data trends, model performance, and generating reports.
- Developer: Uses the dashboard to monitor API usage, troubleshoot errors, and optimize application performance.
Core User Flows
- Admin logs in -> navigates to Overview -> checks API usage and token consumption -> sets alerts for unusual spending.
- Data Analyst logs in -> filters data by model and date range -> views usage charts and model comparison table -> generates a performance report.
- Developer logs in -> accesses Logs section -> reviews error matrix -> identifies and resolves issues -> updates project settings.
Visuals Colors and Theme
- primary: #1E1E2F (dark slate)
- primary_light: #2E2E3F (slate gray)
- secondary: #FF6F61 (coral)
- accent: #FFD700 (gold)
- highlight: #FFA500 (orange)
- bg: #121212 (black)
- surface: rgba(30, 30, 47, 0.8)
- text: #FFFFFF (white)
- text_muted: #B0B0B0 (light gray)
- border: rgba(255, 255, 255, 0.2)
Signature Design Concept
The New-project dashboard will feature an interactive galaxy map as its landing page. Each star in the galaxy represents a different feature or section of the dashboard. Users can click on a star to open a task card, drag to rotate the cluster, and hover to highlight connections between features. This dynamic and engaging interface will be built using @react-three/fiber and @react-three/drei, providing a unique and memorable user experience.
Landing Hero Motion Brief
The landing page will showcase a continuous 2D motion loop using motion/react. The animation will depict data inputs gathering around a central dashboard interface, which transforms to reveal key analytics and insights. This transformation will highlight the dashboard's ability to process and present complex data in a user-friendly manner. The animation will be responsive, ensuring a seamless experience across devices.
Interaction Model & Motion Direction
- Intended Interaction Model: Animated
- The landing page will feature moderate scroll-triggered reveals, hover transitions, and spring physics on interactive elements, providing a polished and engaging experience.
Non-Functional Requirements
- The dashboard must be responsive and accessible across various devices and screen sizes.
- It should maintain high performance and quick load times, even with large data sets.
- Ensure data security and privacy, especially concerning sensitive user information.
Tech Stack
- Frontend: React for Web
- Backend: Python, FastAPI
- Database: MySQL or MariaDB, using Alembic for migrations
- AI Models: GPT 5.4 for user-friendly responses
- AI Tools: Litellm for LLM Routing, Langchain
- Local Orchestration: Docker, docker-compose
- Server-side Orchestration: Kubernetes
Assumptions and Constraints
- The dashboard will primarily serve enterprise users, requiring a professional and polished design.
- The system should support integration with existing LLM-powered applications.
- Budget constraints may limit the use of certain premium technologies or services.
Glossary
- API: Application Programming Interface
- LLM: Large Language Model
- INR: Indian Rupee
- SaaS: Software as a Service
This document outlines the comprehensive requirements for the New-project, ensuring a robust and user-friendly AI operations dashboard.
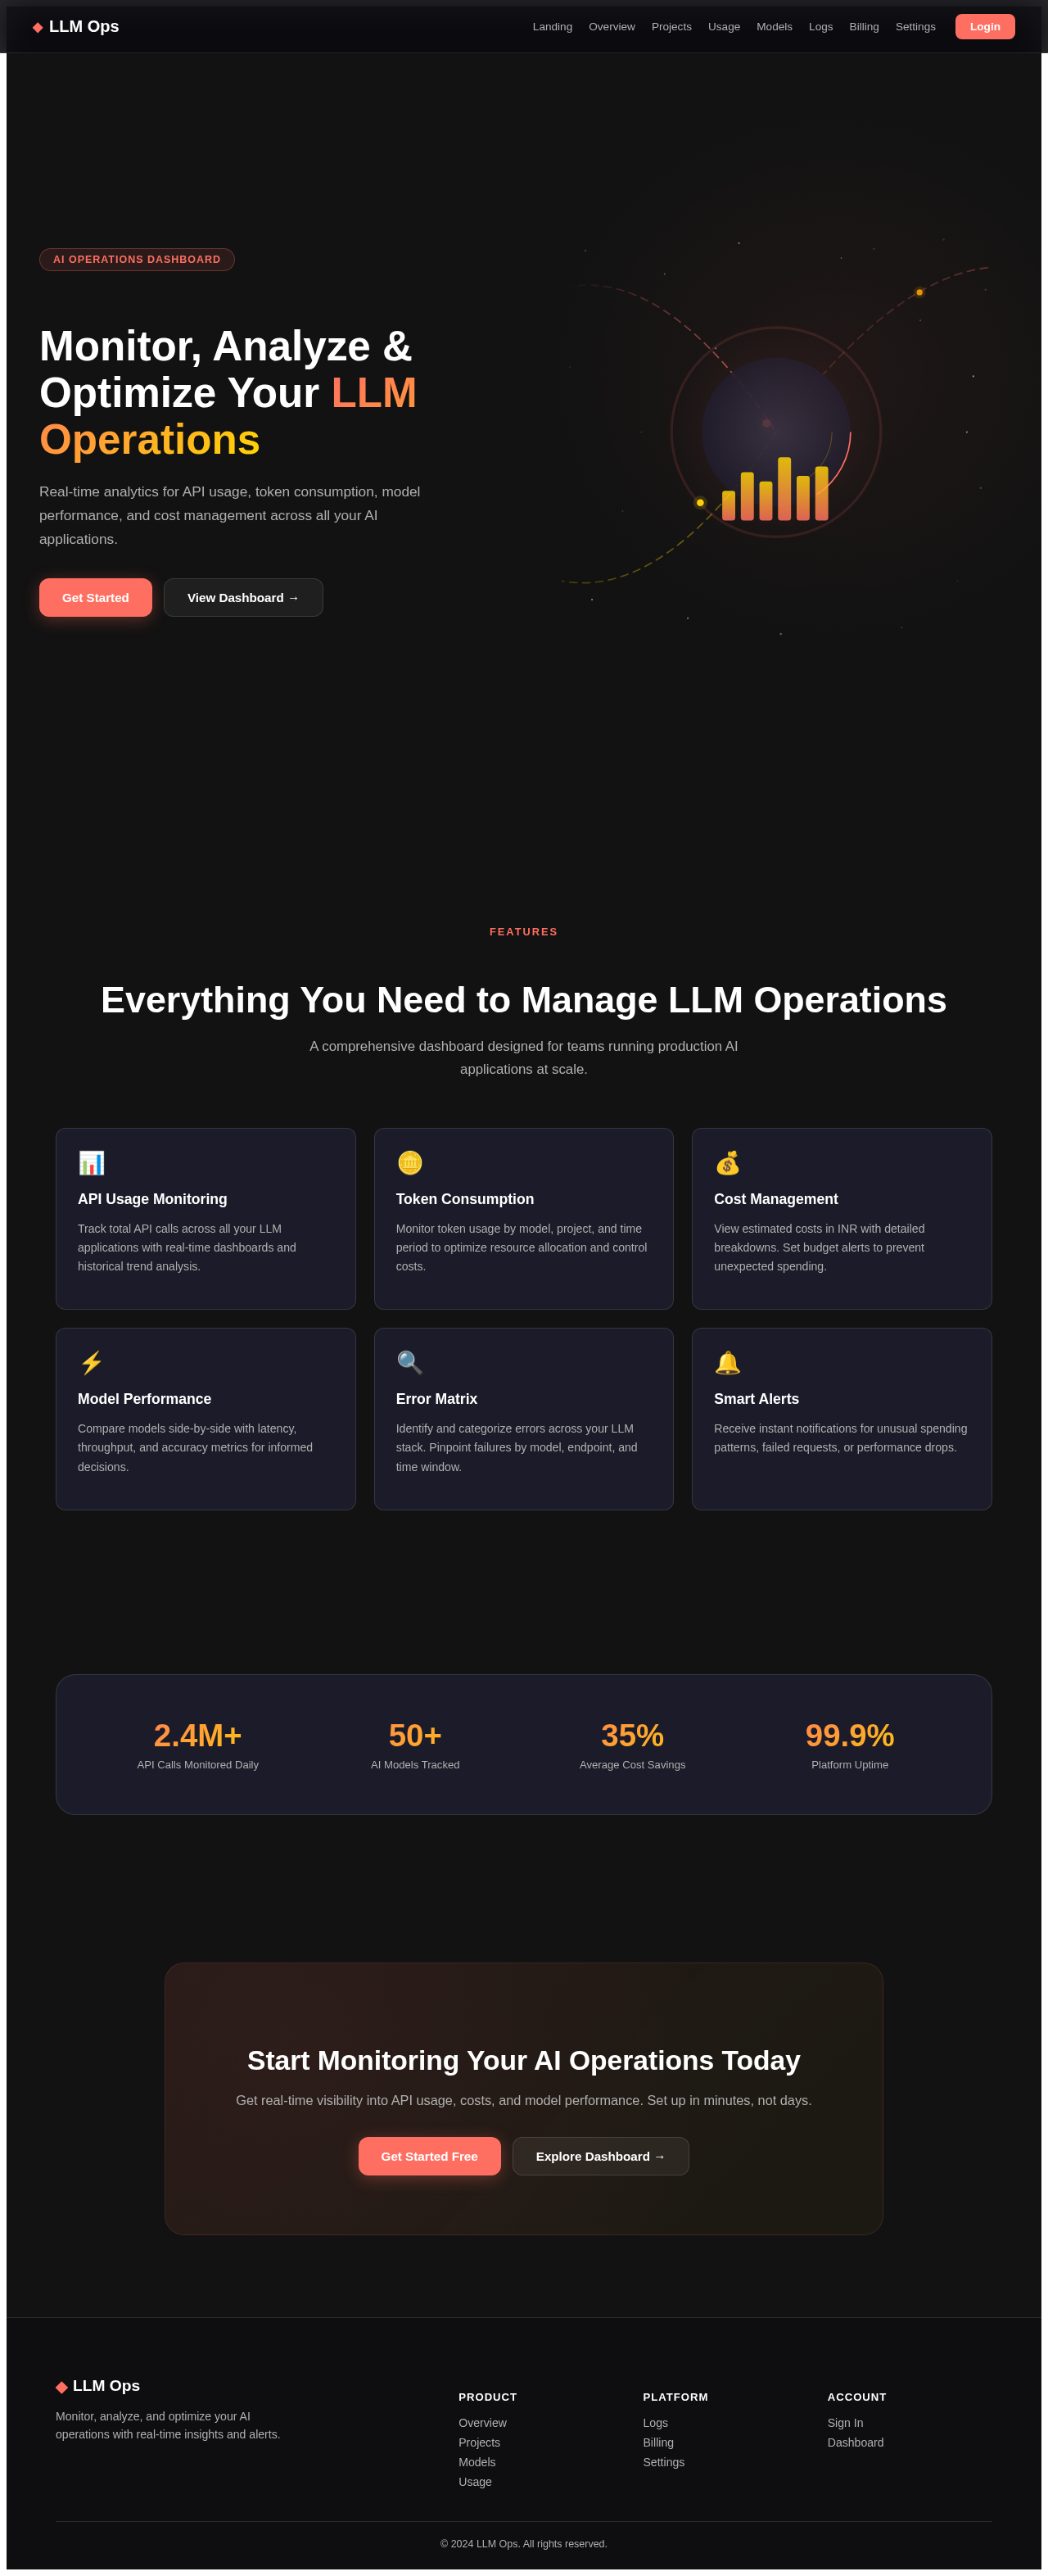
Monitor, Analyze & Optimize Your LLM Operations
Real-time analytics for API usage, token consumption, model performance, and cost management across all your AI applications.
Everything You Need to Manage LLM Operations
A comprehensive dashboard designed for teams running production AI applications at scale.
API Usage Monitoring
Track total API calls across all your LLM applications with real-time dashboards and historical trend analysis.
Token Consumption
Monitor token usage by model, project, and time period to optimize resource allocation and control costs.
Cost Management
View estimated costs in INR with detailed breakdowns. Set budget alerts to prevent unexpected spending.
Model Performance
Compare models side-by-side with latency, throughput, and accuracy metrics for informed decisions.
Error Matrix
Identify and categorize errors across your LLM stack. Pinpoint failures by model, endpoint, and time window.
Smart Alerts
Receive instant notifications for unusual spending patterns, failed requests, or performance drops.
Start Monitoring Your AI Operations Today
Get real-time visibility into API usage, costs, and model performance. Set up in minutes, not days.
Monitor, Analyze & Optimize Your LLM Operations
Real-time analytics for API usage, token consumption, model performance, and cost management across all your AI applications.
Everything You Need to Manage LLM Operations
A comprehensive dashboard designed for teams running production AI applications at scale.
API Usage Monitoring
Track total API calls across all your LLM applications with real-time dashboards and historical trend analysis.
Token Consumption
Monitor token usage by model, project, and time period to optimize resource allocation and control costs.
Cost Management
View estimated costs in INR with detailed breakdowns. Set budget alerts to prevent unexpected spending.
Model Performance
Compare models side-by-side with latency, throughput, and accuracy metrics for informed decisions.
Error Matrix
Identify and categorize errors across your LLM stack. Pinpoint failures by model, endpoint, and time window.
Smart Alerts
Receive instant notifications for unusual spending patterns, failed requests, or performance drops.
Start Monitoring Your AI Operations Today
Get real-time visibility into API usage, costs, and model performance. Set up in minutes, not days.
No comments yet. Be the first!