wise-monitoring
 Devops Ninegravity
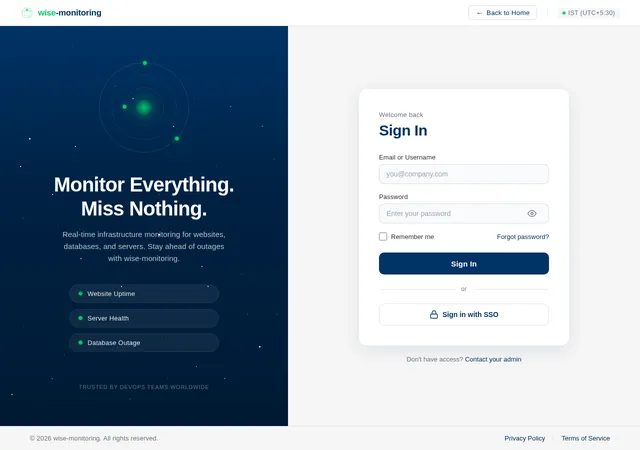
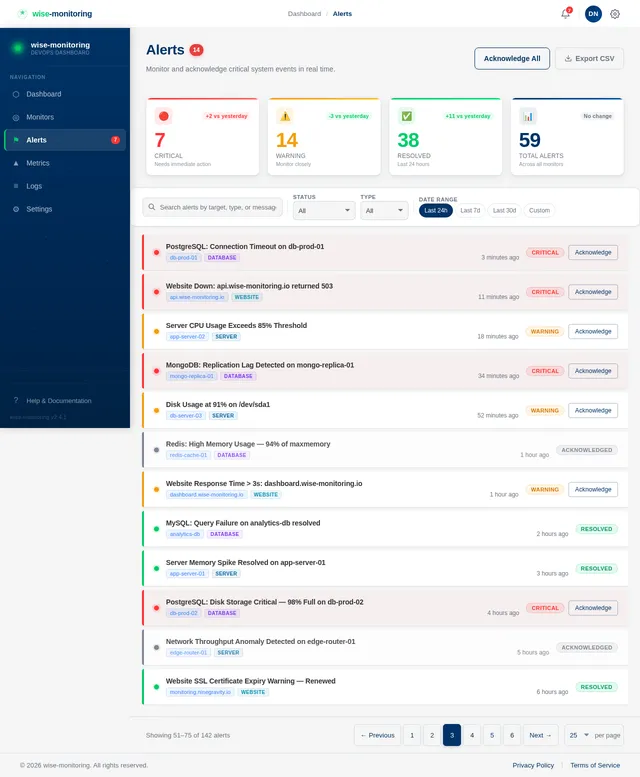
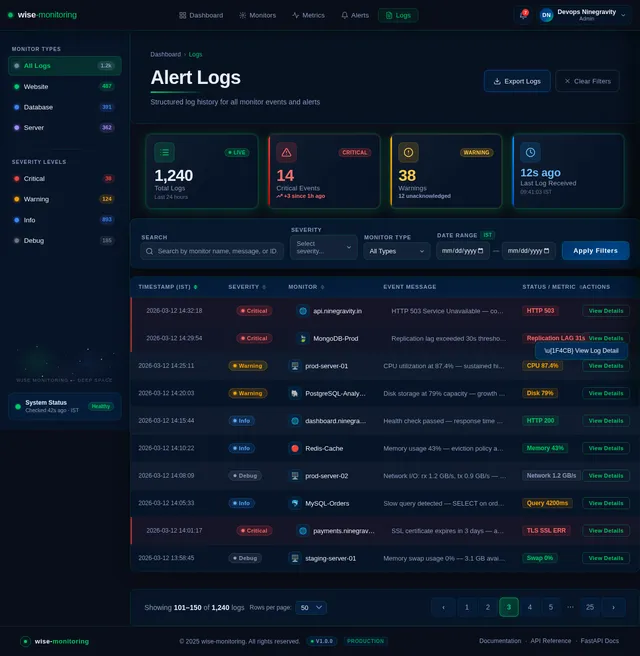
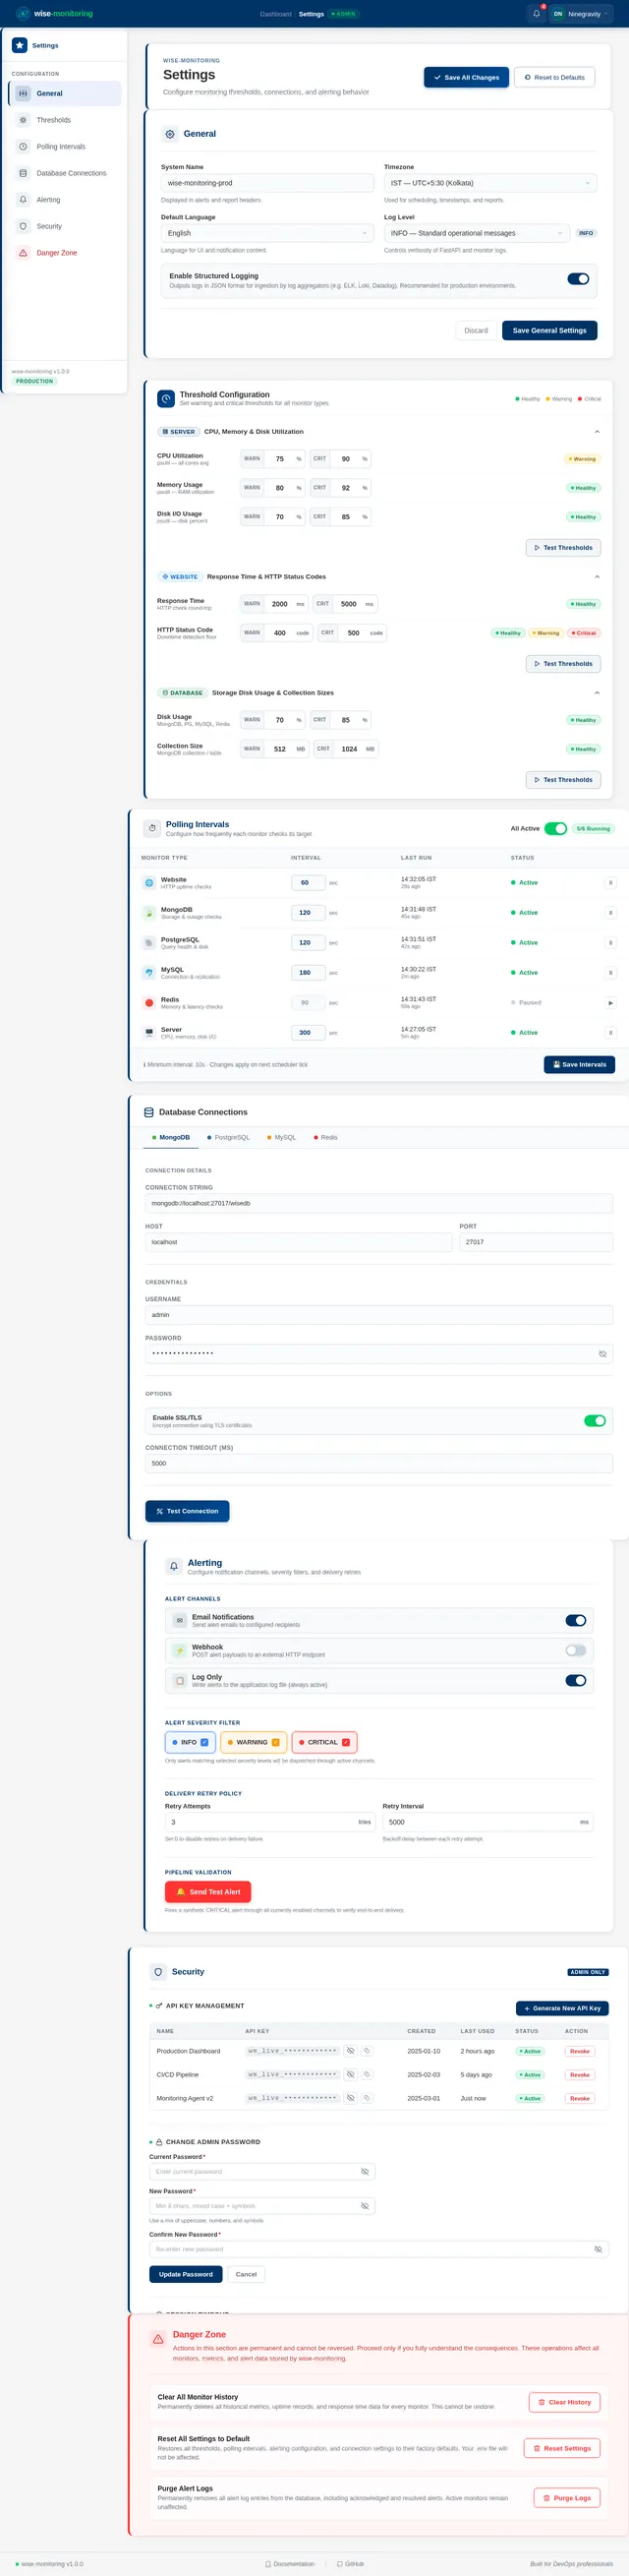
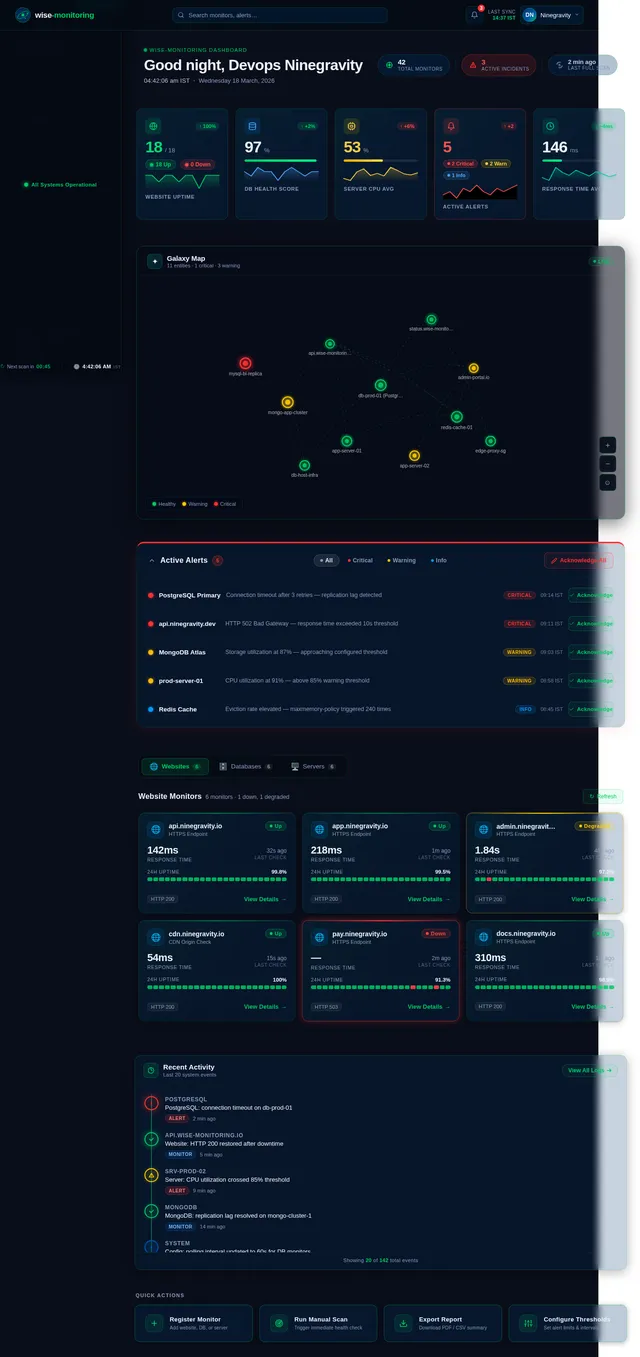
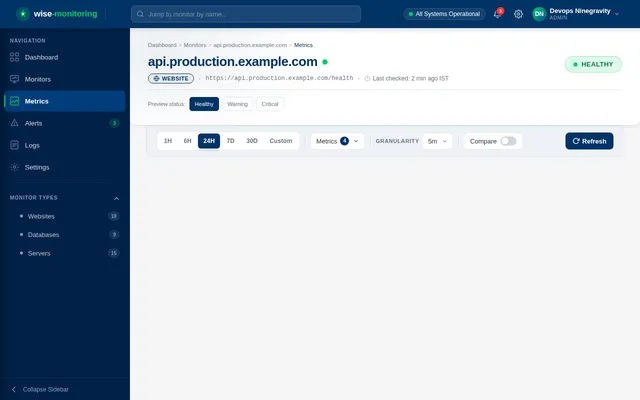
You are a senior full-stack engineer specializing in Python backend systems and DevOps tooling. Build a production-ready monitoring system in Python using **FastAPI** that covers five core monitoring domains: 1. **Website/Uptime Monitoring** — HTTP checks, response time measurement, status code validation, and downtime detection. 2. **Database Storage Monitoring** — Track disk usage, collection/table sizes, document/row counts, and storage growth trends; alert when thresholds are exceeded. 3. **Database Outage Detection** — Probe database connectivity and query health; detect and report connection failures, timeouts, and replication issues. 4. **Server Monitoring & Utilization** — Collect CPU, memory, disk I/O, and network metrics via `psutil`; alert when utilization exceeds defined thresholds. ## Target Databases The system must support monitoring for all of the following databases: - **MongoDB** — use `motor` (async) for connectivity checks, storage metrics, collection sizes, document counts, and replica set health. - **PostgreSQL** — use `asyncpg` for connectivity checks, table sizes, row counts, and replication lag. - **MySQL / MariaDB** — use `aiomysql` for connectivity checks, table sizes, and query health. - **Redis** — use `aioredis` for connectivity checks, memory usage, key counts, and eviction metrics. Each database monitor must be implemented as a standalone module so new database types can be added without modifying existing monitors. ## Technical Stack & Requirements - **Framework:** FastAPI (Python) - **Persistence:** Store all check results, historical metrics, and alert logs in MongoDB — design schemas to support trend queries over time - **Scheduler:** Use `APScheduler` or `asyncio`-based polling for interval-driven checks; all checks must run asynchronously and never block each other - **Error isolation:** Failures in one monitor must never crash the system — implement per-monitor error handling, graceful retries, and structured logging - **Configuration:** Externalize all settings (URLs, connection strings, thresholds, polling intervals) into a `.env` file and `config.py` using `pydantic-settings` ## System Components Build the following as distinct, cleanly separated modules: - **`monitors/`** — Individual monitor implementations (`website`, `mongodb`, `postgresql`, `mysql`, `redis`, `server`) - **`scheduler/`** — Orchestrates all polling intervals and dispatches monitor runs - **`storage/`** — Data access layer for persisting and querying check results and metrics - **`alerting/`** — Threshold evaluation and notification dispatch (log-based + webhook stub) - **`api/`** — FastAPI routers exposing endpoints to: register monitors, retrieve current status, fetch historical metrics, and acknowledge alerts - **`dashboard/`** — A simple HTML/JS status dashboard served by FastAPI showing live monitor states ## Code Quality Standards - Production-level error handling and structured logging throughout (`loguru` or Python `logging`) - Clear docstrings and inline comments explaining each module's responsibility - Pydantic models for all request/response schemas and internal data structures - Basic unit tests for monitor logic using `pytest` and `pytest-asyncio` ## Deliverables Provide the complete project structure, all source files with full working code, a `requirements.txt`, a `.env.example` config file, and setup/run instructions. The system must be runnable locally with `uvicorn`, a running MongoDB instance, and optionally connected target databases.

Comments (0)
Sign in to leave a comment
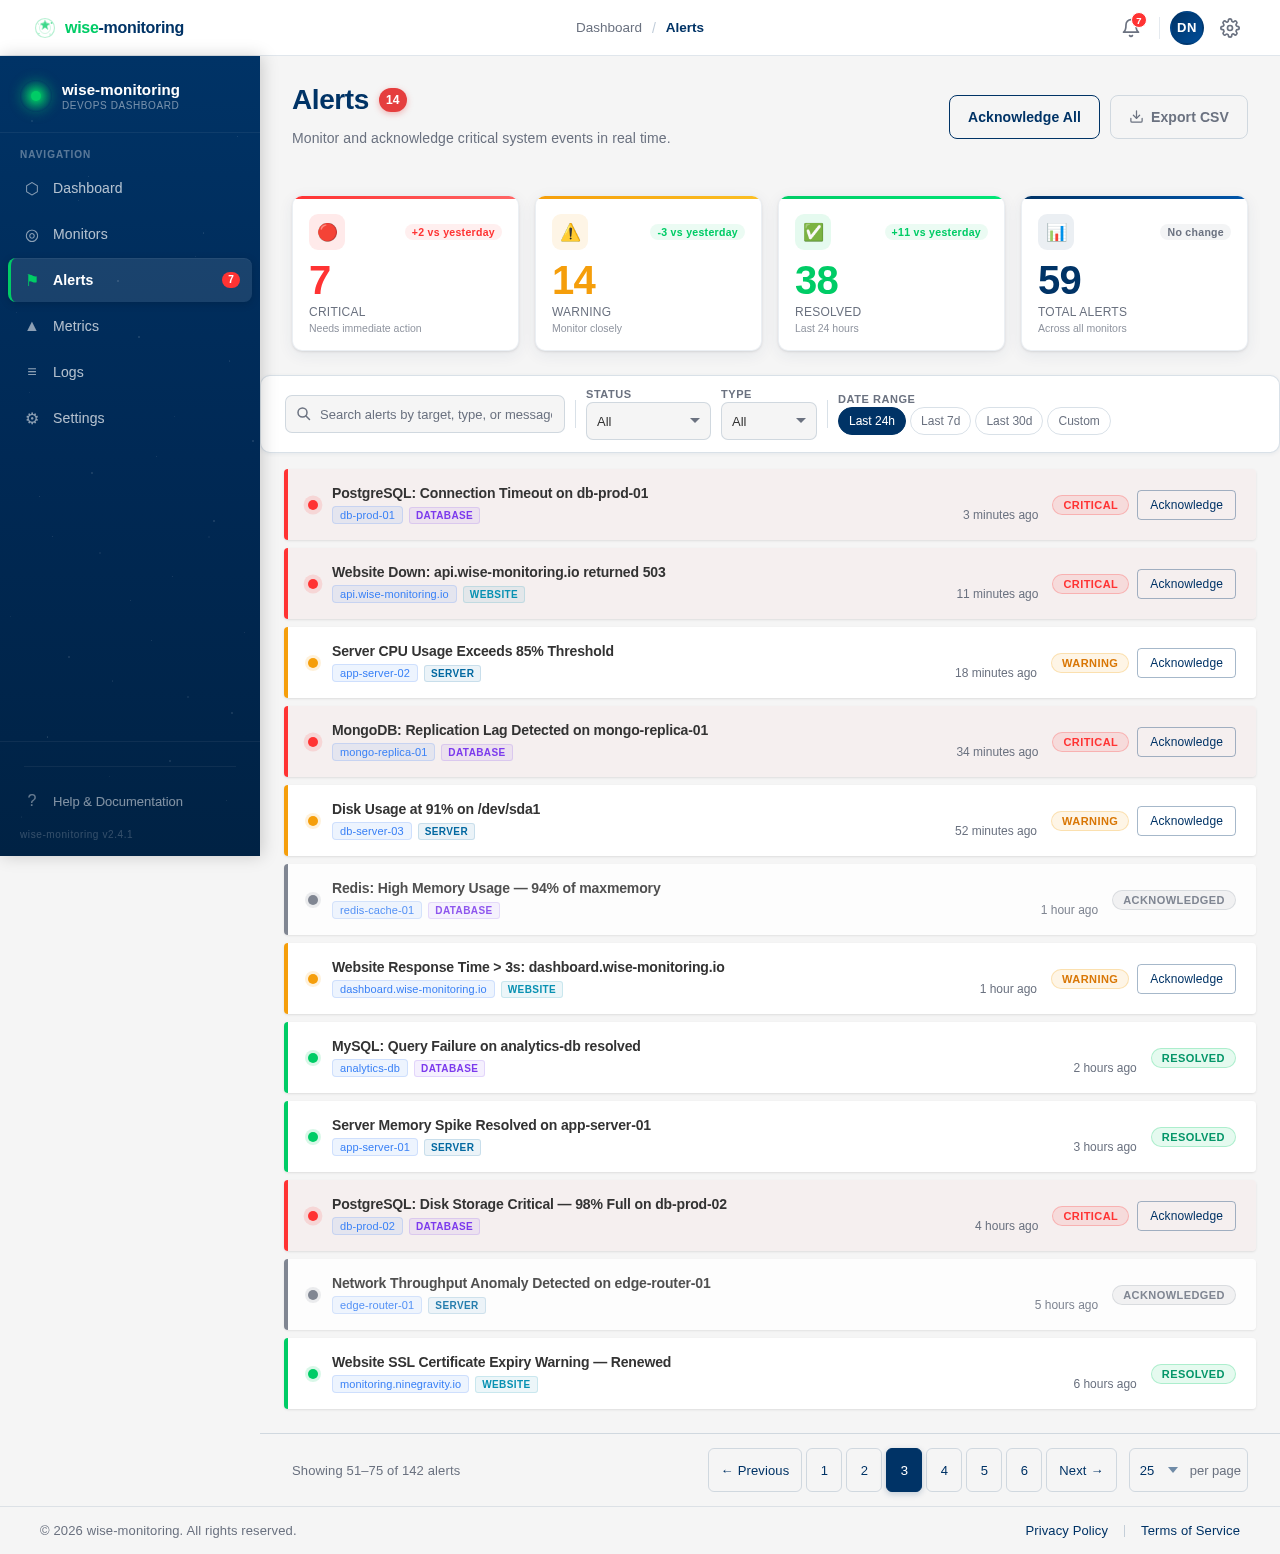
Alerts
14Monitor and acknowledge critical system events in real time.
No comments yet. Be the first!