0%
Process Friction
Leave requests bounce between email threads, spreadsheets, and chat apps. Every hand-off adds delay and a fresh chance for requests to slip through the cracks.
 Bruce Pan
build a leave and approve system


Sign in to leave a comment
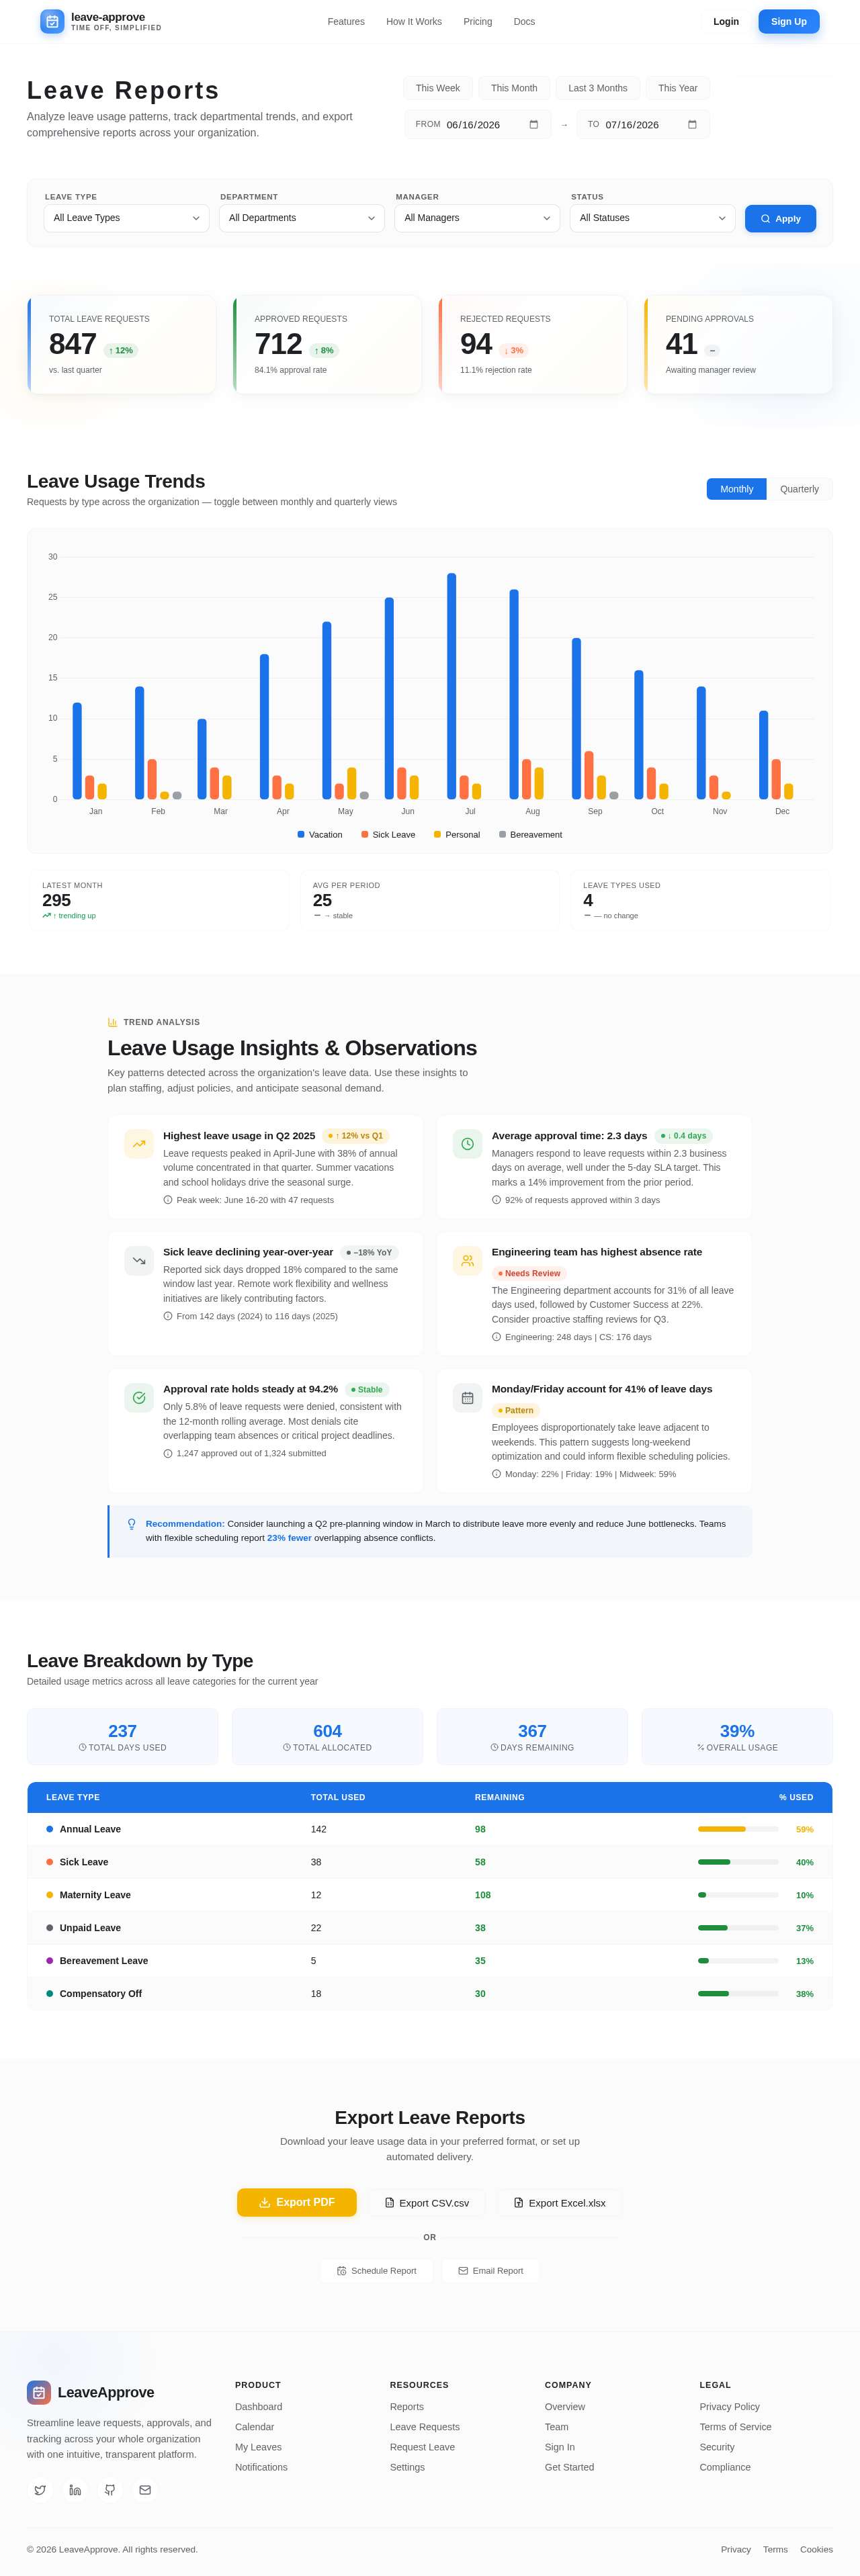
Analyze leave usage patterns, track departmental trends, and export comprehensive reports across your organization.
Requests by type across the organization — toggle between monthly and quarterly views
Key patterns detected across the organization's leave data. Use these insights to plan staffing, adjust policies, and anticipate seasonal demand.
Leave requests peaked in April-June with 38% of annual volume concentrated in that quarter. Summer vacations and school holidays drive the seasonal surge.
Managers respond to leave requests within 2.3 business days on average, well under the 5-day SLA target. This marks a 14% improvement from the prior period.
Reported sick days dropped 18% compared to the same window last year. Remote work flexibility and wellness initiatives are likely contributing factors.
The Engineering department accounts for 31% of all leave days used, followed by Customer Success at 22%. Consider proactive staffing reviews for Q3.
Only 5.8% of leave requests were denied, consistent with the 12-month rolling average. Most denials cite overlapping team absences or critical project deadlines.
Employees disproportionately take leave adjacent to weekends. This pattern suggests long-weekend optimization and could inform flexible scheduling policies.
Recommendation: Consider launching a Q2 pre-planning window in March to distribute leave more evenly and reduce June bottlenecks. Teams with flexible scheduling report 23% fewer overlapping absence conflicts.
Detailed usage metrics across all leave categories for the current year
| Leave Type | Total Used | Remaining | % Used |
|---|---|---|---|
Annual Leave | 142 | 98 | 59% |
Sick Leave | 38 | 58 | 40% |
Maternity Leave | 12 | 108 | 10% |
Unpaid Leave | 22 | 38 | 37% |
Bereavement Leave | 5 | 35 | 13% |
Compensatory Off | 18 | 30 | 38% |
Download your leave usage data in your preferred format, or set up automated delivery.

Submit, review, and approve leave requests in one intuitive workspace. Track balances, spot conflicts on a shared calendar, and keep everyone in sync — from employees to managers to administrators.
Paper forms, scattered approvals, and guesswork scheduling pile up into real lost time. leave-approve replaces all of it with one clear, shared flow.
Leave requests bounce between email threads, spreadsheets, and chat apps. Every hand-off adds delay and a fresh chance for requests to slip through the cracks.
Managers cannot see who is off, when, or why at a glance. Overlapping absences and coverage gaps are discovered far too late to plan around them.
Admins rekey balances, chase approvals, and stitch together reports by hand each week — hours of repetitive work that drains time from real people work.
Hover any date to peek at who's away, drag across days to block out a range, and click to open the full leave request. This is the heart of leave-approve.
Drag across dates to select a range · Hover for details · Click to open a request
From the first request to the final approval, leave-approve keeps employees, managers and administrators aligned — transparently and in real time.
Submit time off in seconds — pick a leave type, set your start and end dates, and track every request from a single dashboard.
Review every team request in one queue. Approve or reject with a click and keep your team moving — no more email back-and-forth.
Configure leave types and policies for your whole organization, then generate usage reports on demand.
The moment a decision is made, everyone knows. Instant alerts keep employees and managers perfectly in sync.
From submitting time off to approving requests and shaping policy, leave-approve adapts to how each person works.
leave-approve guides every leave request along a single transparent path — so employees, managers and admins always know exactly where things stand.
An employee picks their leave type, start and end dates, then sends the request in seconds.
The manager sees the request alongside team coverage and pending balances at a glance.
With full context, the manager approves or rejects the request in a single confident click.
The employee is instantly notified of the decision so nothing gets lost in inboxes.
Everyone tracks live leave status and history from one transparent, shared timeline.
Join teams who've replaced messy spreadsheets and email threads with leave-approve. Submit, review, and approve time-off requests in one clear, transparent workspace — for employees, managers, and admins alike.
No comments yet. Be the first!